Categorical Analysis of Human T Cell Heterogeneity with One-Dimensional Soli-Expression by Nonlinear Stochastic Embedding - PubMed (original) (raw)
Categorical Analysis of Human T Cell Heterogeneity with One-Dimensional Soli-Expression by Nonlinear Stochastic Embedding
Yang Cheng et al. J Immunol. 2016.
Abstract
Rapid progress in single-cell analysis methods allow for exploration of cellular diversity at unprecedented depth and throughput. Visualizing and understanding these large, high-dimensional datasets poses a major analytical challenge. Mass cytometry allows for simultaneous measurement of >40 different proteins, permitting in-depth analysis of multiple aspects of cellular diversity. In this article, we present one-dimensional soli-expression by nonlinear stochastic embedding (One-SENSE), a dimensionality reduction method based on the t-distributed stochastic neighbor embedding (t-SNE) algorithm, for categorical analysis of mass cytometry data. With One-SENSE, measured parameters are grouped into predefined categories, and cells are projected onto a space composed of one dimension for each category. In contrast with higher-dimensional t-SNE, each dimension (plot axis) in One-SENSE has biological meaning that can be easily annotated with binned heat plots. We applied One-SENSE to probe relationships between categories of human T cell phenotypes and observed previously unappreciated cellular populations within an orchestrated view of immune cell diversity. The presentation of high-dimensional cytometric data using One-SENSE showed a significant improvement in distinguished T cell diversity compared with the original t-SNE algorithm and could be useful for any high-dimensional dataset.
Copyright © 2016 by The American Association of Immunologists, Inc.
Figures
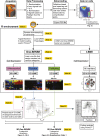
FIGURE 1.
One-SENSE analysis workflow. The workflow describes the step-by-step details for analyzing T cell categorical relationship using One-SENSE. See Materials and Methods.
FIGURE 2.
Neighborhood preservation analysis of _t_-SNE versus PCA used at varying degrees of dimensionality reduction. To quantitatively assess the performance of _t_-SNE compared with linear PCA at various mapping dimensionalities, we used a neighborhood preservation analysis strategy. CD8+ T cells (10,000 random events sampled from 3 different donors as in Fig. 3) were used and 37 parameters for each cell (all parameters used for Figs. 3 and 4). For each cell, the nearest 100 neighbors were identified in 37 dimensions. The same cells were mapped into one to seven dimensional space using _t_-SNE or PCA. Based on these results the 100 nearest neighbors were also identified, and the ratio of these cells matching those identified using all 37 dimensions was calculated to assign a neighborhood preservation ratio. (A) Histograms of the neighborhood preservation ratio for this 10,000-cell dataset are plotted for the one- to four-dimensional _t_-SNE and PCA mappings. (B) Average neighborhood preservation ratios are plotted for one- to seven-dimensional _t_-SNE versus PCA mappings. Note that one-dimensional _t_-SNE outperforms three-dimensional PCA on this dataset (in terms of neighborhood preservation), and that gains in performance coming from the use of ≥2 dimensions of _t_-SNE are modest compared with that achieved by just a single dimension. Specifically, _t_-SNE performance in one dimension is already at >70% of the maximal performance possible for higher dimensional _t_-SNE mapping of these data. Note though that _t_-SNE performance in >3-dimensional mappings can improve by increasing the number of degrees of freedom of the Student t kernel (15).
FIGURE 3.
Rationale and representation of One-SENSE. Human PBMCs isolated from three healthy donors were stained and acquired by mass cytometry for dimensionality reduction analysis. Total CD8+ T cells were exported and analyzed by _t_-SNE and One-SENSE in parallel. (A) Plots show comparison of protein marker visualization between _t_-SNE (Tutti-expression) and One-SENSE (Soli-expression) in different dimensions. Protein markers were assigned to various immunological categories based on previous studies. Shown is a One-SENSE view of CD8+ T cells displaying differentiation against function. Cells are aligned to a range of 250 bins (column of cells) on the categorical dimensions (axes) that are composed of cellular protein expression. Each categorical dimension is a one-dimensional _t_-SNE analysis (Fig. 1). Heat plots indicate the frequency of marker-positive cells in each bin. One-SENSE shows nonfunctional/naive T cells are mainly located in the upper left corner of the map, whereas multifunctional effector and memory T cells have diverse combination clusters on the opposite area. Cellular features of clusters can be described by the coordination of cis and trans coexpression from each axis. (B) Comparison of One-SENSE and _t_-SNE on MAIT cells is shown (top). Histograms (bottom) of the indicated markers are shown for the gated populations of MAIT cells. (C) The frequency and ratio of MAIT 1 and MAIT 2 population identified between donors using One-SENSE.
FIGURE 4.
Versatile differentiation and trafficking of functional peripheral Tc1-profiled CD8+ T cells. Functional CD8+ T cells were defined by cells expressing at least one functional marker (Supplemental Fig. 1, Supplemental Table I) and combined by Boolean gating before One-SENSE analysis. (A) Cells were clustered using three independent categorical dimensions (differentiation, function, and trafficking). The functional heterogeneity of CD8+ T cells is observed by the function dimension on the One-SENSE map. Diverse patterns of differentiation and trafficking of functional CD8+ T cells are shown by changing the y dimension. Numerous functional subsets are indicated using this method as shown. (B) Differentiation and trafficking status of CD8+ T cells that have the same functional profile are further analyzed using One-SENSE. Three Tc1 subsets are observed on the differentiation dimension, whereas the trafficking dimension further segregates each of them into the other five subpopulations. (C) _t_-SNE view shows very minimum separation of these subpopulations. (D) Summarized One-SENSE plot represents the complex heterogeneity of the Tc1 subset.
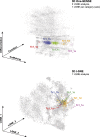
FIGURE 5.
Three-dimensional images of trafficking characteristics of Tc1-profiled CD8+ T cells subsets. Comparison of three-dimensional One-SENSE and three-dimensional _t_-SNE analysis. Functional CD8+ T cells were gated (Materials and Methods), and Tc1_1 CD8+ T cells were defined as shown in Fig. 4. Three-dimensional One-SENSE view of functional CD8+ T cells reveals unprecedented degree of heterogeneity, whereas three-dimensional _t_-SNE poorly segregates these minor subpopulations. Cells in three-dimensional image of One-SNESE were projected from three different axes of categorical dimensions (Fig. 1). Five subpopulations of Tc1 subset 1 (Tc1_1) are colored as shown here and in Supplementary Videos 1 and 2, for three-dimensional video of One-SESNE and _t_-SNE, respectively.
FIGURE 6.
Diverse subpopulations of human peripheral Tregs. CD4+ T cells with Treg-related function (FOXP3, CD25, CD39, CTLA-4, IL-10, and LAG-3) were exported and combined by Boolean gating. (A) Cells were analyzed by One-SENSE using the “Tregness” dimension against all other markers. Several functional Treg-like subsets are revealed by One-SENSE and separated by cis coexpression of different functional Treg markers. (B) Two Treg-like subsets (4 and 5) can be further dissected into multiple subpopulations by other functional or localization markers.
Similar articles
- Quantitative Comparison of Conventional and t-SNE-guided Gating Analyses.
Toghi Eshghi S, Au-Yeung A, Takahashi C, Bolen CR, Nyachienga MN, Lear SP, Green C, Mathews WR, O'Gorman WE. Toghi Eshghi S, et al. Front Immunol. 2019 Jun 5;10:1194. doi: 10.3389/fimmu.2019.01194. eCollection 2019. Front Immunol. 2019. PMID: 31231371 Free PMC article. - Automated optimized parameters for T-distributed stochastic neighbor embedding improve visualization and analysis of large datasets.
Belkina AC, Ciccolella CO, Anno R, Halpert R, Spidlen J, Snyder-Cappione JE. Belkina AC, et al. Nat Commun. 2019 Nov 28;10(1):5415. doi: 10.1038/s41467-019-13055-y. Nat Commun. 2019. PMID: 31780669 Free PMC article. - Dissecting alterations in human CD8+ T cells with aging by high-dimensional single cell mass cytometry.
Shin MS, Yim K, Moon K, Park HJ, Mohanty S, Kim JW, Montgomery RR, Shaw AC, Krishnaswamy S, Kang I. Shin MS, et al. Clin Immunol. 2019 Mar;200:24-30. doi: 10.1016/j.clim.2019.01.005. Epub 2019 Jan 16. Clin Immunol. 2019. PMID: 30659916 Free PMC article. - Deep Profiling Human T Cell Heterogeneity by Mass Cytometry.
Cheng Y, Newell EW. Cheng Y, et al. Adv Immunol. 2016;131:101-34. doi: 10.1016/bs.ai.2016.02.002. Epub 2016 Apr 8. Adv Immunol. 2016. PMID: 27235682 Review. - The end of gating? An introduction to automated analysis of high dimensional cytometry data.
Mair F, Hartmann FJ, Mrdjen D, Tosevski V, Krieg C, Becher B. Mair F, et al. Eur J Immunol. 2016 Jan;46(1):34-43. doi: 10.1002/eji.201545774. Epub 2015 Nov 30. Eur J Immunol. 2016. PMID: 26548301 Review.
Cited by
- Use of Mass Cytometry to Profile Human T Cell Exhaustion.
Winkler F, Bengsch B. Winkler F, et al. Front Immunol. 2020 Jan 22;10:3039. doi: 10.3389/fimmu.2019.03039. eCollection 2019. Front Immunol. 2020. PMID: 32038613 Free PMC article. Review. - Poly- and Perfluoroalkyl Substances (PFAS): Do They Matter to Aquatic Ecosystems?
Nayak S, Sahoo G, Das II, Mohanty AK, Kumar R, Sahoo L, Sundaray JK. Nayak S, et al. Toxics. 2023 Jun 19;11(6):543. doi: 10.3390/toxics11060543. Toxics. 2023. PMID: 37368643 Free PMC article. Review. - Fast interpolation-based t-SNE for improved visualization of single-cell RNA-seq data.
Linderman GC, Rachh M, Hoskins JG, Steinerberger S, Kluger Y. Linderman GC, et al. Nat Methods. 2019 Mar;16(3):243-245. doi: 10.1038/s41592-018-0308-4. Epub 2019 Feb 11. Nat Methods. 2019. PMID: 30742040 Free PMC article. - Early transcriptional and epigenetic regulation of CD8+ T cell differentiation revealed by single-cell RNA sequencing.
Kakaradov B, Arsenio J, Widjaja CE, He Z, Aigner S, Metz PJ, Yu B, Wehrens EJ, Lopez J, Kim SH, Zuniga EI, Goldrath AW, Chang JT, Yeo GW. Kakaradov B, et al. Nat Immunol. 2017 Apr;18(4):422-432. doi: 10.1038/ni.3688. Epub 2017 Feb 20. Nat Immunol. 2017. PMID: 28218746 Free PMC article. - A holistic approach to understanding immune-mediated inflammatory diseases: bioinformatic tools to integrate omics data.
Borrego-Yaniz G, Terrón-Camero LC, Kerick M, Andrés-León E, Martin J. Borrego-Yaniz G, et al. Comput Struct Biotechnol J. 2023 Nov 28;23:96-105. doi: 10.1016/j.csbj.2023.11.045. eCollection 2024 Dec. Comput Struct Biotechnol J. 2023. PMID: 38089468 Free PMC article. Review.
References
- Lanier L. L., Engleman E. G., Gatenby P., Babcock G. F., Warner N. L., Herzenberg L. A. 1983. Correlation of functional properties of human lymphoid cell subsets and surface marker phenotypes using multiparameter analysis and flow cytometry. Immunol. Rev. 74: 143–160. - PubMed
- Bandura D. R., Baranov V. I., Ornatsky O. I., Antonov A., Kinach R., Lou X., Pavlov S., Vorobiev S., Dick J. E., Tanner S. D. 2009. Mass cytometry: technique for real time single cell multitarget immunoassay based on inductively coupled plasma time-of-flight mass spectrometry. Anal. Chem. 81: 6813–6822. - PubMed
MeSH terms
LinkOut - more resources
Full Text Sources
Other Literature Sources
Molecular Biology Databases


