Hierarchical deconstruction of mouse olfactory sensory neurons: from whole mucosa to single-cell RNA-seq - PubMed (original) (raw)
Hierarchical deconstruction of mouse olfactory sensory neurons: from whole mucosa to single-cell RNA-seq
Luis R Saraiva et al. Sci Rep. 2015.
Abstract
The mouse olfactory mucosa is a complex chemosensory tissue composed of multiple cell types, neuronal and non-neuronal. We have here applied RNA-seq hierarchically, in three steps of decreasing cellular heterogeneity: starting with crude tissue samples dissected from the nose, proceeding to flow-cytometrically sorted pools of mature olfactory sensory neurons (OSNs), and finally arriving at single mature OSNs. We show that 98.9% of intact olfactory receptor (OR) genes are expressed in mature OSNs. We uncover a hitherto unknown bipartition among mature OSNs. We find that 19 of 21 single mature OSNs each express a single intact OR gene abundantly, consistent with the one neuron-one receptor rule. For the 9 single OSNs where the two alleles of the abundantly expressed OR gene exhibit single-nucleotide polymorphisms, we demonstrate that monoallelic expression of the abundantly expressed OR gene is extremely tight. The remaining two single mature OSNs lack OR gene expression but express Trpc2 and Gucy1b2. We establish these two cells as a neuronal cell type that is fundamentally distinct from canonical, OR-expressing OSNs and that is defined by the differential, higher expression of 55 genes. We propose this tiered experimental approach as a paradigm to unravel gene expression in other cellularly heterogeneous systems.
Figures
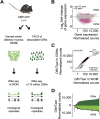
Figure 1. Differential expression analysis of mouse olfactory sensory neurons (OSNs) and whole olfactory mucosa (WOM).
(A) Schematic of the RNA-seq experimental strategy. After dissection of the WOM of OMP-GFP (+/−) male and female mice, pools of ~10 million OSNs were collected by FACS. RNA was extracted from these, along with WOM samples, cDNA generated, and libraries were amplified for deep sequencing. (B) Differential gene expression analysis between the transcriptomes of OSNs and WOM. Statistically significant differentially expressed genes (fold-change >3; FDR < 5%) are highlighted in pink. (C) Comparison of OR and TAAR gene expression levels. A scatter plot of OR and TAAR gene expression levels (black) in the WOM versus the sorted OSNs reveals a strong correlation. The red line represents the 1:1 diagonal. Classical marker genes for mature OSNs (yellow) are similarly enriched. (D) Distribution of OR and TAAR gene expression (normalized counts) as a barplot, for both OSNs and WOM. Genes are displayed in ascending order of their expression values in OSNs (dark green). Matching values are plotted for WOM (bright green), demonstrating that the dynamic distribution of OR gene expression is largely conserved, but differs in OR genes expressed at low levels in WOM (arrow).
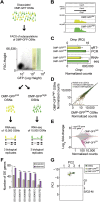
Figure 2. Differential expression analysis of mature OSN subpopulations.
(A) Schematic of the RNA-seq experimental strategy. The WOM of OMP-GFP (+/−) male mice was dissected and pools of ~10,000 OSNs from two non-overlapping subpopulations, OMP-GFPlow (light green) and OMP-GFPhigh (dark green), were collected by FACS gating based on fluorescence intensity. Subsequently the RNA was extracted, cDNA generated, and libraries were amplified for deep-sequencing. (B) Representative coverage plot showing the distribution of RNA-seq reads across the Omp locus (which is located within an intron of Capn5) is similar in both subpopulations. (C) The number of Omp normalized counts is 1.5 times higher in the OMP-GFPhigh population (unpaired _t_-test, 2 tails, *P = 0.025). Analysis of the same samples by TaqMan qRT-PCR verified this increase. (D) Scatter plot showing the expression levels of previously reported immature (brown) and mature (green) OSN-specific markers in the OMP-GFPlow and OMP-GFPhigh OSNs. Both sets of genes are expressed at equivalent levels in both populations (Wilcoxon rank sum test, P = 0.45 and P = 0.22 for mature and immature gene sets), but mature specific genes are expressed considerably higher (Wilcoxon rank sum test, P < 2.2–16 and P < 2.2–16 for OMP-GFPlow and OMP-GFPhigh). (E) Differential gene expression analysis between the transcriptomes of OMP-GFPlow and OMP-GFPhigh OSNs. Statistically significant differentially expressed (FDR < 5%) genes are highlighted in pink. (F) Functional terms enrichment analysis between the OMP-GFPlow and OMP-GFPhigh differentially expressed genes identified a total of 88 GO terms significantly overrepresented (FDR < 5%). The bar graph indicates the expected and observed number of DE genes for six of these GO terms (*P ≤ 0.05, **P ≤ 0.01, ***P ≤ 0.001). The full list and GO category names is in Supplementary Data S2. (G) Projection of the OSNs, OMP-GFPlow and OMP-GFPhigh samples onto the cell cycle Principal Component Analysis (PCA) that differentiates between cell cycle stages (see Supplementary Fig. S2B and Supplementary Methods for details). Principal Component 1 (PC1) segregates the samples based on their cell cycle stage, with samples in G1 having negative values and samples in S/G2-M positive values. All tested samples are in the G1 stage.
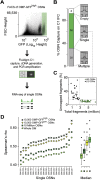
Figure 3. RNA-seq in single mature OSNs.
(A) Schematic of the single-cell RNA-seq experimental strategy. After dissection of WOM of a heterozygous OMP-GFP mouse, 5,000 mature OMP-GFPhigh OSNs were collected by FACS into a C1 IFC (10–17 μm, Fluidigm). Using the Fluidigm C1 platform, single cells were sorted, imaged, RNA extracted, cDNA generated, and libraries amplified for deep-sequencing. A representative bright field and fluorescence image for a captured single OSN is shown in the middle panel. (B) Capture rate for single cells: 30 wells captured more than one cell and/or debris, 58 captured single cells, and 8 were empty. Representative bright field images are shown for each of these categories. (C) The 58 captured single OSNs were subjected to stringent, hierarchical quality control criteria, which defined low-quality (LQ, black dots) and high-quality cells (HQ, green dots, see also Supplementary Fig. S3; and Supplementary Methods). (D) Spearman correlation coefficients of the 21 single cells used in our downstream analysis with the WOM and OSN populations (10 million, OMP-GFPlow and OMP-GFPhigh OSNs). As expected, the single cells correlate best with the OMP-GFPhigh OSNs, followed by the OMP-GFPlow OSNs, the 10 million OSNs and finally WOM. To the right of the graph, boxplots show the cumulative data for each comparison. The thick black horizontal bar corresponds to the median and data points that are outside 1.5 times the interquartile range (the box) are indicated as outliers (black dots).
Figure 4. Captured single cells express canonical marker genes of mature OSNs.
Heatmap of the expression of canonical olfactory cell-specific markers across the WOM and all OSN samples analyzed. While the WOM and OSN population samples express markers for all cell types, the single cells specifically express high levels of mature OSN markers. mOSNs: mature OSNs, iOSNs: immature OSNs, GBCs: globose basal cells, HBCs: horizontal basal cells, SUSs: sustentacular cells, VSNs: vomeronasal sensory neurons.
Figure 5. OR gene expression patterns single OSNs.
(A) Heatmap of the expression levels of the most variable genes in single OSNs. All 598 highly expressed genes (≥1000 normalized counts in at least 1 sample) with a coefficient of variation ≥4 are represented. The identity of these genes are presented in Supplementary Data S3. (B) Normal-like distributions were fitted for all lowly expressed (blue line) and highly expressed (red line) OR genes. Only genes at or above the intersection of both curves (855 normalized counts) were considered as abundantly expressed. (C) Expression level of the most abundant OR in each of the 21 single OSNs. The most abundant ORs in OSN 259 and OSN 261 are expressed at extremely low levels. (D) Phylogenetic tree of all mouse OR genes (Class I and II in black and grey, respectively). The most abundant ORs in all the single OSNs analyzed are depicted as red circles. (E) Expression levels of all ORs in OSN 188. The two most abundant ORs in that cell are indicated. (F,G) Coverage plots of the RNA-seq data for OSN 188 mapping to the first (Olfr1348, (F)) and second (Olfr1372-ps1, (G)) most abundant ORs. Boxes correspond to exons and arrowheads indicate the strand of the gene. The existing Ensembl annotations are shown in the top box. Optimized OR gene models used in our analysis are shown in the middle box. The sequencing data mapping to the OR gene models is below. (H) Expression levels of all ORs in OSN 236. The two most abundant ORs in that cell are indicated. (I,J) Coverage plots of the RNA-seq data for OSN 236 mapping to the first (Olfr556, (I)) and second (Olfr1509 (J)) most abundant ORs. Boxes correspond to exons and arrowheads indicate the strand of the gene. The existing Ensembl annotations are shown in the top box. Optimized OR gene models used in our analysis are shown in the middle box. The sequencing data mapping to the OR gene models is below.
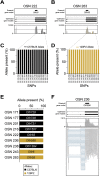
Figure 6. Monoallelic expression of OR genes in single OSNs.
(A,B) Coverage plots of the sequencing data mapping to the same OR (Olfr55) in two cells, OSN 222 (A) and OSN 263 (B). Boxes correspond to exons and arrowheads indicate the strand of the gene. The existing Ensembl annotations are shown in the top box. Optimized OR gene models used in our analysis are shown in the middle box. The sequencing data mapping to the OR gene models is below. Reported single nucleotide polymorphisms (SNPs) used to map the C57BL/6 and 129P2 alleles are shown in black and golden vertical lines, respectively. (C,D) The percentage (%) of sequencing data showing the C57BL/6 (black) or the 129P2 (gold) allele at each SNP on Olfr55 in OSN 222 (C) and OSN 263 (D). Genomic coordinates on chromosome 17 for each SNP are indicated in the x-axis. (E) The percentage (%) of sequencing data showing the C57BL/6 (black) or the 129P2 (gold) allele for all ORs with at least one reported informative SNP. In all cases, only one allele is expressed per cell. (F) Example of differential splicing of an OR gene. The sequencing reads in the bottom panel are represented by grey boxes; blue lines join portions of reads that map across exon junctions. Two isoforms are present, with the differential inclusion of the second exon. Thus individual OSNs express multiple isoforms of the chosen OR gene.
Figure 7. Gene expression profile of another neuronal type in the MOE.
(A) Scatter plot of the mean expression values for all genes in the two cells lacking OR gene expression versus the remaining 19 OSNs. Statistically significant differentially expressed genes (FDR < 5%) are highlighted in pink; those that show consistent high expression in both cells lacking OR gene expression are in purple. The three most abundant DE genes are indicated (Gucy1b2, Sln and Emx1). (B) Heatmap of the 55 DE genes that constitute the gene expression signature of the cells lacking OR gene expression. (C,D) Cryosections of adult mouse MOE hybridized with cRNA probes for the two most highly expressed DE genes – Gucy1b2 (C) and Sln (D). The hybridization signals are sparsely distributed within the MOE. (E) Two-color in situ hybridization of the top ranked marker (Gucy1b2) with Trpc2. As previously shown, some, but not all of the Trpc2 cells in the MOE also coexpress Gucy1b2. (F) Two-color in situ hybridization of the top ranked marker (Gucy1b2) with other differentially expressed genes, Sln, Emx1 and Sncg. Arrowheads point to labeled cells. Scale bars, 50 μm.
Similar articles
- Coordination of olfactory receptor choice with guidance receptor expression and function in olfactory sensory neurons.
Dang P, Fisher SA, Stefanik DJ, Kim J, Raper JA. Dang P, et al. PLoS Genet. 2018 Jan 31;14(1):e1007164. doi: 10.1371/journal.pgen.1007164. eCollection 2018 Jan. PLoS Genet. 2018. PMID: 29385124 Free PMC article. - The extremely broad odorant response profile of mouse olfactory sensory neurons expressing the odorant receptor MOR256-17 includes trace amine-associated receptor ligands.
Tazir B, Khan M, Mombaerts P, Grosmaitre X. Tazir B, et al. Eur J Neurosci. 2016 Mar;43(5):608-17. doi: 10.1111/ejn.13153. Epub 2016 Jan 28. Eur J Neurosci. 2016. PMID: 26666691 Free PMC article. - Odorant receptor gene choice and axonal wiring in mice with deletion mutations in the odorant receptor gene SR1.
Fuss SH, Zhu Y, Mombaerts P. Fuss SH, et al. Mol Cell Neurosci. 2013 Sep;56:212-24. doi: 10.1016/j.mcn.2013.05.002. Epub 2013 May 18. Mol Cell Neurosci. 2013. PMID: 23688909 - Maturation of the Olfactory Sensory Neuron and Its Cilia.
McClintock TS, Khan N, Xie C, Martens JR. McClintock TS, et al. Chem Senses. 2020 Dec 5;45(9):805-822. doi: 10.1093/chemse/bjaa070. Chem Senses. 2020. PMID: 33075817 Free PMC article. Review. - One neuron-one receptor rule in the mouse olfactory system.
Serizawa S, Miyamichi K, Sakano H. Serizawa S, et al. Trends Genet. 2004 Dec;20(12):648-53. doi: 10.1016/j.tig.2004.09.006. Trends Genet. 2004. PMID: 15522461 Review.
Cited by
- Higher airborne pollen concentrations correlated with increased SARS-CoV-2 infection rates, as evidenced from 31 countries across the globe.
Damialis A, Gilles S, Sofiev M, Sofieva V, Kolek F, Bayr D, Plaza MP, Leier-Wirtz V, Kaschuba S, Ziska LH, Bielory L, Makra L, Del Mar Trigo M; COVID-19/POLLEN study group; Traidl-Hoffmann C. Damialis A, et al. Proc Natl Acad Sci U S A. 2021 Mar 23;118(12):e2019034118. doi: 10.1073/pnas.2019034118. Proc Natl Acad Sci U S A. 2021. PMID: 33798095 Free PMC article. - Update on neurological manifestations of COVID-19.
Yavarpour-Bali H, Ghasemi-Kasman M. Yavarpour-Bali H, et al. Life Sci. 2020 Sep 15;257:118063. doi: 10.1016/j.lfs.2020.118063. Epub 2020 Jul 9. Life Sci. 2020. PMID: 32652139 Free PMC article. Review. - Neuroinvasion, neurotropic, and neuroinflammatory events of SARS-CoV-2: understanding the neurological manifestations in COVID-19 patients.
Yachou Y, El Idrissi A, Belapasov V, Ait Benali S. Yachou Y, et al. Neurol Sci. 2020 Oct;41(10):2657-2669. doi: 10.1007/s10072-020-04575-3. Epub 2020 Jul 28. Neurol Sci. 2020. PMID: 32725449 Free PMC article. Review. - Low survival rate of young adult-born olfactory sensory neurons in the undamaged mouse olfactory epithelium.
Savya SP, Kunkhyen T, Cheetham CEJ. Savya SP, et al. J Bioenerg Biomembr. 2019 Feb;51(1):41-51. doi: 10.1007/s10863-018-9774-8. Epub 2018 Oct 9. J Bioenerg Biomembr. 2019. PMID: 30302619 Free PMC article. - Expression pattern of Stomatin-domain proteins in the peripheral olfactory system.
Gonzalez-Velandia KY, Hernandez-Clavijo A, Menini A, Dibattista M, Pifferi S. Gonzalez-Velandia KY, et al. Sci Rep. 2022 Jul 6;12(1):11447. doi: 10.1038/s41598-022-15572-1. Sci Rep. 2022. PMID: 35794236 Free PMC article.
References
- Huard J. M., Youngentob S. L., Goldstein B. J., Luskin M. B. & Schwob J. E. Adult olfactory epithelium contains multipotent progenitors that give rise to neurons and non-neural cells. J Comp Neurol 400, 469–486 (1998). - PubMed
- Buck L. & Axel R. A novel multigene family may encode odorant receptors: a molecular basis for odor recognition. Cell 65, 175–187 (1991). - PubMed
- Malnic B., Hirono J., Sato T. & Buck L. B. Combinatorial receptor codes for odors. Cell 96, 713–723 (1999). - PubMed
- Chess A., Simon I., Cedar H. & Axel R. Allelic inactivation regulates olfactory receptor gene expression. Cell 78, 823–834 (1994). - PubMed
MeSH terms
Substances
LinkOut - more resources
Full Text Sources
Other Literature Sources
Molecular Biology Databases
Research Materials


