Automated data collection in single particle electron microscopy - PubMed (original) (raw)
Review
Automated data collection in single particle electron microscopy
Yong Zi Tan et al. Microscopy (Oxf). 2016 Feb.
Abstract
Automated data collection is an integral part of modern workflows in single particle electron microscopy (EM) research. This review surveys the software packages available for automated single particle EM data collection. The degree of automation at each stage of data collection is evaluated, and the capabilities of the software packages are described. Finally, future trends in automation are discussed.
Keywords: automation; data collection; high throughput; single particle electron microscopy; software packages; target acquisition.
© The Author 2015. Published by Oxford University Press on behalf of The Japanese Society of Microscopy. All rights reserved. For permissions, please e-mail: journals.permissions@oup.com.
Figures
Fig. 1.
Negative stain electron micrographs of the same field at different defocus values. (a) is closest to focus, followed by (b) and (c) with sequentially higher defocus values. The corresponding Fourier transforms of each micrograph are shown (d–f). Defocus values were estimated using CTFFind3 [38]. Images had a pixel size of 1.83 Å and were taken with a 200 kV microscope with _C_s of 2.0 mm.
Fig. 2.
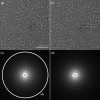
Comparison of non-astigmatic (a) and strongly astigmatic (b) micrographs. Their corresponding Fourier transforms are shown below (c and d). Images had a pixel size of 1.83 Å and were taken with a 200-kV microscope with _C_s of 2.0 mm.
Fig. 3.
Zemlin tableaus acquired with coma-free alignment (a) and without coma-free alignment (b). The calculated resolution limit (based on Eq. (2)) for the aberration seen in (b) and corrected in (a) is ∼0.55 nm, given a resolution limit cutoff at 45° phase error, using a 200 kV microscope with _C_s of 2.0 mm.
Fig. 4.
MSI procedure employed in data collection software for both cryo T20S proteasome (a) and negative stain 50S ribosome (b) samples. The white boxes indicate the area where an image is acquired at subsequent higher magnification and the white arrows point to a single particle of the respective proteins.
Fig. 5.
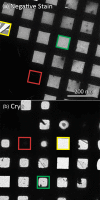
Variation of squares in a typical negative stain (a) and cryo-EM (b) grid. An example of a broken square (yellow), a square with too thick ice/stain (red) and a potentially good square (green) are shown in the respective colors above.
Fig. 6.
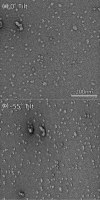
Electron micrographs of negative stain samples at 0° tilt (a) and −55° tilt (b).
Fig. 7.
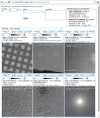
Remote monitoring of data collection by LOI.
Similar articles
- Focus: The interface between data collection and data processing in cryo-EM.
Biyani N, Righetto RD, McLeod R, Caujolle-Bert D, Castano-Diez D, Goldie KN, Stahlberg H. Biyani N, et al. J Struct Biol. 2017 May;198(2):124-133. doi: 10.1016/j.jsb.2017.03.007. Epub 2017 Mar 23. J Struct Biol. 2017. PMID: 28344036 - Strategies for Automated CryoEM Data Collection Using Direct Detectors.
Cheng A, Tan YZ, Dandey VP, Potter CS, Carragher B. Cheng A, et al. Methods Enzymol. 2016;579:87-102. doi: 10.1016/bs.mie.2016.04.008. Epub 2016 Jun 22. Methods Enzymol. 2016. PMID: 27572724 Review. - Automated image acquisition for single-particle reconstruction using p97 as the biological sample.
Rouiller I, Pulokas J, Butel VM, Milligan RA, Wilson-Kubalek EM, Potter CS, Carragher BO. Rouiller I, et al. J Struct Biol. 2001 Feb-Mar;133(2-3):102-7. doi: 10.1006/jsbi.2001.4367. J Struct Biol. 2001. PMID: 11472082 - Automated pipelines for rapid evaluation during cryoEM data acquisition.
Mendez JH, Chua EYD, Paraan M, Potter CS, Carragher B. Mendez JH, et al. Curr Opin Struct Biol. 2023 Dec;83:102729. doi: 10.1016/j.sbi.2023.102729. Epub 2023 Nov 21. Curr Opin Struct Biol. 2023. PMID: 37988815 Review. - Automation of Continuous-Rotation Data Collection for MicroED.
de la Cruz MJ. de la Cruz MJ. Methods Mol Biol. 2021;2215:321-327. doi: 10.1007/978-1-0716-0966-8_16. Methods Mol Biol. 2021. PMID: 33368012
Cited by
- High resolution single particle cryo-electron microscopy using beam-image shift.
Cheng A, Eng ET, Alink L, Rice WJ, Jordan KD, Kim LY, Potter CS, Carragher B. Cheng A, et al. J Struct Biol. 2018 Nov;204(2):270-275. doi: 10.1016/j.jsb.2018.07.015. Epub 2018 Jul 25. J Struct Biol. 2018. PMID: 30055234 Free PMC article. - Towards correlative super-resolution fluorescence and electron cryo-microscopy.
Wolff G, Hagen C, Grünewald K, Kaufmann R. Wolff G, et al. Biol Cell. 2016 Sep;108(9):245-58. doi: 10.1111/boc.201600008. Epub 2016 Jun 22. Biol Cell. 2016. PMID: 27225383 Free PMC article. Review. - Light 'Em up: Efficient Screening of Gold Foil Grids in Cryo-EM.
Hagen WJH. Hagen WJH. Front Mol Biosci. 2022 May 27;9:912363. doi: 10.3389/fmolb.2022.912363. eCollection 2022. Front Mol Biosci. 2022. PMID: 35693551 Free PMC article. - Structure Determination by Single-Particle Cryo-Electron Microscopy: Only the Sky (and Intrinsic Disorder) is the Limit.
Nwanochie E, Uversky VN. Nwanochie E, et al. Int J Mol Sci. 2019 Aug 27;20(17):4186. doi: 10.3390/ijms20174186. Int J Mol Sci. 2019. PMID: 31461845 Free PMC article. Review. - Cryo-EM reconstruction of the chlororibosome to 3.2 Å resolution within 24 h.
Forsberg BO, Aibara S, Kimanius D, Paul B, Lindahl E, Amunts A. Forsberg BO, et al. IUCrJ. 2017 Sep 22;4(Pt 6):723-727. doi: 10.1107/S205225251701226X. eCollection 2017 Nov 1. IUCrJ. 2017. PMID: 29123673 Free PMC article.
References
- Kühlbrandt W. (2014) The resolution revolution. Science 343: 1443–1444. - PubMed
- Fischer N, Neumann P, Konevega A L, Bock L V, Ficner R, Rodnina M V, Stark H (2015) Structure of the E. coli ribosome-EF-Tu complex at <3 Å resolution by Cs-corrected cryo-EM. Nature 520: 567–570. - PubMed
Publication types
MeSH terms
LinkOut - more resources
Full Text Sources
Other Literature Sources


