Integration of electrophysiological recordings with single-cell RNA-seq data identifies neuronal subtypes - PubMed (original) (raw)
. 2016 Feb;34(2):175-183.
doi: 10.1038/nbt.3443. Epub 2015 Dec 21.
Affiliations
- PMID: 26689544
- PMCID: PMC4745137
- DOI: 10.1038/nbt.3443
Integration of electrophysiological recordings with single-cell RNA-seq data identifies neuronal subtypes
János Fuzik et al. Nat Biotechnol. 2016 Feb.
Abstract
Traditionally, neuroscientists have defined the identity of neurons by the cells' location, morphology, connectivity and excitability. However, the direct relationship between these parameters and the molecular phenotypes has remained largely unexplored. Here, we present a method for obtaining full transcriptome data from single neocortical pyramidal cells and interneurons after whole-cell patch-clamp recordings in mouse brain slices. In our approach, termed Patch-seq, a patch-clamp stimulus protocol is followed by the aspiration of the entire somatic compartment into the recording pipette, reverse transcription of RNA including addition of unique molecular identifiers, cDNA amplification, Illumina library preparation and sequencing. We show that Patch-seq reveals a close link between electrophysiological characteristics, responses to acute chemical challenges and RNA expression of neurotransmitter receptors and channels. Moreover, it distinguishes neuronal subpopulations that correspond to both well-established and, to our knowledge, hitherto undescribed neuronal subtypes. Our findings demonstrate the ability of Patch-seq to precisely map neuronal subtypes and predict their network contributions in the brain.
Figures
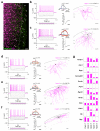
Figure 1. Neurophysiological diversity, distribution and representative molecular marks of CCK interneurons
(a) Confocal photomicrograph of DsRed/GFP dual-labeled neurons (arrows) in layer (L)1 of the somatosensory cortex of a CCKBAC/dsRedT3:GAD67gfp/+ mouse (Supplementary Fig. 1a). Scale bar = 50 μm. (b-f) Representative current-clamp recordings of dual-tagged CCKDsRed/GAD67gfp interneurons (“I-type” 1-5). At the left of each panel, AP responses (top) to square current pulses (bottom) are shown. Phase-plane plots of the APs rising from 2x rheobase current injection (top right) and rheobasic APs (bottom right) are depicted for every neuronal subtype. In phase-plane plots, the first AP is red and subsequent APs shift from warm to cool blue color. For the rheobasic AP, the _y_-axis between −20 mV to +30 mV was omitted to emphasize AHP and ADP characteristics. Vertical scale bar = 200 pA, horizontal scale bar = 25 ms. To the right of each panel, morphological reconstruction of a representative biocytin-filled interneuron for each subclass is shown. Scale bar = 100 μm. Axons are in red, while dendrites are shown in grey. (g) Cell-type-specific expression of a voltage gated K+-channel interacting protein (Kcnip1), a GTPase-activating protein (Chn1), a protein kinase C substrate (Nrgn), a Ca2+ channel subunit (Cacna2d3), a Na+ channel subunit (Scn3a), Purkinje cell protein 4 (Pcp4), a G protein-signaling regulator (Rgs12), serotonin receptor subtype 3a (Htr3a), reelin (Reln), a superficial layer-specific marker, calbindin D28k (Calb1), a Ca2+-binding protein, vasoactive intestinal polypeptide (Vip) and neuropeptide Y (Npy) in sub-classified “_I-type_” CCK+ interneurons.
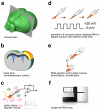
Figure 2. Work-flow diagram of Patch-seq procedures
(a) Coronal cutting plane of a mouse brain to access the somatosensory cortex. (b) Ex vivo brain slice anatomy with the somatosensory cortex highlighted in yellow/orange. (c) Whole-cell patch clamp recording of DsRed+/GFP+ dual-tagged interneurons. (d) Aspiration of neuronal somata was followed by square voltage pulses from −5 mV (holding potential) to +20 mV, whilst maintaining negative pressure. (e) The sample was then expelled into lysis buffer, which allows for in-tube reverse transcription by PCR. (f) Single-cell RNA sequencing was performed on an Illumina Hiseq2000 instrument.
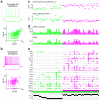
Figure 3. Overview of Patch-seq methodology
(a) Analysis of patch-clamp recordings from pyramidal cells and interneurons using large sets of parameters for neuronal classification. Scatter plots between pairs of excitatory and inhibitory neurons reveal high reproducibility. (b) Resting membrane potential (Vrest, top) and AP duration (bottom) are shown as examples that, among many others, distinguish (excitatory) pyramidal cells and (inhibitory) interneurons. (c) Bar plots showing the total number of mRNA molecules (top) and the corresponding number of detected genes (bottom) for each cell in the dataset. (d) Bar plots showing mRNA molecule counts per cell for select genes at specified anatomical positions. (e) Differential gene expression and layer (L) positioning by pyramidal cells (green) and interneurons (magenta). Thy1, Stmn2 are pan-neuronal markers, Gad1 is a paninterneuron marker and Calb1, Pcp4 are markers for pyramidal cells in superficial and deep cortical layers, respectively.
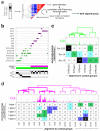
Figure 4. Molecular classification and validation of _Patch-seq_-sampled neurons using a large cortical dataset
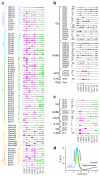
(a) Schema of the correlation-based classification process used to align identified neurons in Fig. 1b to previously described pyramidal cell (Supplementary Fig. 1b) and interneuron subtypes. (b) Classification results for each cell in our dataset after fitting the best alignment. (c,d) Compliance of the electrophysiology-based classification with molecular clustering of pyramidal cells (c) and interneurons (d). Dendrograms depict cluster distances between neuronal subtypes (top). Bar plots denote Cck mRNA copy numbers in respective cell types (below).
Figure 5. Cell-type specific quantitative expression of ion channel and receptor genes in CCK+ interneurons and pyramidal cells
(a) Differential expression of Na+/K+-ATPase, voltage-gated Cl−, Na+, K+, Ca2+ and Ca2+-activated K+ (KCa) ion channel subunits. (b) Ligand-gated ionotropic channel subunits of glutamatergic (Glu), GABAergic (GABA), nicotinic acetylcholinergic (nACh), serotonergic (5-HT) and glycinergic (Gly) receptors. (c) Subunits of Glu, GABA, muscarinic acetylcholine (mACh), dopamine (DA) and 2-arachidonoylglycerol (2-AG)-activated metabotropic receptors. Numbers correspond to mRNA molecule counts. Error bars reveal s.d. Interneuron and pyramidal cell subtypes were color coded in red and green, respectively. (d) Schema of an AP indicating its specific phases: rest (Vrest)/subthreshold (magenta), depolarization (cyan), repolarization (green/yellow) and hyperpolarization (green/orange). Color-codes accord with those of the voltage-gated ion channels determining fast changes in membrane voltage.
Figure 6. Compliance of RNA-seq predictions with the neurophysiological phenotype of cortical interneurons
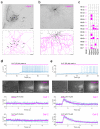
(a) Orthogonal image stack of 3,3′-diamonobenzidine (DAB)-stained I-type 1 interneuron (top) and reconstruction of its processes, including dye-coupled neighbors (bottom). (b) I-type 4 interneuron processed as above (top) and its reconstruction (bottom). Scale bars = 100 μm. (c) Subclass-specific quantitative assessment of mRNA expression for ionotropic and metabotropic 5-HT receptor subunits in interneurons. (d,e) Top: Representative AP firing by I-type 1 (d) and I-type 4 (e) interneurons upon bath-applied 5-HT (25 μM). Middle: Differential interference and epifluorescence microscopy images (60x) of the recorded cells, suggesting identical 5-HT (10 μM) load upon focal microejection (“puff”). Bottom: Membrane potential responses to focal 5-HT application. Two examples (Cell 1,2) per group are shown.
Comment in
- Taking a stab at neuronal heterogeneity.
Vogt N. Vogt N. Nat Methods. 2016 Feb;13(2):114. doi: 10.1038/nmeth.3758. Nat Methods. 2016. PMID: 27243096 No abstract available.
Similar articles
- Multimodal profiling of single-cell morphology, electrophysiology, and gene expression using Patch-seq.
Cadwell CR, Scala F, Li S, Livrizzi G, Shen S, Sandberg R, Jiang X, Tolias AS. Cadwell CR, et al. Nat Protoc. 2017 Dec;12(12):2531-2553. doi: 10.1038/nprot.2017.120. Epub 2017 Nov 16. Nat Protoc. 2017. PMID: 29189773 Free PMC article. - Electrophysiological, transcriptomic and morphologic profiling of single neurons using Patch-seq.
Cadwell CR, Palasantza A, Jiang X, Berens P, Deng Q, Yilmaz M, Reimer J, Shen S, Bethge M, Tolias KF, Sandberg R, Tolias AS. Cadwell CR, et al. Nat Biotechnol. 2016 Feb;34(2):199-203. doi: 10.1038/nbt.3445. Epub 2015 Dec 21. Nat Biotechnol. 2016. PMID: 26689543 Free PMC article. - Protocol for Patch-Seq of Small Interneurons.
Lipovsek M, Browne L, Grubb MS. Lipovsek M, et al. STAR Protoc. 2020 Oct 22;1(3):100146. doi: 10.1016/j.xpro.2020.100146. eCollection 2020 Dec 18. STAR Protoc. 2020. PMID: 33377040 Free PMC article. - Patch-seq: Past, Present, and Future.
Lipovsek M, Bardy C, Cadwell CR, Hadley K, Kobak D, Tripathy SJ. Lipovsek M, et al. J Neurosci. 2021 Feb 3;41(5):937-946. doi: 10.1523/JNEUROSCI.1653-20.2020. Epub 2021 Jan 11. J Neurosci. 2021. PMID: 33431632 Free PMC article. Review. - Patch-seq: Advances and Biological Applications.
Shao M, Zhang W, Li Y, Tang L, Hao ZZ, Liu S. Shao M, et al. Cell Mol Neurobiol. 2023 Dec 20;44(1):8. doi: 10.1007/s10571-023-01436-3. Cell Mol Neurobiol. 2023. PMID: 38123823 Free PMC article. Review.
Cited by
- Identification of visual cortex cell types and species differences using single-cell RNA sequencing.
Wei JR, Hao ZZ, Xu C, Huang M, Tang L, Xu N, Liu R, Shen Y, Teichmann SA, Miao Z, Liu S. Wei JR, et al. Nat Commun. 2022 Nov 12;13(1):6902. doi: 10.1038/s41467-022-34590-1. Nat Commun. 2022. PMID: 36371428 Free PMC article. - Thermoregulation via Temperature-Dependent PGD2 Production in Mouse Preoptic Area.
Wang TA, Teo CF, Åkerblom M, Chen C, Tynan-La Fontaine M, Greiner VJ, Diaz A, McManus MT, Jan YN, Jan LY. Wang TA, et al. Neuron. 2019 Jul 17;103(2):309-322.e7. doi: 10.1016/j.neuron.2019.04.035. Epub 2019 May 28. Neuron. 2019. PMID: 31151773 Free PMC article. - Diversity and Connectivity of Layer 5 Somatostatin-Expressing Interneurons in the Mouse Barrel Cortex.
Nigro MJ, Hashikawa-Yamasaki Y, Rudy B. Nigro MJ, et al. J Neurosci. 2018 Feb 14;38(7):1622-1633. doi: 10.1523/JNEUROSCI.2415-17.2017. Epub 2018 Jan 11. J Neurosci. 2018. PMID: 29326172 Free PMC article. - Integrative analysis of in vivo recording with single-cell RNA-seq data reveals molecular properties of light-sensitive neurons in mouse V1.
Liu J, Wang M, Sun L, Pan NC, Zhang C, Zhang J, Zuo Z, He S, Wu Q, Wang X. Liu J, et al. Protein Cell. 2020 Jun;11(6):417-432. doi: 10.1007/s13238-020-00720-y. Epub 2020 Apr 29. Protein Cell. 2020. PMID: 32350740 Free PMC article. - Single-cell RNA-sequencing of the brain.
Cuevas-Diaz Duran R, Wei H, Wu JQ. Cuevas-Diaz Duran R, et al. Clin Transl Med. 2017 Dec;6(1):20. doi: 10.1186/s40169-017-0150-9. Epub 2017 Jun 8. Clin Transl Med. 2017. PMID: 28597408 Free PMC article. Review.
References
- Fishell G, Hanashima C. Pyramidal neurons grow up and change their mind. Neuron. 2008;57:333–338. - PubMed
- Freund TF, Buzsaki G. Interneurons of the hippocampus. Hippocampus. 1996;6:347–470. - PubMed
Publication types
MeSH terms
Substances
LinkOut - more resources
Full Text Sources
Other Literature Sources
Molecular Biology Databases
