Single-cell transcriptomes reveal characteristic features of human pancreatic islet cell types - PubMed (original) (raw)
Single-cell transcriptomes reveal characteristic features of human pancreatic islet cell types
Jin Li et al. EMBO Rep. 2016 Feb.
Abstract
Pancreatic islets of Langerhans contain several specialized endocrine cell types, which are commonly identified by the expression of single marker genes. However, the established marker genes cannot capture the complete spectrum of cellular heterogeneity in human pancreatic islets, and existing bulk transcriptome datasets provide averages across several cell populations. To dissect the cellular composition of the human pancreatic islet and to establish transcriptomes for all major cell types, we performed single-cell RNA sequencing on 70 cells sorted from human primary tissue. We used this dataset to validate previously described marker genes at the single-cell level and to identify specifically expressed transcription factors for all islet cell subtypes. All data are available for browsing and download, thus establishing a useful resource of single-cell expression profiles for endocrine cells in human pancreatic islets.
Keywords: alpha cells; beta cells; diabetes; marker genes; single‐cell RNA‐seq.
© 2015 The Authors. Published under the terms of the CC BY NC ND 4.0 license.
Figures
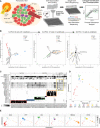
Figure 1. Single‐cell transcriptomes recapitulate the major pancreatic cell types
- Workflow for obtaining and analyzing single‐cell RNA‐seq data from human pancreatic islets.
- Iterative PCA/biplot‐based approach for the identification of cell types and cell type‐defining transcripts from single‐cell RNA‐seq data.
- Expression (scaled RPKM values) of cell type‐defining genes as identified in (B) across all single cells. Transcripts and single cells are grouped by cell type as identified in (B).
- Display of transcriptional similarity between all single cells by MDS. The coloring scheme is based on the cell types as identified in (B).
- Relative expression (scaled RPKM value) of canonical marker genes for the 6 identified pancreatic islet cell populations represented by bubble size and projected onto the MDS profile.
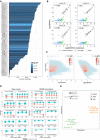
Figure EV1. Statistical analysis of single‐cell RNA‐seq data
- Number of detected transcripts and total aligned reads for each single cell. The red line denotes 500 transcripts, below which samples were excluded from the analysis.
- Scatter plots displaying the correlation between the number of input ERCC RNA molecules and measured RPKM values in four representative single cells. The Pearson correlation (r) is noted in the upper left corner.
- Scatter plots correlating raw read counts (left) and RPKM normalized expression values (right) with transcript length. All adequately covered transcripts (> 25 reads) of all 64 samples were included in this analysis. The observed negative correlation after RPKM normalization lies in the range of what had been reported previously 19.
- Raw counts and RPKM normalized expression values for 10 groups of ERCC spike‐in controls. The amount of molecules spiked into the sequencing reaction is constant within one group, whereas the length of the transcripts varies considerably. Within each group, equal expression values across different transcript lengths thereby confirm that RPKM normalization does not systematically penalize longer transcripts in the assessed ERCC transcript length range of ˜200 to 2,000 bp. ERCC spike‐in controls covered by more than 25 reads are indicated in blue and those with ≤ 25 reads in red.
- MDS displaying transcriptional similarity between corresponding cell types of a published dataset 20 (prefix: ext) and the current dataset.
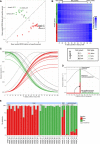
Figure EV2. Assessing cross‐contamination between alpha and beta cells
- Scatter plot displaying single alpha and beta cells, 500‐cell islet samples, as well as bulk islet and beta cell samples from published datasets according to their weighted mean of scaled expression values in alpha and beta cell‐specific profile genes. The three selected profile cells for each cell type are indicated by their sample ID.
- Pure and mixed expression profiles consisting of 233 alpha cell‐specific genes and 252 beta cell‐specific genes. Alpha and beta cell‐specific profiles are calculated based on the expression values of the three selected profile cells only, while profile genes were selected based on all single cells classified as alpha or beta cells, which is why the expression gradients in the mix profiles do not always follow the same direction.
- Profile correlation curves for each individual sample. The maximum of each curve defines the maximum variance that can be explained (_y_‐axis) by the corresponding mix profile (_x_‐axis) providing a measure for the composition of the respective sample.
- Diagram explaining the transition from profile correlation curves to sample composition estimates. The profile composition that explains most variance is linearly scaled to the maximum variance explained.
- Sample composition estimates for each assessed sample. The differences between the 500‐cell islet samples and bulk samples might be explained by technical effects that enrich for alpha cells during islet cultivation, disassociation, and FACS purification.
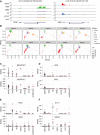
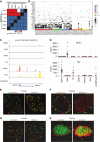
Figure 2. Expression of cell type‐specific transcription factors at single‐cell resolution
- A
Merged UCSC Genome Browser tracks for the PDX1 and ARX loci. The respective tracks for all single cells are presented in Appendix Fig S2. - B
Relative expression (scaled RPKM value) of important transcription factors represented by bubble size and projected onto the MDS profile. - C–F
Cell type‐specific expression of pan‐endocrine (C), alpha cell (D), beta cell (E), and PP cell (F) transcription factors (red bar: mean expression). The statistical significance of the differential gene expression is presented in Appendix Fig S6.
Figure EV3. Assessing pairwise correlation of endocrine marker genes
Correlation matrix displaying all genes (_y_‐axis) that are highly correlated (r > 0.9) with at least one of the endocrine marker genes (_x_‐axis). Different transcripts of the same gene are indicated by “Tx”.
Figure 3. Single‐cell transcriptomes reveal unique features of human islets
- A
Heatmap displaying the _P_‐values obtained by pairwise Gene Set Enrichment Analysis (GSEA) for the REST‐binding motif. - B
Relative expression (scaled RPKM value) of genes contained in the REST‐binding motif gene set. - C
Merged UCSC Genome Browser tracks for REST. The respective tracks for all single cells are presented in Appendix Fig S3. - D
Expression of DLK1 and GC in human islet cell types (red bar: mean expression). The statistical significance of the differential gene expression is presented in Appendix Fig S6. - E–H
Co‐staining of DLK1 (E, F) or GC (G, H) with insulin and with glucagon in representative human (E, G) and mouse (F, H) islets.
Figure EV4. Specific expression of selected marker genes
Relative expression (scaled
RPKM
value) of interesting genes across all single cells represented by bubble size and projected onto the
MDS
profile as displayed in Fig 1D.
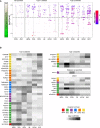
Figure EV5. Assessing cell type specificity of genes identified in diabetes‐related GWAS
- Cell type specificity for genes reported in diabetes‐related GWAS. Each gene reported in a diabetes‐related GWAS (search for “Diabetes” on GWAS Catalog) was assigned to the pancreatic cell type in which it was found to be most specifically expressed. Ranking was performed as described in Appendix Fig S7B and Dataset EV6.
- Heatmap showing mean expression values for the most cell type‐specific diabetes‐associated GWAS genes in the different here identified human islet cell types. Specifically, only genes with a specificity rank lower than 500 (dashed line in panel A) are listed, and genes with equal expression in multiple cell types are not shown. The numbers in the colored boxes indicate the number of studies in which the respective gene has been reported. Heatmaps are colored by mean ln(RPKM), the mean of the natural logarithm of the RPKM values across all cells of the respective cell type.
Similar articles
- Recovery of viable endocrine-specific cells and transcriptomes from human pancreatic islet-engrafted mice.
Redick SD, Leehy L, Rittenhouse AR, Blodgett DM, Derr AG, Kucukural A, Garber MG, Shultz LD, Greiner DL, Wang JP, Harlan DM, Bortell R, Jurczyk A. Redick SD, et al. FASEB J. 2020 Jan;34(1):1901-1911. doi: 10.1096/fj.201901022RR. Epub 2019 Dec 10. FASEB J. 2020. PMID: 31914605 Free PMC article. - Calcium-dependent transcriptional changes in human pancreatic islet cells reveal functional diversity in islet cell subtypes.
Yoon JS, Sasaki S, Velghe J, Lee MYY, Winata H, Nian C, Lynn FC. Yoon JS, et al. Diabetologia. 2022 Sep;65(9):1519-1533. doi: 10.1007/s00125-022-05718-1. Epub 2022 May 26. Diabetologia. 2022. PMID: 35616696 Free PMC article. Retracted. - Interrogating islets in health and disease with single-cell technologies.
Carrano AC, Mulas F, Zeng C, Sander M. Carrano AC, et al. Mol Metab. 2017 May 5;6(9):991-1001. doi: 10.1016/j.molmet.2017.04.012. eCollection 2017 Sep. Mol Metab. 2017. PMID: 28951823 Free PMC article. Review. - Transcriptome analysis of pancreatic cells across distant species highlights novel important regulator genes.
Tarifeño-Saldivia E, Lavergne A, Bernard A, Padamata K, Bergemann D, Voz ML, Manfroid I, Peers B. Tarifeño-Saldivia E, et al. BMC Biol. 2017 Mar 21;15(1):21. doi: 10.1186/s12915-017-0362-x. BMC Biol. 2017. PMID: 28327131 Free PMC article. - Single-Cell RNA-Seq of the Pancreatic Islets--a Promise Not yet Fulfilled?
Wang YJ, Kaestner KH. Wang YJ, et al. Cell Metab. 2019 Mar 5;29(3):539-544. doi: 10.1016/j.cmet.2018.11.016. Epub 2018 Dec 20. Cell Metab. 2019. PMID: 30581120 Free PMC article. Review.
Cited by
- Single-Cell Transcriptomics of the Human Endocrine Pancreas.
Wang YJ, Schug J, Won KJ, Liu C, Naji A, Avrahami D, Golson ML, Kaestner KH. Wang YJ, et al. Diabetes. 2016 Oct;65(10):3028-38. doi: 10.2337/db16-0405. Epub 2016 Jun 30. Diabetes. 2016. PMID: 27364731 Free PMC article. - Characterizing the replicability of cell types defined by single cell RNA-sequencing data using MetaNeighbor.
Crow M, Paul A, Ballouz S, Huang ZJ, Gillis J. Crow M, et al. Nat Commun. 2018 Feb 28;9(1):884. doi: 10.1038/s41467-018-03282-0. Nat Commun. 2018. PMID: 29491377 Free PMC article. - Comparative transcriptomics in human and mouse.
Breschi A, Gingeras TR, Guigó R. Breschi A, et al. Nat Rev Genet. 2017 Jul;18(7):425-440. doi: 10.1038/nrg.2017.19. Epub 2017 May 8. Nat Rev Genet. 2017. PMID: 28479595 Free PMC article. Review. - scRNASeqDB: A Database for RNA-Seq Based Gene Expression Profiles in Human Single Cells.
Cao Y, Zhu J, Jia P, Zhao Z. Cao Y, et al. Genes (Basel). 2017 Dec 5;8(12):368. doi: 10.3390/genes8120368. Genes (Basel). 2017. PMID: 29206167 Free PMC article. - Transcriptional alterations in hereditary and sporadic nonfunctioning pancreatic neuroendocrine tumors according to genotype.
Keutgen XM, Kumar S, Gara SK, Boufraqech M, Agarwal S, Hruban RH, Nilubol N, Quezado M, Finney R, Cam M, Kebebew E. Keutgen XM, et al. Cancer. 2018 Feb 1;124(3):636-647. doi: 10.1002/cncr.31057. Epub 2017 Nov 17. Cancer. 2018. PMID: 29149451 Free PMC article.
References
Publication types
MeSH terms
Substances
LinkOut - more resources
Full Text Sources
Other Literature Sources
Molecular Biology Databases
