Bruton Tyrosine Kinase-Dependent Immune Cell Cross-talk Drives Pancreas Cancer - PubMed (original) (raw)
doi: 10.1158/2159-8290.CD-15-0827. Epub 2015 Dec 29.
Megan M Kaneda 2, Takahiro Tsujikawa 3, Abraham V Nguyen 2, Nesrine I Affara 4, Brian Ruffell 1, Sara Gorjestani 2, Shannon M Liudahl 1, Morgan Truitt 5, Peter Olson 5, Grace Kim 6, Douglas Hanahan 7, Margaret A Tempero 8, Brett Sheppard 9, Bryan Irving 10, Betty Y Chang 11, Judith A Varner 12, Lisa M Coussens 13
Affiliations
- PMID: 26715645
- PMCID: PMC4783268
- DOI: 10.1158/2159-8290.CD-15-0827
Bruton Tyrosine Kinase-Dependent Immune Cell Cross-talk Drives Pancreas Cancer
Andrew J Gunderson et al. Cancer Discov. 2016 Mar.
Erratum in
- Correction: Bruton Tyrosine Kinase-Dependent Immune Cell Cross-talk Drives Pancreas Cancer.
[No authors listed] [No authors listed] Cancer Discov. 2016 Jul;6(7):802. doi: 10.1158/2159-8290.CD-16-0626. Epub 2016 Jun 13. Cancer Discov. 2016. PMID: 27297551 No abstract available.
Abstract
Pancreas ductal adenocarcinoma (PDAC) has one of the worst 5-year survival rates of all solid tumors, and thus new treatment strategies are urgently needed. Here, we report that targeting Bruton tyrosine kinase (BTK), a key B-cell and macrophage kinase, restores T cell-dependent antitumor immune responses, thereby inhibiting PDAC growth and improving responsiveness to standard-of-care chemotherapy. We report that PDAC tumor growth depends on cross-talk between B cells and FcRγ(+) tumor-associated macrophages, resulting in T(H)2-type macrophage programming via BTK activation in a PI3Kγ-dependent manner. Treatment of PDAC-bearing mice with the BTK inhibitor PCI32765 (ibrutinib) or by PI3Kγ inhibition reprogrammed macrophages toward a T(H)1 phenotype that fostered CD8(+) T-cell cytotoxicity, and suppressed PDAC growth, indicating that BTK signaling mediates PDAC immunosuppression. These data indicate that pharmacologic inhibition of BTK in PDAC can reactivate adaptive immune responses, presenting a new therapeutic modality for this devastating tumor type.
Significance: We report that BTK regulates B-cell and macrophage-mediated T-cell suppression in pancreas adenocarcinomas. Inhibition of BTK with the FDA-approved inhibitor ibrutinib restores T cell-dependent antitumor immune responses to inhibit PDAC growth and improves responsiveness to chemotherapy, presenting a new therapeutic modality for pancreas cancer.
©2015 American Association for Cancer Research.
Conflict of interest statement
Conflicts: Betty Y. Chang is an employee of Pharmacyclics, Inc. LMC and JAV received PCI-32765 free of charge from Pharmacyclics, Inc. who had no role in experimental design, data preparation or interpretation. LMC is on the PCYC-1137-CA Steering Committee.
Figures
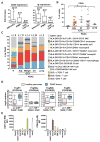
Figure 1. Leukocytes in human PDAC
A. Relative CD20 and Ig mRNA expression in human pancreatic ductal adenocarcinoma (AdenoCa; n=33), intrapapillary mucinous neoplasias (IPMN; n=5), and islet cell carcinomas (Islet Cell Ca; n=6), as compared to healthy pancreas tissue (n=17) assessed by Affymatrix Human U133 Plus 2 microarrays. Data are represented as box-and-whisker plots depicting median fold change value compared to normal tissue, displaying the first and third quartiles at the end of each box, with the maximum and minimum at the ends of the whiskers. Statistical significance determined via Wilcoxon rank-sum test with *p< 0.05, ***p< 0.001. B. FACS-quantitation of CD45+ cells as a percentage of viable cells from pancreas tissues reflecting healthy (H) pancreata (n=6), pancreas tissue adjacent to PDAC (Adj; n=13), PDAC tumor margins (M; n=4) and tumor centers (Ctr; n=23) from patients who had not received prior chemotherapy (−CTX), and PDACs (n=3) from patients treated with standard-of-care CTX (+CTX). Each data point reflects an individual piece of tissue. C. Leukocyte complexity of healthy human pancreas (n=6), and pancreas tissue isolated from patients with PDAC evaluated by polychromatic flow cytometry of single cell suspensions and evaluated for expression of the lineage markers shown. Data represent mean leukocyte complexity for leukocyte lineages shown (right) in tumor tissue resected from healthy pancreata (H; n=6), pacreata tissue adjacent to PDAC (Adj; n=13), tissue resected from PDAC margins (n=4) or tumor centers (Ctr; n=23), and PDACs (n=3) from patients treated with standard-of-care CTX (+CTX). Data reflecting individual populations is provided in Fig. S1D. D. mRNA expression of FcγR isoforms from humans with healthy pancreas vs. patients with PDAC tumors. Data was compiled from gene expression available in Oncomine (
). P values and fold change in gene expression are shown. E. FACS histogram showing relative frequency of CD64 (FcγR1) and CD16 (FcγRIII) expression on leukocytes infiltrating human PDAC. Data shown are reflective of 20 human PDAC. Lineage markers for cell types shown are as indicated in panel C and reflect basophils (baso), mast cells, macrophages (macs) dendritic cells (DCs), inflammatory monocytes (iMCs), eosinophils (eos), monocytes (monos) and neutrophils (neut). Adjacent (Adj.) normal indicates tissue isolated from pancreas tissue proximal to resected PDAC tumors.
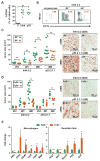
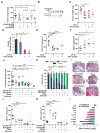
Figure 2. Orthotopic PDAC growth is regulated by B cells and FcRγ-positive myeloid cells
A. Murine PDAC cell lines, derived from Pdx-Cre LSL-KrasG12D mice harboring an Ink4a/Arfflox/+ allele (Ink4 2.2) or a p53flox/+ allele (p53 2.1.1), were injected orthotopically into the pancreas, and subsequent tumors evaluated by FACS for CD45-positive cellular infiltrates. Graph shows percentage of CD45+ cells as a percentage of viable cells. B. Representative CD19+MHCII+ FACS plot gated on viable CD45+ cells from tumor naïve pancreas and Ink4 2.2-implanted PDAC tumors in syngeneic JH+/− and JH−/− mice evaluated 28 days after implantation. C. Ink4 2.2 and p53 2.1.1-derived PDACs were quantitatively evaluated in syngeneic JH+/− and JH−/− mice for tumor area in serial H&E-stained tissue sections reflecting tumors isolated on day 14, 21, and 28 post-implantation. On right, representative photomicrographs reflecting immuno-detection of αSMA in end-stage Ink4 2.2 and p53 2.1.1-derived orthotopic PDAC tumors. D. Ink4 2.2 and p53 2.1.1-derived PDACs were quantitatively evaluated in syngeneic FcRγ+/− and FcRγ−/− mice for tumor area in serial H&E-stained tissue sections reflecting tumors isolated on day 14, 21, and 28 post-implantation. On right, representative photomicrographs reflecting immuno-detection of αSMA in end-stage Ink4 2.2 and p53 2.1.1-derived orthotopic PDAC tumors. E. qRT-PCR analysis from cDNA reflecting FACS-purified macrophages (MØ = CD45+CD11b+MHCII+F4/80+Ly6C−) or dendritic cells (DC = CD45+CD11b+MHCII+F4/80−CD11c+) from Ink4 2.2 PDAC-derived tumors harvested from d21 FcRγ+/− (n=10) or FcRγ−/− (n=8) mice. Displayed are fold changes in genes that reached statistically significant differences. Data compiled from two independent experiments. For graphs in panels A, C–E, statistical means are shown, with p values determined by either student’s T test or one-way Anova when analyzing more than two groups, with *p < 0.05, **p < 0. 0.01, ***p < 0.001. For graphs in C and D, each data point reflects mean tumor size from one mouse based on quantitative morphometry of 5 FFPE sections, resulting from 3 independent experiments.
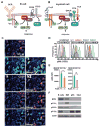
Figure 3. BTK and PI3K in PDAC-infiltrating B cells and myeloid cells
A–B. Cartoons depicting BCR- and FcRγ-activated BTK signaling in B cells and myeloid cells. C. Representative photomicrograph showing immunodetection of BTK, CD45, CD20, CD11b and CSF1R in a human PDAC FFPE section. Arrows in ‘merged’ images indicate double-positive cells. Magnification is shown. 6 different human PDAC tumors were evaluated, and data shown is reflective of all. D. Intracellular FACS detection of activated phosphoBTK (pBTK) (Y223) in single cells harvested from peripheral blood, spleen, and tumor tissue of Ink4 2.2-implanted syngeneic mice, gated on CD19+MHCII+ B cells, CD11b+MHCII− and CD11b+MHCII+ myeloid cells. Also shown are unstained and IgG1 isotype control stained cells. Representative data from one experiment (n=7 mice) reflective of 2 independent experiments is shown. E. Intracellular FACS detection of pBTK (Y223) in MHCII+CD11b+ and MHCII−CD11b+ cells isolated from end-stage Ink4 2.2 PDAC tumors from syngeneic FcRγ+/− or FcRγ−/− mice. Data from one representative experiment (n=8 mice per experimental group) is shown and is reflective of 2 independent experiments. F. Cropped western blot images showing expression of BTK, PI3Kγ (p110γ), PI3Kδ (p110δ), PI3Kα (p110α) and actin, in murine PDAC-derived B cells, primary murine macrophages (MØ), and cultured PDAC clones p53 2.1.1 (p53) and Ink4a 2.2 (Ink4).
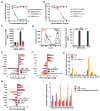
Figure 4. FcRγ-signaling regulates BTK activation and mediates PDAC growth
A–B. Effect of the BTK inhibitor PCI-32765 (A), and the p110γ inhibitor TG100-115 (B) versus vehicle control (DMSO) on IL-1β– and SDF-1-stimulated adhesion of primary myeloid cells to VCAM-1 (n=3). C. Effect of siRNA-mediated BTK knockdown on SDF-1α-stimulated myeloid cell adhesion to VCAM-1 (n=3). D. Effect of PCI-32765 (PCI) on SDF-1α-induced integrin α4β1 activation, as detected by binding of fluorescent VCAM-1 to myeloid cells (n=3); left, FACS profiles and right, quantification of mean fluorescence intensity. Positive control: extracellular Mn2+ treatment. E–F. Log2-fold change of gene expression in (E) LPS/IFNγ-in vitro polarized macrophages treated with PCI-32765 or p110γ−/− macrophages, (F) p110γ−/−, PCI-3276-treated, and p110γ−/− PCI-32765-treated IL-4-in vitro polarized primary murine macrophages (n=3). G. Relative mRNA expression of macrophages polarized with IL-4 or IL-4+FcRγ crosslinking (n=3). H. Log2-fold change of gene expression in IL-4-stimulated FcRγ-cross-linked p110γ−/− or PCI-3276-treated primary murine macrophages (n=3). I. Relative mRNA expression of macrophages co-cultured in p53 2.1.1 tumor cell conditioned medium (TCM) with tumor derived B cells (n=3) or PCI-32765 treated B cells. Data shown are mean +/− SEM of biological replicates and were validated in 3 or more separate experiments. Significance testing was performed by one way Anova with Tukey’s posthoc testing for multiple pairwise testing or by Student’s t test, where p>0.05 unless other specified, * P < 0.05, ** P < 0.01, and *** P < 0.001. For mRNA expression studies, p<0.01 unless otherwise indicated.
Figure 5. PI3Kγ and BTK promote PDAC progression
A. Tumor burden in mice implanted with admixed p53 2.1.1 cells together with PCI-32765- or vehicle-pretreated B cells or myeloid cells as compared to untreated or PCI-32765 post-implantation treatment alone. B. Schemas for early treatment schedule for PDAC-bearing mice with administration of PCI-32765 in drinking water (0.016% w/v) and/or the p110γ inhibitor TG100-115 (2.5 mg/kg BID given i.p.) beginning on day 7 post-implantation, and gemcitabine (Gem; 15 mg/kg, i.v.) in p53 2.1.1 derived PDAC-bearing mice. C. End-stage p53 2.2 PDAC tumor weights from syngeneic PI3Kγ-deficient (p110γ−/−) or wildtype mice treated with or without PCI-32765 (n=10–15/mice per experimental group). D. Tumor-derived B cells as a percentage of CD45+ cells in treated tumors from ‘C’, as determined by FAC analysis. E. Number of CD11b+ cells/mm2 in treated tumors from ‘C’. F. Number of CD8+ T cells/mm2 in treated tumors from ‘C’. G. Effect of TG100-115, PCI-32765, gemcitabine (Gem) and combinations of these agents on growth to end-stage of orthotopic p53 2.2 PDAC tumors (n=10–15/mice per experimental group) depicted as total pancreas weight after 3 weeks of treatment as compared to pancreas weight of tumor-naïve mice. H. Percent residual tumor, normal acinar tissue and acellular fibrotic tissue in pancreata of tumors depicted in panel ‘G’. I. Representative photomicrographs showing Masson’s trichrome stained images of PDAC tumors (*) treated as shown reflecting quantitation in panels G and H. J. Number of CD11b+ cells/mm2 in treated tumors depicted in panel ‘C’, compared to normal pancreata. K. CD8+ T cells/mm2 in treated tumors depicted in panel ‘C’. L. Log base 2 fold change in gene expression in tumors between control and TG100-115 or control and PCI-32765 treatments (n=15). mRNAs for which TG100-115-treated tumors showed statistically significant differences from control tumors are shown. Data shown are mean +/− SEM of biological replicates and were validated in 3 or more separate experiments. Significance testing was performed by one way Anova with Tukey’s posthoc testing for multiple pairwise testing or by Student’s t test, where p>0.05 unless other specified, * P < 0.05, ** P < 0.01, and *** P < 0.001. ns indicates not statistically different. For panels A, C, E–G, J–K each data point reflects an individual tumor with statistical means shown. For mRNA expression studies, p<0.01 unless otherwise indicated.
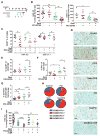
Figure 6. Btk–activated signaling regulates PDAC tumorigenesis
A. Schemas for therapeutic administration of PCI-32765 (in drinking water [0.16% w/v] beginning on day 14 post-implantation and gemcitabine (Gem; 15 mg/kg, i.v., beginning on day 18) to late-stage PDAC tumor-bearing mice. 500 μg depleting αCD8 mAb antibody administered i.p. on day 15, 20, and 25. B. Percent change in Ink4 2.2 (left) or p53 2.1.1 (right) tumor size from day 14 to day 27 post-implantation measured by ultrasonography and assessed following treatment with vehicle (−), PCI-32765, or Gem, and combinations as indicated. For Ink4 2.2, data from 3 independent experiments are shown reflective of 5 independent experiments. For p53 2.1.1, data from one experiment is shown and is representative of 2 independent experiments. C. CD45+ leukocyte frequency from end-stage tumors as a percentage of total viable cells determined by FACS analysis of single cell suspensions of tumors from treatment groups indicated. Data from 2 independent experiments are shown and representative of 5 independent studies. D. Representative photomicrographs showing immune-detection of alpha-smooth muscle actin (αSMA) in mice bearing end-stage Ink4 2.2 PDAC tumors treated as shown. Scale bars = 100 μm. E. Percentage of granzyme B-positive (GnzB) cells of CD3+CD8+ cells as determined by FACS of end-stage Ink4 2.2 PDAC tumors treated as shown. Data from 2 independent experiments are shown and representative of 4 independent studies. F. Percentage of IFN-γ+CD8+ T cells of CD3+CD8+ cells as determined by intracellular FACS assessment of ex vivo stimulated Ink4 2.2 PDAC tumors harvested from mice at day 23 post-implant. Data from 2 independent experiments are shown. G. Fold change of percent of CD107a+CD8+ T cells of CD3+CD8+ cells analyzed by FACS of Ink4 2.2 PDAC tumors harvested from mice at day 23 post-implant. Data from 2 independent experiments are shown. H. FACS analysis of Ink4 2.2 tumors from day 23 time-points for percentages of PD-1+EOMES+ populations of CD3+CD8+ T cells. Data from 2 independent experiments is shown. Statistical significance was determined using the student’s T test or one-way Anova when analyzing more than two groups. I. Percent change in Ink4 2.2 tumor size from day 14 to day 27 post-implantation measured by ultrasonography and assessed following treatment with vehicle (−), PCI-32765, or Gem, and combinations in mice also administered depleting monoclonal antibodies for CD8+ (αCD8) T cells as indicated. Data from 2 independent experiments is shown. * p < 0.05, ** p < 0.01, *** p < 0.001. For panels B–C and E–G and I, each data point reflects an individual tumor with statistical means shown.
Comment in
- B Cells Promote Pancreatic Tumorigenesis.
Roghanian A, Fraser C, Kleyman M, Chen J. Roghanian A, et al. Cancer Discov. 2016 Mar;6(3):230-2. doi: 10.1158/2159-8290.CD-16-0100. Cancer Discov. 2016. PMID: 26951836
Similar articles
- Macrophage PI3Kγ Drives Pancreatic Ductal Adenocarcinoma Progression.
Kaneda MM, Cappello P, Nguyen AV, Ralainirina N, Hardamon CR, Foubert P, Schmid MC, Sun P, Mose E, Bouvet M, Lowy AM, Valasek MA, Sasik R, Novelli F, Hirsch E, Varner JA. Kaneda MM, et al. Cancer Discov. 2016 Aug;6(8):870-85. doi: 10.1158/2159-8290.CD-15-1346. Epub 2016 May 13. Cancer Discov. 2016. PMID: 27179037 Free PMC article. - Single-cell RNA sequencing reveals compartmental remodeling of tumor-infiltrating immune cells induced by anti-CD47 targeting in pancreatic cancer.
Pan Y, Lu F, Fei Q, Yu X, Xiong P, Yu X, Dang Y, Hou Z, Lin W, Lin X, Zhang Z, Pan M, Huang H. Pan Y, et al. J Hematol Oncol. 2019 Nov 27;12(1):124. doi: 10.1186/s13045-019-0822-6. J Hematol Oncol. 2019. PMID: 31771616 Free PMC article. - Analysis of the Effects of the Bruton's tyrosine kinase (Btk) Inhibitor Ibrutinib on Monocyte Fcγ Receptor (FcγR) Function.
Ren L, Campbell A, Fang H, Gautam S, Elavazhagan S, Fatehchand K, Mehta P, Stiff A, Reader BF, Mo X, Byrd JC, Carson WE 3rd, Butchar JP, Tridandapani S. Ren L, et al. J Biol Chem. 2016 Feb 5;291(6):3043-52. doi: 10.1074/jbc.M115.687251. Epub 2015 Dec 1. J Biol Chem. 2016. PMID: 26627823 Free PMC article. - Bruton's tyrosine kinase: an emerging targeted therapy in myeloid cells within the tumor microenvironment.
Good L, Benner B, Carson WE. Good L, et al. Cancer Immunol Immunother. 2021 Sep;70(9):2439-2451. doi: 10.1007/s00262-021-02908-5. Epub 2021 Apr 5. Cancer Immunol Immunother. 2021. PMID: 33818636 Free PMC article. Review. - Bruton's tyrosine kinase (BTK) as a promising target in solid tumors.
Molina-Cerrillo J, Alonso-Gordoa T, Gajate P, Grande E. Molina-Cerrillo J, et al. Cancer Treat Rev. 2017 Jul;58:41-50. doi: 10.1016/j.ctrv.2017.06.001. Epub 2017 Jun 9. Cancer Treat Rev. 2017. PMID: 28641100 Review.
Cited by
- Unveiling the Promise: Navigating Clinical Trials 1978-2024 for PDAC.
Dominguez AA, Perz MT, Xu Y, Cedillo LG, Huang OD, McIntyre CA, Vudatha V, Trevino JG, Liu J, Wang P. Dominguez AA, et al. Cancers (Basel). 2024 Oct 23;16(21):3564. doi: 10.3390/cancers16213564. Cancers (Basel). 2024. PMID: 39518005 Free PMC article. Review. - Inhibition of the PI3K/AKT/mTOR pathway in pancreatic cancer: is it a worthwhile endeavor?
Ouissam AJ, Hind C, Sami Aziz B, Said A. Ouissam AJ, et al. Ther Adv Med Oncol. 2024 Oct 4;16:17588359241284911. doi: 10.1177/17588359241284911. eCollection 2024. Ther Adv Med Oncol. 2024. PMID: 39399412 Free PMC article. Review. - The Role of Tumor Microenvironment in Pancreatic Cancer Immunotherapy: Current Status and Future Perspectives.
Poyia F, Neophytou CM, Christodoulou MI, Papageorgis P. Poyia F, et al. Int J Mol Sci. 2024 Sep 3;25(17):9555. doi: 10.3390/ijms25179555. Int J Mol Sci. 2024. PMID: 39273502 Free PMC article. Review. - Barriers and opportunities in pancreatic cancer immunotherapy.
Ju Y, Xu D, Liao MM, Sun Y, Bao WD, Yao F, Ma L. Ju Y, et al. NPJ Precis Oncol. 2024 Sep 12;8(1):199. doi: 10.1038/s41698-024-00681-z. NPJ Precis Oncol. 2024. PMID: 39266715 Free PMC article. Review. - Uncovering therapeutic targets for macrophage-mediated T cell suppression and PD-L1 therapy sensitization.
Kumar S, Tailor D, Dheeraj A, Li W, Stefan K, Lee JM, Nelson D, Keefe BF, Schedin P, Kummar S, Coussens LM, Malhotra SV. Kumar S, et al. Cell Rep Med. 2024 Sep 17;5(9):101698. doi: 10.1016/j.xcrm.2024.101698. Epub 2024 Aug 23. Cell Rep Med. 2024. PMID: 39181134 Free PMC article.
References
- Hanahan D, Coussens LM. Accessories to the crime: functions of cells recruited to the tumor microenvironment. Cancer Cell. 2012;21:309–22. - PubMed
- SEER.cancer.gov [Internet] Rockville: National Cancer Institute; c2015. Available from: http://seer.cancer.gov/statfacts/html/pancreas.html.
- Siegel R, Naishadham D, Jemal A. Cancer statistics, 2012. CA Cancer J Clin. 2012;62:10–29. - PubMed
Publication types
MeSH terms
Substances
Grants and funding
- T32 CA121938/CA/NCI NIH HHS/United States
- R01 CA126820/CA/NCI NIH HHS/United States
- T32HL098062/HL/NHLBI NIH HHS/United States
- T32 HL098062/HL/NHLBI NIH HHS/United States
- R01 CA155331/CA/NCI NIH HHS/United States
- R01CA140943/CA/NCI NIH HHS/United States
- R01 CA167426/CA/NCI NIH HHS/United States
- R01 CA130980/CA/NCI NIH HHS/United States
- U54 CA163123/CA/NCI NIH HHS/United States
- T32 AI078903/AI/NIAID NIH HHS/United States
- T32CA121938/CA/NCI NIH HHS/United States
- R01 CA083133/CA/NCI NIH HHS/United States
- R01CA167426-03S1/CA/NCI NIH HHS/United States
- R01CA130980/CA/NCI NIH HHS/United States
- R01CA126820/CA/NCI NIH HHS/United States
- R01CA083133/CA/NCI NIH HHS/United States
- R01CA167426/CA/NCI NIH HHS/United States
- T32CA009523/CA/NCI NIH HHS/United States
- R01 CA140943/CA/NCI NIH HHS/United States
- R01 CA098048/CA/NCI NIH HHS/United States
- U54CA163123/CA/NCI NIH HHS/United States
- T32AI078903-04/AI/NIAID NIH HHS/United States
- R01CA15531/CA/NCI NIH HHS/United States
- T32 CA009523/CA/NCI NIH HHS/United States
LinkOut - more resources
Full Text Sources
Other Literature Sources
Medical
Research Materials
