Osteoblast-derived VEGF regulates osteoblast differentiation and bone formation during bone repair - PubMed (original) (raw)
Osteoblast-derived VEGF regulates osteoblast differentiation and bone formation during bone repair
Kai Hu et al. J Clin Invest. 2016 Feb.
Abstract
Osteoblast-derived VEGF is important for bone development and postnatal bone homeostasis. Previous studies have demonstrated that VEGF affects bone repair and regeneration; however, the cellular mechanisms by which it works are not fully understood. In this study, we investigated the functions of osteoblast-derived VEGF in healing of a bone defect. The results indicate that osteoblast-derived VEGF plays critical roles at several stages in the repair process. Using transgenic mice with osteoblast-specific deletion of Vegfa, we demonstrated that VEGF promoted macrophage recruitment and angiogenic responses in the inflammation phase, and optimal levels of VEGF were required for coupling of angiogenesis and osteogenesis in areas where repair occurs by intramembranous ossification. VEGF likely functions as a paracrine factor in this process because deletion of Vegfr2 in osteoblastic lineage cells enhanced osteoblastic maturation and mineralization. Furthermore, osteoblast- and hypertrophic chondrocyte-derived VEGF stimulated recruitment of blood vessels and osteoclasts and promoted cartilage resorption at the repair site during the periosteal endochondral ossification stage. Finally, osteoblast-derived VEGF stimulated osteoclast formation in the final remodeling phase of the repair process. These findings provide a basis for clinical strategies to improve bone regeneration and treat defects in bone healing.
Figures
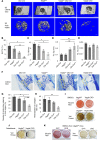
Figure 9. Deletion of Vegfr2 in osteoblastic cells increases their maturation and mineralization during bone repair at PSD7.
(A) 3D reconstruction of injured tibiae (top panel; scale bar: 500 μm) and mineralized bone in hole region (lower panel; scale bar: 100 μm). Representative images of 6–7 mice for each genotype. BVs in hole of Flk1fl/fl (0.0120 ± 0.0024 mm3) and Flk1fl/+ Osx-Cre mice (0.0082 ± 0.0016 mm3) not statistically different, but increased (0.0330 ± 0.0077 mm3) in Flk1fl/fl Osx-Cre mice; P < 0.05 vs. Flk1fl/fl. Tb.N (Tb.N/mm) increased (13.36/mm ± 1.32/mm) and trabecular spacing (Tb.Sp) decreased (0.079 ± 0.011 mm), in Flk1fl/fl Osx-Cre compared with Flk1fl/fl mice (7.08/mm ± 0.77/mm and 0.160 ± 0.023 mm); P < 0.01 (Tb.N), P < 0.05 (Tb.Sp). (B) BV/TV of mineralized bone formed in hole and wounded marrow of control and _Vegfr2-_deficient mice. (C) Reduced aniline blue staining in hole region (yellow rectangles) of Flk1fl/+ Osx-Cre (21.86% ± 1.53%) compared with Flk1fl/fl (36.70% ± 5.47%) mice; P < 0.05, but increased in _Flk1fl/fl Osx-_Cre (37.75% ± 10.99%) compared with Flk1fl/+ Osx-Cre mice; P < 0.05. Right: Increased mineralization/collagen ratio in Flk1fl/fl Osx-Cre mice. (D and E) Increased anti-OCN (2.8% ± 0.6%) and anti-ALP staining (20.0% ± 3.4%) in hole region of Flk1fl/fl Osx-Cre compared with Flk1fl/fl mice (0.6% ± 0.4% and 6.7% ± 1.8%); P<0.05 (OCN) and P < 0.01 (ALP). (F) Similar density of ZsG+ cells in hole region of Osx-Cre/ZsG, Flk1fl/+ Osx-Cre/ZsG, and Flk1fl/fl Osx-Cre/ZsG mice. (G) Von Kossa staining of osteoblasts cultured for 21 days in mineralization medium with or without BMP2. (H) Von Kossa staining of MC3T3-1E cells cultured for 21 days in mineralization medium containing 100 μM VEGFR2 kinase inhibitor or vehicle (Veh). Data are representative of 3 independent experiments (G and H). Scale bars: 200 μm (C), 50 μm (D–F); _n_= 6–7 (B–E); _n_= 4–6 (F). ANOVA with Tukey’s post-hoc test (A–C and F) and unpaired 2-tailed Student’s t test (D and E) were used. *, #P < 0.01; ##P < 0.05. *, vs. Flk1fl/fl. #,##vs. Flk1fl/+ Osx-Cre.
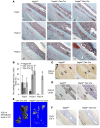
Figure 8. Deletion of Vegfa in osteoblastic cells reduces periosteal callus remodeling at PSD28.
(A) H&E-stained sections from Vegfafl/fl, Vegfafl/+ Osx-Cre, and Vegfa CKO mice showing periosteal callus remodeling at PSD28. Representative images from 5–6 mice for each genotype. (B) Left panels: 2D images of sagittal sections of injured tibiae. Right panels: 3D reconstruction of periosteal callus. Representative images from 5–6 mice. (C) Decreased callus thickness, calculated as distance from edge of periosteal callus to injured cortical bone normalized to total volume of corresponding tibial segment, in Vegfa CKO compared with Vegfafl/fl mice; n = 5–6. (D) Decreased BV/TV, total callus BV normalized to total volume of the corresponding tibial segment, in Vegfa CKO compared with Vegfafl/fl mice; _n_= 5–6. (E) Low density of TRAP+ osteoclasts, normalized to total length of callus bone, in Vegfa CKO compared with Vegfafl/fl mice; n = 4. Scale bars: 500 μm (A and B), 200 μm (E). ANOVA with Tukey’s post-hoc test (C and D) and unpaired 2-tailed Student’s t test (E) were used. *P < 0.01; **P < 0.05.
Figure 7. Deletion of Vegfa in osteoblasts and hypertrophic chondrocytes impairs cartilage resorption in injured PO.
(A) Safranin O staining at different time points shows periosteal cartilage in areas about 2 mm distal to hole region. Representative images from 4–8 mice for each genotype. (B). Periosteal Safranin O–stained cartilage is gradually resorbed at PSD7–10 in Vegfafl/fl mice; resorption is delayed, and cartilage formation even enhanced in PO of Vegfa CKO mice; n = 4–8, *P < 0.01, **P < 0.05. (C and D) TRAP+ osteoclasts and lectin+ vascular endothelial cells greatly decreased in PO of Vegfa CKO mice compared with Vegfafl/fl mice at PSD10. (E) Decreased mineralized BV in PO of Vegfafl/fl Osx-Cre/ZsG mice (0.0071 ± 0.0034 mm3) compared with Osx-Cre/ZsG mice (0.069 ± 0.019 mm3) at PSD10; n = 3–4, P < 0.01. (F) Similar density of collagen X–stained hypertrophic chondrocytes in PO of Vegfa CKO (146/mm2 ± 21/mm2) and Vegfafl/fl mice (144/mm2 ± 31/mm2) at PSD7; n = 7–9. Green stippled area represents injured PO. CB, cortical bone. Representative images of 3–4 mice (C–E). Scale bar: 100 μm (E), 200 μm (A, C, D, and F). ANOVA with Tukey’s post-hoc test (B) and unpaired 2-tailed Student’s t test (E and F) were used.
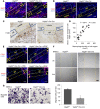
Figure 6. Osteoblast-derived VEGF stimulates macrophage-related angiogenesis and migration of BM cells.
(A) Increased anti-VEGF staining in hole (yellow rectangles) (17.6% ± 4.8%) and BM (blue rectangles) (20.3% ± 4.9%) of Vegfafl/fl compared with Vegfa CKO mice (4.2% ± 1.2% and 6.6% ± 2.0%) at PSD3; _n_= 5–6, P < 0.05. No significant differences outside hole (10.2% ± 2.9% vs. 9.4% ± 2.0%) (B) High anti-CD31 staining in hole (163/mm2 ± 5/mm2), adjacent BM (263/mm2 ± 18/mm2), and outside area (164/mm2 ± 26/mm2) of Vegfafl/fl compared with Vegfa CKO mice (58/mm2 ± 12/mm2, 65/mm2 ± 21/mm2, and 66/mm2 ± 17/mm2) at PSD3; n = 4–7, P < 0.05. (C) High density of F4/80+ macrophages in hole (321/mm2 ± 46/mm2) and BM (366/mm2 ± 69/mm2) of Vegfafl/fl compared with Vegfa CKO mice (82/mm2 ± 19/mm2 and 143/mm2 ± 26/mm2) at PSD3; n = 5–6, P < 0.01 (hole); P < 0.05 (BM); no difference outside (217/mm2 ± 38/mm2 vs. 166/mm2 ± 41/mm2). (D) High correlation between blood vessel and macrophage densities in hole. (E) Treating Vegfa CKO mice with 0.1 μg VEGF increases blood vessel density in hole (151/mm2 ± 7/mm2) and BM (115/mm2 ± 9/mm2) and macrophage density in hole (205/mm2 ± 34/mm2) at PSD5, compared with PBS (91/mm2 ± 12/mm2, 50/mm2 ± 6/mm2, and 87/mm2 ± 9/mm2); P < 0.05. Macrophage density in BM not affected (140/mm2 ± 25/mm2 vs. 94/mm2 ± 13/mm2). (F) In vitro wound closure; stippled lines indicate wound edges at time 0. Higher wound closure rate (μm/h) in BMSCs of Vegfafl/fl (8.1 ± 0.7 μm/h) than Vegfa CKO mice (5.1 ± 0.3 μm/h); n = 3, P < 0.05. (G) Transwell migration assay. After 14 hours, more migrated BMSCs from Vegfafl/fl than Vegfa CKO mice; _n_= 3, *P < 0.01. Scale bars: 50 μm (G), 100 μm (A, B, and E), 200 μm (C and F). CB, cortical bone; outside, area outside cortical bone. Spearman’s correlation coefficient test (D) and unpaired 2-tailed Student’s t test were used.
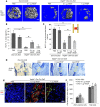
Figure 5. While 0.1 μg VEGF enhances, 1 μg recombinant VEGF fails to affect intramembranous bone formation in cortical defects of Vegfafl/fl Osx-Cre/ZsG mice at PSD10.
(A) 3D reconstruction of mineralized bone in hole region of Osx-Cre/ZsG mice treated with PBS or 0.1 μg VEGF and Vegfafl/fl Osx-Cre/ZsG mice treated with PBS, 0.1 μg or 1 μg VEGF. (B and C) BV/TV, based on μCT of bone formed in hole region and wounded BM (red area in diagram). (D) Density of aniline blue staining and mineralization/collagen ratio in the hole region (yellow stippled rectangles) of Vegfafl/fl Osx-Cre/ZsG mice treated with PBS (6.3% ± 1.8% and 47.2% ± 9.0%, respectively) significantly reduced (P < 0.01) compared with Osx-Cre/ZsG mice treated with PBS (24.2% ± 3.2% and 88.5% ± 7.2%, respectively). Administration of 0.1 μg VEGF increases density of aniline blue staining in hole region of Vegfafl/fl Osx-Cre/ZsG mice (18.6% ± 3.5%; P < 0.05 vs. Vegfafl/fl Osx-Cre/ZsG + PBS), but fails to significantly enhance mineralization/collagen ratio (54.5% ± 10.8% when compared with Vegfafl/fl Osx-Cre/ZsG mice treated with PBS). Compared with PBS, 1 μg VEGF has little effect on aniline blue staining and mineralization/collagen ratio (8.2% ± 1.6% and 41.6% ± 9.5%) in Vegfafl/fl Osx-Cre/ZsG mice. (E) VEGF (0.1 μg) enhances anti-BSP staining with or without normalization to ZsG+ cells in hole region of Vegfafl/fl Osx-Cre/ZsG mice (8.9% ± 2.3% and 7.3% ± 1.4%) compared with Vegfafl/fl Osx-Cre/ZsG mice treated with PBS (1.8% ± 0.6% and 1.2% ± 0.4%); P < 0.01 with and P < 0.05 without normalization. VEGF (0.1 μg) has no significant effect (1.9% ± 0.9% and 1.0% ± 0.4%). (F) Density of ZsG+ cells and total cell number in hole region of Vegfafl/fl Osx-Cre/ZsG (CKO) mice not significantly altered by VEGF treatment. Scale bars: 100 μm (A), 200 μm (D), 50 μm (E); n_= 5–6 mice for each group. Unpaired 2-tailed Student’s t test used. *P < 0.01; **,##P < 0.05. *,**_ vs. Osx-Cre/ZsG + PBS. ## vs_._ Vegfafl/fl Osx-Cre/ZsG + PBS.
Figure 4. Postnatal deletion of Vegfa in osteoblast lineage cells impairs intramembranous bone formation in cortical defects.
(A) Reduced body size and weight in 8-week-old Vegfa CKO mice (18.4 ± 0.7 g) compared with Vegfafl/fl mice without doxycycline (DOX) treatment (23.4 ± 0.7 g); n = 8–10, P < 0.01. This reduction was eliminated in DOX-treated mice (20.8 ± 0.3 g and 21.7 ± 1.1 g in the 2 groups); n = 4–6. (B) Absence of Cre-activated ZsG in diaphysis (DIA) and metaphysis (META) of 8-week-old Vegfafl/fl Osx-Cre/ZsG mice continuously fed with DOX; ZsG induced in mice by DOX withdrawal at 4 weeks. GP, growth plate. Representative images from 3 mice for each genotype. (C) μCT analysis of mineralized bone formed in hole region of 9-week-old Vegfa CKO mice with DOX withdrawn at 1 week shows reduced BV as percentage of total volume (BV/TV, 5.2% ± 1.9%), reduced Tb.N (5.4/mm ± 0.7/mm), but increased Tb.Sp (0.21 ± 0.03 mm) compared with that of Vegfafl/fl mice (BV/TV, 19.7% ± 2.4%; Tb. N, 11.9/mm ± 1.2/mm; Tb. Sp, 0.09 ± 0.01 mm). No significant differences were seen in Tb.Th; _n_= 6–10 for each genotype. BV/TV and Tb.N, P < 0.01; Tb.Sp, P < 0.05. (D) Reduced density of aniline blue staining (19.5% ± 4.2%) and decreased mineralization/collagen ratio (15.6% ± 5.1%) in hole region of 9-week-old Vegfa CKO mice with DOX withdrawn at 1 week, compared with Vegfafl/fl mice (40.8% ± 1.9% and 43.6% ± 7.2%); _n_= 6–10 for each genotype. Aniline blue staining, P < 0.01; mineralization/collagen ratio, P < 0.05. Yellow stippled rectangle: hole region. Scale bars: 100 μm (B and C), 200 μm (D). Unpaired 2-tailed Student’s t test was used for comparisons in C and D.
Figure 3. Reduced angiogenesis and osteoblast differentiation in Vegfafl/fl Osx-Cre/ZsG mice at PSD7.
(A and B) Low density of anti-BSP–stained (A) or anti-OCN–stained (B) areas with or without normalization to total numbers of ZsG+ cells, in hole region of Vegfafl/fl Osx-Cre/ZsG mice compared with Osx-Cre/ZsG mice. **P < 0.05. (C) Low density (113/mm2 ± 34/mm2) of blood vessels (determined by anti-CD31 staining) and low percentage (4.9% ± 0.7%) of vessel areas in hole region of Vegfafl/fl Osx-Cre/ZsG compared with Osx-Cre/ZsG mice (227/mm2 ± 29/mm2 and 12.6% ± 2.5%); P < 0.05. Blood vessel density was at an intermediate value (149/mm2 ± 23/mm2) in the hole region of Vegfafl/+ Osx-Cre/ZsG mice (D) High density (392/mm2 ± 37/mm2) of FSP1+ fibroblasts (red) and high percentage (18.3% ± 3%) of FSP1-expressing ZsG+ osteolineage cells in defects of Vegfafl/fl Osx-Cre/ZsG mice compared with Osx-Cre/ZsG mice (189/mm2 ± 34/mm2 and 4.8% ± 1.8%); P < 0.01. Yellow cells, indicated by white arrows, represent fibroblasts differentiated from osteolineage cells. Scale bars: 50 μm (A–D); _n_= 4–6 for each genotype. Unpaired 2-tailed Student’s t test was used for comparisons between the groups.
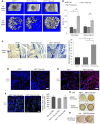
Figure 2. Impaired intramembranous bone formation in defects of Vegfa CKO mice at PSD7.
(A) Lateral views of 3D reconstruction of injured tibiae (top panel, scale bar: 500 μm) and mineralized bone formed in hole region (lower panel, scale bars: 100 μm) by μCT. Representative images from 6 mice of each genotype. (B–E) 3D structural parameters — trabecular BV/TV%, Tb.N, Tb.Sp, and Tb.Th — of mineralized bone formed in hole region by μCT; n = 6. (F) Aniline blue staining shows reduced collagen accumulation in hole region of Vegfa CKO mice. Density of aniline blue staining calculated for hole region (stippled yellow rectangles). Scale bar: 200 μm. (G) Low density of aniline blue–stained area in hole region of Vegfa CKO mice; n = 8–11. (H) Decreased mineralization/collagen ratio in Vegfa CKO mice; n = 5–6. (I and J) Alizarin red and Von Kossa staining of BMSCs (I) and osteoblasts (J) after culture in mineralization medium containing 100 nM dexamethasone for 21 days. (K) Alizarin red and Von Kossa staining of BMSCs (from Vegfafl/fl mice) treated with adenoviral GFP or Cre and cultured in mineralization medium with 100 nM dexamethasone for 21 days. The data are representative of 3 independent experiments (I–K). ANOVA with Tukey’s post-hoc test was used. *P < 0.01; **P < 0.05.
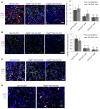
Figure 1. Osteoblastic lineage cells are an important source of VEGF at the bone-repair site.
(A) At PSD7, low density (6.1% ± 1.8%) of anti-VEGF staining (red) in defect hole region of Vegfafl/fl Osx-Cre/ZsG mice compared with Osx-Cre/ZsG mice (15.5% ± 2.1%); P < 0.05. The percentage of VEGF-expressing ZsG+ osteolineage cells (yellow) of total ZsG+ cells (yellow cells plus green cells) was 17.0% ± 5.2% in the hole region of Vegfafl/fl Osx-Cre/ZsG mice compared with Osx-Cre/ZsG mice (51.5% ± 8.3%); P < 0.05. Finally, the percentage of VEGF-expressing ZsG+ osteolineage cells (yellow) of total VEGF-expressing cells (yellow cells plus red cells) was also reduced in hole region of Vegfafl/fl Osx-Cre/ZsG mice (23.0% ± 1.8%) compared with Osx-Cre/ZsG mice (72.6% ± 6.2%); P < 0.05. (B) VEGF staining of trabecular bone, cortical bone, and the newly formed bone within cortical defects in WT mice at PSD7. Black arrows indicate VEGF-expressing osteoblasts lining the surface of trabecular bone (TB) or endosteum of cortical bone (CB). Representative images from 3 mice. Scale bar: 50 μm (A and B). Unpaired 2-tailed Student’s t test was used for comparisons of percentages between groups; _n_= 4–6 for each genotype.
Similar articles
- Vegfa regulates perichondrial vascularity and osteoblast differentiation in bone development.
Duan X, Murata Y, Liu Y, Nicolae C, Olsen BR, Berendsen AD. Duan X, et al. Development. 2015 Jun 1;142(11):1984-91. doi: 10.1242/dev.117952. Epub 2015 May 14. Development. 2015. PMID: 25977369 Free PMC article. - The roles of vascular endothelial growth factor in bone repair and regeneration.
Hu K, Olsen BR. Hu K, et al. Bone. 2016 Oct;91:30-8. doi: 10.1016/j.bone.2016.06.013. Epub 2016 Jun 25. Bone. 2016. PMID: 27353702 Free PMC article. Review. - Osteoblast recruitment to sites of bone formation in skeletal development, homeostasis, and regeneration.
Dirckx N, Van Hul M, Maes C. Dirckx N, et al. Birth Defects Res C Embryo Today. 2013 Sep;99(3):170-91. doi: 10.1002/bdrc.21047. Birth Defects Res C Embryo Today. 2013. PMID: 24078495 Review. - Osteoblast-derived EGFL6 couples angiogenesis to osteogenesis during bone repair.
Chen K, Liao S, Li Y, Jiang H, Liu Y, Wang C, Kuek V, Kenny J, Li B, Huang Q, Hong J, Huang Y, Chim SM, Tickner J, Pavlos NJ, Zhao J, Liu Q, Qin A, Xu J. Chen K, et al. Theranostics. 2021 Sep 27;11(20):9738-9751. doi: 10.7150/thno.60902. eCollection 2021. Theranostics. 2021. PMID: 34815781 Free PMC article. - VEGFA From Early Osteoblast Lineage Cells (Osterix+) Is Required in Mice for Fracture Healing.
Buettmann EG, McKenzie JA, Migotsky N, Sykes DA, Hu P, Yoneda S, Silva MJ. Buettmann EG, et al. J Bone Miner Res. 2019 Sep;34(9):1690-1706. doi: 10.1002/jbmr.3755. Epub 2019 Aug 1. J Bone Miner Res. 2019. PMID: 31081125 Free PMC article.
Cited by
- Targeting angiogenesis for fracture nonunion treatment in inflammatory disease.
Wang C, Ying J, Nie X, Zhou T, Xiao D, Swarnkar G, Abu-Amer Y, Guan J, Shen J. Wang C, et al. Bone Res. 2021 Jun 7;9(1):29. doi: 10.1038/s41413-021-00150-4. Bone Res. 2021. PMID: 34099632 Free PMC article. - Sequential application of small molecule therapy enhances chondrogenesis and angiogenesis in murine segmental defect bone repair.
Rundle CH, Gomez GA, Pourteymoor S, Mohan S. Rundle CH, et al. J Orthop Res. 2023 Jul;41(7):1471-1481. doi: 10.1002/jor.25493. Epub 2022 Dec 23. J Orthop Res. 2023. PMID: 36448182 Free PMC article. - Bone Microvasculature: Stimulus for Tissue Function and Regeneration.
Lee EJ, Jain M, Alimperti S. Lee EJ, et al. Tissue Eng Part B Rev. 2021 Aug;27(4):313-329. doi: 10.1089/ten.TEB.2020.0154. Epub 2020 Oct 22. Tissue Eng Part B Rev. 2021. PMID: 32940150 Free PMC article. Review. - Negative pressure wound therapy enhances bone regeneration compared with conventional therapy in a rabbit radius gap-healing model.
Zhu J, Wang F, Yan L, Wang J, Wu M, Hu R, An Y. Zhu J, et al. Exp Ther Med. 2021 May;21(5):474. doi: 10.3892/etm.2021.9905. Epub 2021 Mar 12. Exp Ther Med. 2021. PMID: 33767769 Free PMC article. - KDM5A controls bone morphogenic protein 2-induced osteogenic differentiation of bone mesenchymal stem cells during osteoporosis.
Wang C, Wang J, Li J, Hu G, Shan S, Li Q, Zhang X. Wang C, et al. Cell Death Dis. 2016 Aug 11;7(8):e2335. doi: 10.1038/cddis.2016.238. Cell Death Dis. 2016. PMID: 27512956 Free PMC article.
References
Publication types
MeSH terms
Substances
LinkOut - more resources
Full Text Sources
Other Literature Sources
Molecular Biology Databases
