Deregulation of STING Signaling in Colorectal Carcinoma Constrains DNA Damage Responses and Correlates With Tumorigenesis - PubMed (original) (raw)
Deregulation of STING Signaling in Colorectal Carcinoma Constrains DNA Damage Responses and Correlates With Tumorigenesis
Tianli Xia et al. Cell Rep. 2016.
Abstract
Stimulator of interferon genes (STING) has been shown to be critical for controlling antiviral responses as well as anti-tumor adaptive immunity, but little is known regarding its regulation in human tumors. Here, we report that STING signaling is recurrently suppressed in a wide variety of cancers, including colorectal carcinoma. Loss of STING signaling impeded DNA damage responses accountable for generating key cytokines that facilitate tissue repair and anti-tumor T cell priming, such as type I interferons (IFNs). Correspondingly, defective STING function was also highly predictive of effectual DNA-virus-mediated oncolytic activity. Thus, impaired STING responses may enable damaged cells to evade host immunosurveillance processes, although they provide a critical prognostic measurement that could help predict the outcome of effective oncoviral therapy.
Copyright © 2016 The Authors. Published by Elsevier Inc. All rights reserved.
Figures
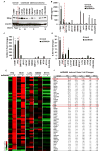
Figure 1. STING mediated dsDNA induced innate immune activation is impaired in majority of human colon cancer cell lines
(A) Immunoblot of STING in hTERT fibroblasts, normal human colon epithelial (FHC) and a series of human colon cancer cell lines. (B) ELISA analysis of human Interferon β production in the media of cells (same as A) transfected with 3μg/ml polyIC or dsDNA90 or mock transfected for 16 hours. (C) qPCR analysis of human CXCL10 expression in cells (same as A) transfected with 3μg/ml dsDNA90 or mock transfected for 3 hours. (D) qPCR analysis of human IL1B expression in cells same as C. Data is representative of at least two independent experiments. Error bars indicate s.d. *, p<0.05; **, p<0.01; ***, p<0.001; Student’s t-test. (E) Microarray analysis of gene expression in indicated normal and colon cancer cells mock transfected or transfected with 3μg/ml dsDNA90 for 3 hours. Highest variable genes are shown. Rows represent individual genes; columns represent individual samples. Pseudo-colors indicate transcript levels below (green), equal to (black), or above (red) the mean. Scale represents the intensity of gene expression (log10 scale ranges between −3 and 3). (F) Fold change values of highest variable genes shown in E. See also Figure S1 and S2.
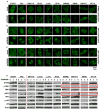
Figure 2. dsDNA induced STING signaling pathway is defective in majority of human colon cancer cell lines
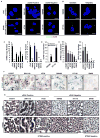
(A) Immunofluorescence Microscopy analysis of STING translocation in normal and human colon cancer cell lines transfected with 3μg/ml dsDNA90 or mock transfected for 3 hours. (B) Immunofluorescence Microscopy analysis of IRF3 translocation in cells same as A. (C) Immunofluorescence Microscopy analysis of p65 translocation in cells same as A. Representative images are shown at original magnification, 1260X. Bar size, 1μm. (D) Immunoblot analysis of STING signal activation in cells (same as above) transfected with 3μg/ml dsDNA90 for indicated time periods.
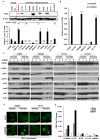
Figure 3. cGAS expression is suppressed in many human colon cancer cell lines and can be partially recapitulated through DNA demethylation
(A) Immunoblot (upper) and qPCR analysis (lower) of cGAS expression in normal and human colon cancer cells. (B) qPCR analysis of cGAS expression in cGAS negative colon cell lines mock treated or treated with 1 μM 5-Azacytidine (5AZADC) for 5 days. (C) Immunoblot analysis of STING signal activation in cells (selected from B) mock treated or treated with 1 μM 5-Azacytidine (5AZADC) for 5 days, followed by dsDNA90 transfection at 3μg/ml for indicated time periods. Data is representative of at least two independent experiments. Error bars indicate s.d. *, p<0.05; **, p<0.01; ***, p<0.001; Student’s t-test. (D) Immunofluorescence Microscopy analysis of IRF3 translocation in SW480 and HT116 cells treated with 5AZADC same as above followed by dsDNA transfection at 3μg/ml dsDNA90 for 3 hours. Representative images are shown at original magnification, 1260X. Bar size, 500 nm. (E) Normal and colon cancer cells were treated with AOM or DMH at 3 mM for 20 hours. IFNB induction was analyzed by qPCR analysis. See also Figure S3, S4.
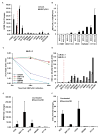
Figure 4. STING signal defect leads colon cancer cells more susceptible to DNA virus infection
(A) Cells (same as in figure 1) were infected with HSV1γ34.5 at M.O.I. 5 for 1 hour and human IFNB induction was analyzed by qPCR 3 hours post infection. (B) Normal human hTERT cells and selected human colon cancer cell lines (cGAS positive: SW1116, HT29; cGAS negative: SW480, HT116) were infected with HSV1γ34.5 at indicated M.O.I. for 1 hour, and titration of HSV1γ34.5 was analyzed by standard plaque assay in Vero cells 24 hours later. (C) Cells (same as in B) were infected with HSV1γ34.5 at M.O.I. 1 for 1 hour, and cell viability was analyzed by trypan blue staining 24 hours and 48 hours later. (D) Cells (same as in A) were infected with HSV1-Luc at indicated M.O.I. for 1 hour, and luciferase activity was analyzed 24 hours later. (E) Colon Cancer cells were infected with Vaccinia Virus at M.O.I. 100 and analyzed by qPCR for IFNB expression 3 hours post infection. (F) Cells same as E were analyzed by qPCR for CXCL10 expression. Data is representative of at least two independent experiments. Error bars indicate s.d. *, p<0.05; **, p<0.01; Student’s t-test. See also Figure S2.
Figure 5. RNA in situ hybridization and Immunohistochemistry analysis of STING and cGAS in human colon cancer cell lines
(A) RNA fluorescence in situ hybridization (RNA FISH) analysis of STING and cGAS expression in normal and human colon cancer cell lines. Representative images are shown at 1260X. Bar size, 500 nm. (B) RNA FISH analysis of STING and cGAS expression in SW480 and HT116 mock treated or treated with 1 μM 5 AZADC for 5 days. Representative images are shown at 1260X. Bar size, 500 nm. (C) Quantitation of STING and cGAS RNA copy number in A. (D) Quantitation of cGAS RNA copy number in B. (E) STING and cGAS expression in formalin-fixed paraffin-embedded (FFPE) normal and human colon cancer cell lines were analyzed by Chromogenic RNA in situ hybridization (RNA CISH). Quantitation of STING and cGAS RNA copy number are shown in bar graph. Data is representative of at least two independent experiments. Error bars indicate s.d. *, p<0.05; **, p<0.01; ***, p<0.001; Student’s t-test. (F) Representative images of STING and cGAS RNA CISH analysis are shown at 600X. Bar size, 1μm. (G) Immunohistochemistry analysis of cGAS and STING expression in colon cancer cells. Images were shown at 400X. Bar size, 20μm.
Figure 6. RNA in situ hybridization analysis in colon cancer tissue microarray
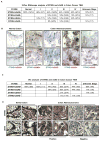
(A) RNA CISH analysis of STING and cGAS expression in a human colon cancer TMA. STING and/or cGAS expression status in each tissue is summarized in the table. (B) Representative images of A are shown at 400X. Bar size, 20μm. (C) IHC analysis of STING or cGAS expression in a human colon cancer TMA. Expression status is summarized in the table. (D) Representative images of C are shown at 200X. Bar size, 50μm. See Also Figure S5.
Figure 7. Increased HSV1γ34.5 oncolytic effect was observed in colon cancer cells with impaired STING signal in vivo
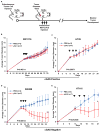
(A) Scheme of HSV1γ34.5 treatment on xenograft tumor in nude mice. (B–D)The indicated xenograft tumors were generated in the right flank of nude Balb/c mice. When tumors had reached approximately 0.5 cm in diameter, tumors were injected every other day a total of three times (arrows) with 1E7 PFU HSV1γ34.5 in 50 μl PBS (N=7) or 50 μl PBS only (N=3) and tumor growth measured every other day. Data is representative of two independent experiments. Statistical analysis was carried out comparing the two treatment groups at the last time point using the unpaired Student’s t-test. P values are as indicated.
Similar articles
- Suppression of STING signaling through epigenetic silencing and missense mutation impedes DNA damage mediated cytokine production.
Konno H, Yamauchi S, Berglund A, Putney RM, Mulé JJ, Barber GN. Konno H, et al. Oncogene. 2018 Apr;37(15):2037-2051. doi: 10.1038/s41388-017-0120-0. Epub 2018 Jan 25. Oncogene. 2018. PMID: 29367762 Free PMC article. - Recurrent Loss of STING Signaling in Melanoma Correlates with Susceptibility to Viral Oncolysis.
Xia T, Konno H, Barber GN. Xia T, et al. Cancer Res. 2016 Nov 15;76(22):6747-6759. doi: 10.1158/0008-5472.CAN-16-1404. Epub 2016 Sep 28. Cancer Res. 2016. PMID: 27680683 - Diverse roles of STING-dependent signaling on the development of cancer.
Ahn J, Konno H, Barber GN. Ahn J, et al. Oncogene. 2015 Oct 8;34(41):5302-8. doi: 10.1038/onc.2014.457. Epub 2015 Feb 2. Oncogene. 2015. PMID: 25639870 Free PMC article. - The emerging role of stimulator of interferons genes signaling in sepsis: Inflammation, autophagy, and cell death.
Hu Q, Knight PH, Ren Y, Ren H, Zheng J, Wu X, Ren J, Sawyer RG. Hu Q, et al. Acta Physiol (Oxf). 2019 Mar;225(3):e13194. doi: 10.1111/apha.13194. Epub 2018 Oct 22. Acta Physiol (Oxf). 2019. PMID: 30269441 Review. - New perspectives on type I IFNs in cancer.
Gajewski TF, Corrales L. Gajewski TF, et al. Cytokine Growth Factor Rev. 2015 Apr;26(2):175-8. doi: 10.1016/j.cytogfr.2015.01.001. Epub 2015 Jan 7. Cytokine Growth Factor Rev. 2015. PMID: 25630967 Free PMC article. Review.
Cited by
- Nuclear Membrane Rupture and Its Consequences.
Maciejowski J, Hatch EM. Maciejowski J, et al. Annu Rev Cell Dev Biol. 2020 Oct 6;36:85-114. doi: 10.1146/annurev-cellbio-020520-120627. Epub 2020 Jul 21. Annu Rev Cell Dev Biol. 2020. PMID: 32692592 Free PMC article. Review. - Loss of Annexin A1 in macrophages restrains efferocytosis and remodels immune microenvironment in pancreatic cancer by activating the cGAS/STING pathway.
Hou Z, Lu F, Lin J, Wu Y, Chen L, Fang H, Chen L, Zhang S, Huang H, Pan Y. Hou Z, et al. J Immunother Cancer. 2024 Sep 4;12(9):e009318. doi: 10.1136/jitc-2024-009318. J Immunother Cancer. 2024. PMID: 39237260 Free PMC article. - Decreased Expression of TMEM173 Predicts Poor Prognosis in Patients with Hepatocellular Carcinoma.
Bu Y, Liu F, Jia QA, Yu SN. Bu Y, et al. PLoS One. 2016 Nov 4;11(11):e0165681. doi: 10.1371/journal.pone.0165681. eCollection 2016. PLoS One. 2016. PMID: 27814372 Free PMC article. - Tousled-Like Kinases Suppress Innate Immune Signaling Triggered by Alternative Lengthening of Telomeres.
Segura-Bayona S, Villamor-Payà M, Attolini CS, Koenig LM, Sanchiz-Calvo M, Boulton SJ, Stracker TH. Segura-Bayona S, et al. Cell Rep. 2020 Aug 4;32(5):107983. doi: 10.1016/j.celrep.2020.107983. Cell Rep. 2020. PMID: 32755577 Free PMC article. - Intimate communications within the tumor microenvironment: stromal factors function as an orchestra.
Cheng B, Yu Q, Wang W. Cheng B, et al. J Biomed Sci. 2023 Jan 4;30(1):1. doi: 10.1186/s12929-022-00894-z. J Biomed Sci. 2023. PMID: 36600243 Free PMC article. Review.
References
- Ahn J, Barber GN. Self-DNA, STING-dependent signaling and the origins of autoinflammatory disease. Current opinion in immunology. 2014;31:121–126. - PubMed
MeSH terms
LinkOut - more resources
Full Text Sources
Other Literature Sources
Medical
Research Materials
