Obesity and Cancer: An Angiogenic and Inflammatory Link - PubMed (original) (raw)
Review
Obesity and Cancer: An Angiogenic and Inflammatory Link
Dai Fukumura et al. Microcirculation. 2016 Apr.
Abstract
With the current epidemic of obesity, a large number of patients diagnosed with cancer are overweight or obese. Importantly, this excess body weight is associated with tumor progression and poor prognosis. The mechanisms for this worse outcome, however, remain poorly understood. We review here the epidemiological evidence for the association between obesity and cancer, and discuss potential mechanisms focusing on angiogenesis and inflammation. In particular, we will discuss how the dysfunctional angiogenesis and inflammation occurring in adipose tissue in obesity may promote tumor progression, resistance to chemotherapy, and targeted therapies such as anti-angiogenic and immune therapies. Better understanding of how obesity fuels tumor progression and therapy resistance is essential to improve the current standard of care and the clinical outcome of cancer patients. To this end, we will discuss how an anti-diabetic drug such as metformin can overcome these adverse effects of obesity on the progression and treatment resistance of tumors.
Keywords: IL-1β; IL-6; VEGFR-1; cytokines; desmoplasia; hypoxia; immune environment; metformin; obesity.
© 2016 John Wiley & Sons Ltd.
Figures
Figure 1
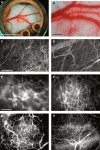
Angiogenesis and vessel remodeling during adipogenesis in the mouse dorsal skinfold chamber after 3T3-F442A cell implantation. (A, B) Macroscopic images 9 days after implantation. (C, D) Multiphoton laser-scanning microscopy images 28 days after preadipocyte implantation. Images were obtained by maximum intensity projection of 31 optical slices, each 5 _μ_m thick: the top 150-_μ_m de novo adipose tissue layer (C) and the bottom 150-_μ_m host subcutaneous layer (D). (E through H) High-power microscopic images of fluorescence contrast-enhanced blood vessels at 7 days (E), 14 days (F), 21 days (G), and 28 days (H) after implantation. Bars indicate 5 mm (A), 0.5 mm (B), 200 _μ_m (C, D), and 100 _μ_m (E through H), respectively. This figure is reproduced from Fukumura et al., Circ Res, 2003, with permission of the publisher.
Figure 2
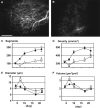
Effect of VEGFR2 blockade on angiogenesis and adipogenesis. (A, B) Visualization of rhodamine–dextran contrast-enhanced blood vessels 21 days after preadipocyte implantation with control rat IgG (A) and DC101, rat monoclonal anti-mouse VEGFR2 antibody (B) treatments. (C through F) Quantitative analyzes of tissue neovascularization; C, number of vessel segments; D, vascular length density; E, vessel diameter; F, vessel volume. Filled circles represent control IgG treatment (n = 6 mice); open squares, DC101 treatment (n = 6 mice). *P<0.01 as compared with IgG by two-tailed _t_-test. This figure is reproduced from Fukumura et al., Circ Res, 2003, with permission from the publisher.
Figure 3
Effects of VEGFR1 (MF1) and VEGFR2 (DC101) blockade in mice with DIO. (A) Body weight gain relative to weight at day 0 for mice given different diets and treatments. Male C57BL6 mice, 10–12 weeks old at time 0, were used for all groups. All diets and treatments began at day 0, at dosages and schedules as described in the Methods section. DC101 + HFD, DC101 treatment, white triangles (n = 5). MF1 + HFD, MF1 treatment, black squares (n = 5). HFD controls, no treatment (n = 4) or PBS treatment (n = 4), white circles. LFD: standard diet controls, crosses (n = 4). All data reported as mean ± SEM. Asterisks denote significant difference between DC101 + HFD and HFD groups (p, 0.05). This figure is reproduced from Tam et al., PLOS one, 2009, with permission from the publisher.
Figure 4
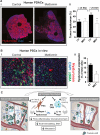
(A) Metformin treatment associates with reduced hyaluronan levels in human pancreatic cancers in overweight/obese patients. (i) Representative histology images showing the effect of metformin on tumor hyaluronan levels in normal weight or overweight/obese patients (n = 22 controls, 7 metformin). (ii) Immunohistochemical analysis of total tumor hyaluronan levels. Metformin decreases the hyaluronan-positive area fraction (%) in patients with BMI >25. Data are presented as the mean ± standard error. *p < 0.05 vs. control in patients with BMI >25. (B) Metformin reduces hyaluronan production by PSC. (i) PSCs were incubated in vitro with metformin (1 mM) for 48 hours. Representative immunocytochemistry images showing the effect of metformin on tumor hyaluronan and COL-I levels in human PSCs in vitro (n = 2). (ii) Quantification of hyaluronan expression in PSCs. Metformin decreases the expression of hyaluronan on PSCs. _α_SMA denotes activated PSCs. (C) Metformin inactivates PSCs and TAMs, alleviates the fibroinflammatory tumor microenvironment and reduces metastasis. Metformin treatment reduces COL-I and HA production by PSCs, leading to decreased fibrosis in PDACs. Metformin treatment also reduces cytokine production, infiltration, and M2 polarization of TAMs, leading to decreased inflammation. These lead to improved desmoplasia and reduced ECM remodeling, EMT, and metastasis. This figure is reproduced from Incio et al., PLOS One, 2015, with permission from the publisher.
Figure 5
The evolution of the mouse tumor model. For preclinical cancer study, we have observed an evolution of mouse models to better represent the clinical setting: It evolves from a heterotopic to an orthotopic xenograft, from xenograft tumors in immunodeficient mice to syngeneic models, from transplantation model to genetic mouse models that better reflect the initial stages of tumor development or patient-derived xenografts to accurately represent tumor heterogeneity. Finally, we need to incorporate the obese mouse model as another dimension of improvement of the mouse model to better mimic patient population.
Figure 6
Obesity-tailored rethinking the approach to pre-clinical cancer research in light of the current obesity epidemics. Obesity patients may respond differently to a treatment or need additional therapy in order to make the treatment effective. The development of such strategy requires the use of animal models that better mimic biology and microenvironment of obese patients.
Similar articles
- Targeting tumor micro-environment for design and development of novel anti-angiogenic agents arresting tumor growth.
Gacche RN, Meshram RJ. Gacche RN, et al. Prog Biophys Mol Biol. 2013 Nov;113(2):333-54. doi: 10.1016/j.pbiomolbio.2013.10.001. Epub 2013 Oct 15. Prog Biophys Mol Biol. 2013. PMID: 24139944 Review. - Obesity and cancer phenotype: Is angiogenesis a missed link?
Mendonça F, Soares R. Mendonça F, et al. Life Sci. 2015 Oct 15;139:16-23. doi: 10.1016/j.lfs.2015.08.009. Epub 2015 Aug 19. Life Sci. 2015. PMID: 26297445 Review. - Effects of Korean red ginseng (Panax ginseng) on obesity and adipose inflammation in ovariectomized mice.
Lee H, Choi J, Shin SS, Yoon M. Lee H, et al. J Ethnopharmacol. 2016 Feb 3;178:229-37. doi: 10.1016/j.jep.2015.12.017. Epub 2015 Dec 17. J Ethnopharmacol. 2016. PMID: 26707750 - From obesity to cancer: a review on proposed mechanisms.
Tahergorabi Z, Khazaei M, Moodi M, Chamani E. Tahergorabi Z, et al. Cell Biochem Funct. 2016 Dec;34(8):533-545. doi: 10.1002/cbf.3229. Epub 2016 Nov 9. Cell Biochem Funct. 2016. PMID: 27859423 Review. - Antiangiogenic therapies: going beyond their limits.
Moserle L, Jiménez-Valerio G, Casanovas O. Moserle L, et al. Cancer Discov. 2014 Jan;4(1):31-41. doi: 10.1158/2159-8290.CD-13-0199. Epub 2013 Dec 19. Cancer Discov. 2014. PMID: 24356098 Review.
Cited by
- An Updated Review of Resistin and Colorectal Cancer.
Rompou AV, Bletsa G, Tsakogiannis D, Theocharis S, Vassiliu P, Danias N. Rompou AV, et al. Cureus. 2024 Jul 26;16(7):e65403. doi: 10.7759/cureus.65403. eCollection 2024 Jul. Cureus. 2024. PMID: 39184804 Free PMC article. Review. - Escape from breast tumor dormancy: The convergence of obesity and menopause.
Roy R, Yang J, Shimura T, Merritt L, Alluin J, Man E, Daisy C, Aldakhlallah R, Dillon D, Pories S, Chodosh LA, Moses MA. Roy R, et al. Proc Natl Acad Sci U S A. 2022 Oct 11;119(41):e2204758119. doi: 10.1073/pnas.2204758119. Epub 2022 Oct 3. Proc Natl Acad Sci U S A. 2022. PMID: 36191215 Free PMC article. - An inflammatory memory and angiogenic self-assembling nanofiber hydrogel scaffold seeded with Akkermansia muciniphila to accelerate the healing of diabetic ischemic ulcers.
Cheng P, Yao L, Chen X, Su X, Su X, Huang Q, Hou C. Cheng P, et al. RSC Adv. 2018 May 14;8(31):17357-17364. doi: 10.1039/c8ra01662c. eCollection 2018 May 9. RSC Adv. 2018. PMID: 35539240 Free PMC article. - Exosomal linc-ROR mediates crosstalk between cancer cells and adipocytes to promote tumor growth in pancreatic cancer.
Sun Z, Sun D, Feng Y, Zhang B, Sun P, Zhou B, Du L, Wang Y, Fan Z, Yang J, Li Y, Hu S, Zhan H. Sun Z, et al. Mol Ther Nucleic Acids. 2021 Jun 4;26:253-268. doi: 10.1016/j.omtn.2021.06.001. eCollection 2021 Dec 3. Mol Ther Nucleic Acids. 2021. PMID: 34513308 Free PMC article. - Tissue mechanics in stem cell fate, development, and cancer.
Hayward MK, Muncie JM, Weaver VM. Hayward MK, et al. Dev Cell. 2021 Jul 12;56(13):1833-1847. doi: 10.1016/j.devcel.2021.05.011. Epub 2021 Jun 8. Dev Cell. 2021. PMID: 34107299 Free PMC article. Review.
References
- Algire C, Zakikhani M, Blouin MJ, Shuai JH, Pollak M. Metformin attenuates the stimulatory effect of a high-energy diet on in vivo LLC1 carcinoma growth. Endocr Relat Cancer. 2008;15:833–839. - PubMed
- Alvarez R, Musteanu M, Garcia-Garcia E, Lopez-Casas PP, Megias D, Guerra C, Munoz M, Quijano Y, Cubillo A, Rodriguez-Pascual J, Plaza C, de Vicente E, Prados S, Tabernero S, Barbacid M, Lopez-Rios F, Hidalgo M. Stromal disrupting effects of nab-paclitaxel in pancreatic cancer. Br J Cancer. 2013;109:926–933. - PMC - PubMed
- Anisimov VN. Metformin for prevention and treatment of colon cancer: a reappraisal of experimental and clinical data. Curr Drug Targets. 2016;17:439–446. - PubMed
- Arita Y, Kihara S, Ouchi N, Takahashi M, Maeda K, Miyagawa J, Hotta K, Shimomura I, Nakamura T, Miyaoka K, Kuriyama H, Nishida M, Yamashita S, Okubo K, Matsubara K, Muraguchi M, Ohmoto Y, Funahashi T, Matsuzawa Y. Paradoxical decrease of an adipose-specific protein, adiponectin, in obesity. 1999. Biochem Biophys Res Commun. 2012;425:560–564. - PubMed
Publication types
MeSH terms
Substances
Grants and funding
- R01 CA126642/CA/NCI NIH HHS/United States
- CA096915/CA/NCI NIH HHS/United States
- R01 CA085140/CA/NCI NIH HHS/United States
- CA126642/CA/NCI NIH HHS/United States
- CA080124/CA/NCI NIH HHS/United States
- R35 CA197743/CA/NCI NIH HHS/United States
- P01 CA080124/CA/NCI NIH HHS/United States
- CA197743/CA/NCI NIH HHS/United States
- R24 CA085140/CA/NCI NIH HHS/United States
- CA085140/CA/NCI NIH HHS/United States
- R01 CA115767/CA/NCI NIH HHS/United States
- R01 CA096915/CA/NCI NIH HHS/United States
- CA115767/CA/NCI NIH HHS/United States
LinkOut - more resources
Full Text Sources
Other Literature Sources
Medical


