Haplotyping germline and cancer genomes with high-throughput linked-read sequencing - PubMed (original) (raw)
doi: 10.1038/nbt.3432. Epub 2016 Feb 1.
Billy T Lau 2, Michael Schnall-Levin 1, Mirna Jarosz 1, John M Bell 2, Christopher M Hindson 1, Sofia Kyriazopoulou-Panagiotopoulou 1, Donald A Masquelier 1, Landon Merrill 1, Jessica M Terry 1, Patrice A Mudivarti 1, Paul W Wyatt 1, Rajiv Bharadwaj 1, Anthony J Makarewicz 1, Yuan Li 1, Phillip Belgrader 1, Andrew D Price 1, Adam J Lowe 1, Patrick Marks 1, Gerard M Vurens 1, Paul Hardenbol 1, Luz Montesclaros 1, Melissa Luo 1, Lawrence Greenfield 1, Alexander Wong 1, David E Birch 1, Steven W Short 1, Keith P Bjornson 1, Pranav Patel 1, Erik S Hopmans 2, Christina Wood 3, Sukhvinder Kaur 1, Glenn K Lockwood 1, David Stafford 1, Joshua P Delaney 1, Indira Wu 1, Heather S Ordonez 1, Susan M Grimes 2, Stephanie Greer 3, Josephine Y Lee 1, Kamila Belhocine 1, Kristina M Giorda 1, William H Heaton 1, Geoffrey P McDermott 1, Zachary W Bent 1, Francesca Meschi 1, Nikola O Kondov 1, Ryan Wilson 1, Jorge A Bernate 1, Shawn Gauby 1, Alex Kindwall 1, Clara Bermejo 1, Adrian N Fehr 1, Adrian Chan 1, Serge Saxonov 1, Kevin D Ness 1, Benjamin J Hindson 1, Hanlee P Ji 2 3
Affiliations
- PMID: 26829319
- PMCID: PMC4786454
- DOI: 10.1038/nbt.3432
Haplotyping germline and cancer genomes with high-throughput linked-read sequencing
Grace X Y Zheng et al. Nat Biotechnol. 2016 Mar.
Abstract
Haplotyping of human chromosomes is a prerequisite for cataloguing the full repertoire of genetic variation. We present a microfluidics-based, linked-read sequencing technology that can phase and haplotype germline and cancer genomes using nanograms of input DNA. This high-throughput platform prepares barcoded libraries for short-read sequencing and computationally reconstructs long-range haplotype and structural variant information. We generate haplotype blocks in a nuclear trio that are concordant with expected inheritance patterns and phase a set of structural variants. We also resolve the structure of the EML4-ALK gene fusion in the NCI-H2228 cancer cell line using phased exome sequencing. Finally, we assign genetic aberrations to specific megabase-scale haplotypes generated from whole-genome sequencing of a primary colorectal adenocarcinoma. This approach resolves haplotype information using up to 100 times less genomic DNA than some methods and enables the accurate detection of structural variants.
Conflict of interest statement
COMPETING FINANCIAL INTERESTS
The following authors, as listed by initials, are employees of 10× Genomics: G.X.Y.Z., M.S., M.J., C.M.H., S.K.P, D.A.M., L.M., J.M.T., P.A.M., P.W.W., R.B., A.J.M., Y.L., P.B., A.D.P., A.J.L., P.J.M, G.M.V., P.H., L.M., M.L., L.G., A.W., D.E.B., S.W.S., K.P.B., P.V. P., S.K., G.K.L., D.L.S., J.P.D., I.W., H.S.O, J.Y.L., Z.K.B., K.M.G, W.H.H., G.P.D., Z.W.B., F.M., N.O.K., R.T.W., J.A.B., S.P.G., A.P.K., C.B., A.N.F., A.C., S.S., K.D.N., B.J.H.
Figures
Figure 1. Overview of the technology for generating linked-reads
(a) Gel beads loaded with primers and barcoded oligonucleotides are first mixed with DNA and enzyme mixture, and subsequently mixed with oil-surfactant solution at a microfluidic “double-cross” junction. Gel bead-containing droplets flow to a reservoir where gel beads are dissolved, initiating whole genome primer extension. The products are pooled from each droplet. The final library preparation requires shearing the libraries and incorporation of Illumina adapters. (b) Top panel, linked-reads of the ALK gene from the NA12878 WGS sample. Each line represents linked-reads with the same barcode, with dots representing reads, and color depicting reads with different barcodes. Middle panel, blue blocks showing exon boundaries of the ALK gene. Bottom panel, linked-reads of ALK gene from the NA12878 exome data. Although there are only reads in exon regions, reads from neighboring exons are linked because of common barcodes. Only a very small fraction of linked-reads is presented here to conserve space.
Figure 2. Phasing performance of NA12878 trio analysis
(a) Length-weighted molecule size histogram of the trio WGS data. The Y-axis represents the DNA mass in the molecule length bin, which is calculated to be the product of fraction of molecules in the length bin and median of the length bin. (b) Cumulative distribution function of phase block length of the trio WGS samples. (c) Phasing accuracy. For all pairs of SNVs that are on the same phasing block, the probability of correct phasing of a pair is plotted as a function of its distance. The insert shows SNV pairs that are at least 0.1Mb away from each other. (d) Haplotype blocks of LRRK2 gene of the trio exome libraries, demonstrating Mendelian inheritance. While most of this gene is phased in all trio samples, the beginning of the gene is not phased (represented by SNVs not as part of the haplotype block). For this gene, NA12882 (child) inherited one allele from Haplotype 2 from NA12877 (father), and Haplotype 1 from NA12878 (mother). Grey bars in the phase blocks represent reference alleles, and green bars represent alternative alleles.
Figure 3. Detecting genomic deletions in NA12878
(a) Heat map of overlapping barcodes is plotted for a deletion on Chr6: 78,967,194 – 79,036,419 in NA12878 (top). The areas circled in black represent overlapping barcodes near the breakpoints. The deletion is not observed in NA12882, and the heap map of barcodes in the same region is shown in the bottom as a negative control. (b) linked-read data of NA12878 WGS sample spanning Chr6: 78,967,194 – 79,036,419. Each line represents linked-reads with the same barcode, with dots representing reads, and color depicting reads with different barcodes. Dashed vertical black lines represent the breakpoints. The top panel represents the haplotype without a deletion. In this case, overlapping barcodes will only be observed in contiguous regions. Bottom panel represents the haplotype with a deletion, as shown by the gap in the linked-reads. In contrast to regions without a deletion, barcodes in the region before the gap will overlap with barcodes in the region after the gap. (c) Summary of 8 deletion candidates, including supporting evidence from overlapping barcode count, phasing of the deletion breakpoints, and inheritance support in NA12882. While all 5 high scoring SV candidates have support from each type of evidence, two of three lower scoring SV candidates lack support from any evidence included targeted sequencing. Haplotype assignment in one phase block is not necessarily the same as the haplotype assignment in a different phase block.
Figure 4. Rearrangement detection of an EML4-ALK gene fusion from exome sequencing of NCI-H2228
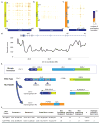
(a) Overlap of barcodes between exons 2–16 of ALK and exons 2–6 of EML4. The heat map depicts the number of overlapping barcodes. Blue bars on ALK and EML4 represent exons. (b) Overlap of barcodes between exon 1 of ALK and exons 7–16 of EML4. (c) Overlap of barcodes between exons 10–11 of ALK and 5′ half of PTPN3. (d) Barcode counts in ALK region of NCI-H2228 WGS sample. The top blue bar represents the schematics of ALK gene structure, with e1, e2, and e10 denoting exon 1, exon 2, and exon 10, respectively. (e) Schematics illustrating complex chromosomal rearrangement involving ALK, EML4 and PTPN3. Instead of seeing the simple inversion reported in the literature, we observed a deletion, an inversion of ALK on Chr2 with EML4, and an insertion of ALK into PTPN3 on Chr9. (f) Phasing support around ALK and PTPN3 breakpoints in EML4-ALK, and ALK-PTPN3 gene fusion. Haplotype assignment in one phase block is not necessarily the same as the haplotype assignment in a different phase block.
Figure 5. Phasing analysis of a primary colon cancer genome and structure of the TP53 driver event
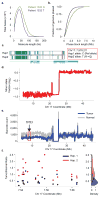
(a) Length-weighted molecule size histogram of Patient 1532 Normal (green) and Tumor (purple) samples. (b) Cumulative distribution function of phase block length of the Normal and Tumor pair. (c) Phased haplotype block showing TP53 C to T mutation on Haplotype 2. (d) Minor allele fraction of the tumor sample (relative to the matched normal) on Chr 17. There is a deletion in the p-arm of Chr 17 in the tumor sample with a copy number of 1. (e) Barcode count throughout Chr 17 between the tumor (blue) and matched normal (grey). The red box depicts the region where TP53 is located. (f) Phasing analysis of TP53 between tumor and matched normal. Left, Ratio of SNV counts between Tumor and Normal in TP53 region, Haplotype 1 in red and Haplotype 2 in black. Right, Density of SNV ratios of Haplotype 1 and Haplotype 2. Whereas the SNV density centers around 1 for Haplotype 2, most SNV ratios between Tumor and Normal is only 0.5 on Haplotype 2, indicating that LOH is on Haplotype 2.
Comment in
- Haplotypes drop by drop.
Kitzman JO. Kitzman JO. Nat Biotechnol. 2016 Mar;34(3):296-8. doi: 10.1038/nbt.3500. Nat Biotechnol. 2016. PMID: 26963554 No abstract available.
Similar articles
- A Fosmid Pool-Based Next Generation Sequencing Approach to Haplotype-Resolve Whole Genomes.
Suk EK, Schulz S, Mentrup B, Huebsch T, Duitama J, Hoehe MR. Suk EK, et al. Methods Mol Biol. 2017;1551:223-269. doi: 10.1007/978-1-4939-6750-6_13. Methods Mol Biol. 2017. PMID: 28138850 - Ultralow-input single-tube linked-read library method enables short-read second-generation sequencing systems to routinely generate highly accurate and economical long-range sequencing information.
Chen Z, Pham L, Wu TC, Mo G, Xia Y, Chang PL, Porter D, Phan T, Che H, Tran H, Bansal V, Shaffer J, Belda-Ferre P, Humphrey G, Knight R, Pevzner P, Pham S, Wang Y, Lei M. Chen Z, et al. Genome Res. 2020 Jun;30(6):898-909. doi: 10.1101/gr.260380.119. Epub 2020 Jun 15. Genome Res. 2020. PMID: 32540955 Free PMC article. - Linked read sequencing resolves complex genomic rearrangements in gastric cancer metastases.
Greer SU, Nadauld LD, Lau BT, Chen J, Wood-Bouwens C, Ford JM, Kuo CJ, Ji HP. Greer SU, et al. Genome Med. 2017 Jun 19;9(1):57. doi: 10.1186/s13073-017-0447-8. Genome Med. 2017. PMID: 28629429 Free PMC article. - Haplotyping-Assisted Diploid Assembly and Variant Detection with Linked Reads.
Hu Y, Yang C, Zhang L, Zhou X. Hu Y, et al. Methods Mol Biol. 2023;2590:161-182. doi: 10.1007/978-1-0716-2819-5_11. Methods Mol Biol. 2023. PMID: 36335499 Review. - Cancer whole-genome sequencing: present and future.
Nakagawa H, Wardell CP, Furuta M, Taniguchi H, Fujimoto A. Nakagawa H, et al. Oncogene. 2015 Dec 3;34(49):5943-50. doi: 10.1038/onc.2015.90. Epub 2015 Mar 30. Oncogene. 2015. PMID: 25823020 Review.
Cited by
- Read cloud sequencing elucidates microbiome dynamics in a hematopoietic cell transplant patient.
Kang J, Siranosian B, Moss E, Andermann T, Bhatt A. Kang J, et al. Proceedings (IEEE Int Conf Bioinformatics Biomed). 2018 Dec;2018:234-241. doi: 10.1109/bibm.2018.8621297. Epub 2019 Jan 24. Proceedings (IEEE Int Conf Bioinformatics Biomed). 2018. PMID: 33833903 Free PMC article. - Neotelomeres and Telomere-Spanning Chromosomal Arm Fusions in Cancer Genomes Revealed by Long-Read Sequencing.
Tan KT, Slevin MK, Leibowitz ML, Garrity-Janger M, Li H, Meyerson M. Tan KT, et al. bioRxiv [Preprint]. 2023 Dec 1:2023.11.30.569101. doi: 10.1101/2023.11.30.569101. bioRxiv. 2023. PMID: 38077026 Free PMC article. Updated. Preprint. - Simultaneous de novo calling and phasing of genetic variants at chromosome-scale using NanoStrand-seq.
Bai X, Chen Z, Chen K, Wu Z, Wang R, Liu J, Chang L, Wen L, Tang F. Bai X, et al. Cell Discov. 2024 Jul 9;10(1):74. doi: 10.1038/s41421-024-00694-9. Cell Discov. 2024. PMID: 38977679 Free PMC article. - MsPAC: a tool for haplotype-phased structural variant detection.
Rodriguez OL, Ritz A, Sharp AJ, Bashir A. Rodriguez OL, et al. Bioinformatics. 2020 Feb 1;36(3):922-924. doi: 10.1093/bioinformatics/btz618. Bioinformatics. 2020. PMID: 31397844 Free PMC article. - Sequencing Technologies and Analyses: Where Have We Been and Where Are We Going?
Bansal V, Boucher C. Bansal V, et al. iScience. 2019 Aug 30;18:37-41. doi: 10.1016/j.isci.2019.06.035. Epub 2019 Aug 15. iScience. 2019. PMID: 31472161 Free PMC article.
References
Publication types
MeSH terms
Substances
Grants and funding
- R01 HG006137/HG/NHGRI NIH HHS/United States
- P01 HG000205/HG/NHGRI NIH HHS/United States
- R01HG006137/HG/NHGRI NIH HHS/United States
- R33CA174575/CA/NCI NIH HHS/United States
- Howard Hughes Medical Institute/United States
- R33 CA174575/CA/NCI NIH HHS/United States
- P01HG000205/HG/NHGRI NIH HHS/United States
- U01 CA151920/CA/NCI NIH HHS/United States
LinkOut - more resources
Full Text Sources
Other Literature Sources


