Color-Biased Regions of the Ventral Visual Pathway Lie between Face- and Place-Selective Regions in Humans, as in Macaques - PubMed (original) (raw)
Color-Biased Regions of the Ventral Visual Pathway Lie between Face- and Place-Selective Regions in Humans, as in Macaques
Rosa Lafer-Sousa et al. J Neurosci. 2016.
Abstract
The existence of color-processing regions in the human ventral visual pathway (VVP) has long been known from patient and imaging studies, but their location in the cortex relative to other regions, their selectivity for color compared with other properties (shape and object category), and their relationship to color-processing regions found in nonhuman primates remain unclear. We addressed these questions by scanning 13 subjects with fMRI while they viewed two versions of movie clips (colored, achromatic) of five different object classes (faces, scenes, bodies, objects, scrambled objects). We identified regions in each subject that were selective for color, faces, places, and object shape, and measured responses within these regions to the 10 conditions in independently acquired data. We report two key findings. First, the three previously reported color-biased regions (located within a band running posterior-anterior along the VVP, present in most of our subjects) were sandwiched between face-selective cortex and place-selective cortex, forming parallel bands of face, color, and place selectivity that tracked the fusiform gyrus/collateral sulcus. Second, the posterior color-biased regions showed little or no selectivity for object shape or for particular stimulus categories and showed no interaction of color preference with stimulus category, suggesting that they code color independently of shape or stimulus category; moreover, the shape-biased lateral occipital region showed no significant color bias. These observations mirror results in macaque inferior temporal cortex (Lafer-Sousa and Conway, 2013), and taken together, these results suggest a homology in which the entire tripartite face/color/place system of primates migrated onto the ventral surface in humans over the course of evolution.
Significance statement: Here we report that color-biased cortex is sandwiched between face-selective and place-selective cortex on the bottom surface of the brain in humans. This face/color/place organization mirrors that seen on the lateral surface of the temporal lobe in macaques, suggesting that the entire tripartite system is homologous between species. This result validates the use of macaques as a model for human vision, making possible more powerful investigations into the connectivity, precise neural codes, and development of this part of the brain. In addition, we find substantial segregation of color from shape selectivity in posterior regions, as observed in macaques, indicating a considerable dissociation of the processing of shape and color in both species.
Keywords: IT; VVP; color; fMRI; homology; topography.
Copyright © 2016 Lafer-Sousa et al.
Figures
Figure 1.
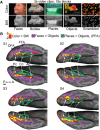
Sandwiching of color-biased regions between face-selective cortex and place-selective regions. A, Frames from the video clips used to define functional ROIs. Each stimulus block comprised video clips from one stimulus category (Faces, Bodies, Scenes, Objects, and Scrambled Objects) presented in color or luminance-matched grayscale (6 3 s clips/block). B, Color-biased activity on the ventral cortical surface in four subjects (S1–S4; color scale shows exponent of the p level for the chromatic > achromatic contrast defined using video clips from all categories). Color-biased activity in the ventral visual pathway was found between the more lateral face-selective regions (faces > objects contrast, p < 0.0001, purple outlines) and the more medial/ventral place-selective regions (scenes > objects, p < 0.0001, green outlines). Color-biased activity spans much of the posterior-to-anterior extent of the VVP. Three peaks in the color-biased activity were defined in most subjects: Pc (called elsewhere V4 or hV4), Cc (V4α/V8/VO-complex), and Ac. The white dashed line denotes the ptCoS, which runs transversely to the base of the CoS and defines the border between V4 and the ventral occipital complex VO (Winawer et al., 2010; Witthoft et al., 2013). The boundaries of early visual areas as defined by standard meridian mapping (vertical/horizontal reversals) are shown for S1. Scale bar, 1 cm.
Figure 2.
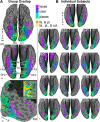
Relative cortical location of face, color, and place activations. A, Group overlap maps. Data from each subject (n = 13) were registered to a published group-average template. Individual contrast maps were thresholded (p < 0.01 uncorrected) and tallied such that each resultant voxel represented the number of subjects who had above-threshold activity at that location. Voxels for which at least five subjects had above threshold activity are colored: face-selective voxels (purple), color-biased (blue), and place-selective (green); dark purple shows overlap of face and color; cyan shows overlap of color and place; orange shows overlap of face and place; yellow shows overlap of face, color, and place. Top panel shows the pial surface (ventral view); middle panel shows the digitally inflated surface (prefrontal cortex excluded); bottom panel shows the digitally flattened surface (RH, right hemisphere; dark gray mask overlays regions outside functional scans). The white dashed line denotes the anterior border of V4 (ptCoS). Horizontal (solid lines) and vertical (dashed lines) meridians were obtained by mapping meridian representations; colors in the flat map inset (bottom) show voxels in which at least five subjects had above threshold activity (yellow, horizontal meridian stimulation; cyan, vertical meridian stimulation; _p_ < 0.001). Asterisk indicates the foveal confluence. **_B_**, Thresholded contrast maps for each individual subject (same color scheme as in **_A_**). _p_-thresholds were set at the levels used to define ROIs in the volume (color > achromatic, p < 0.001; faces > objects, p < 0.0001; scenes > objects, p < 0.0001). In each subject, color-biased activations were sandwiched between face-selective and place-selective regions, with face-selective regions lateral to color-biased cortex and place-selective cortex medial. Scale bars, 1 cm.
Figure 3.
Segregation of color preference and category selectivity in the ventral visual pathway. To quantify the response profiles of specific ROIs, category-selective (OFA, FFA, ATL, PPA) and color-biased (Pc, Cc, and Ac) ROIs were defined in each subject individually using data from even runs and the response magnitude of each region to each of the 10 conditions was quantified using the independent data from odd runs (A–F, H). For comparison, we also defined a region that responded preferentially to intact objects (defined by shape selectivity not category selectivity) that is adjacent to Pc and OFA (region LO, G) and a face-selective region (pSTS, I) on the lateral surface (as opposed to the ventral surface). ROIs were defined using a _p_-threshold criterion (for the OFA, FFA, ATL, PPA, pSTS, and LO, p < 0.0001; for the color-biased regions, p < 0.001). For each subject, an ROI's PSC was extracted by averaging β values across the voxels in the ROI and dividing by mean BOLD signal in the ROI. When a region appeared bilaterally, the PSC for the left hemisphere ROI was averaged with the PSC of the corresponding right hemisphere ROI for each condition. Bar plots show the average PSC across subjects for each ROI (error bars indicate within-subject SE). Participants who lacked a particular ROI were not included in the statistical analysis for that ROI. Cyan bars indicate chromatic conditions and gray bars indicate achromatic conditions (F, faces; B, bodies; S, scenes; O, objects; ScO, scrambled objects).
Figure 4.
Quantification of the color bias within color-biased ROIs and intervening tissue. A, Individual functional volumes (chromatic > achromatic) for two example subjects (displayed on CVS_35 group anatomical). Top row, sagittal sections through the right hemisphere; middle and bottom rows, horizontal sections at the planes indicated by the yellow lines in the sagittal sections (yellow lines in horizontal sections show the location of the sagittal section). B, Random-effects analysis (n = 13); other conventions as for A. C, Quantification of inhomogeneity along the posterior–anterior band of color activations. Two ROIs (schematic, black circles) spatially intermediate to the color-biased regions (white circles) were defined in each subject: iPCc (intermediate to Pc and Cc) and iCAc (intermediate to Cc and Ac). Bar plots show each region's mean percent signal change for chromatic stimuli (cyan bar) and achromatic stimuli (gray bar) (pooled across faces, bodies, scenes, objects, and scrambled objects) (error bars show within-subject SE). Color-biased regions (top row) were more color-biased than intermediate regions (bottom row) (_p_-values < 0.003, pairwise 3-way ANOVAs on ROI × color × stimulus class, each contrasting an intermediate region with one of its neighboring color-biased regions).
Figure 5.
Relationship of shape-biased regions to color-biased regions. A, Group overlap map; color scale reflects number of subjects that showed a significant preference for intact objects (O) over scrambled objects (ScO) (p_-threshold = 0.0001, n = 13 subjects). Light-blue outlines show color-biased regions (from Fig. 2_A); navy blue outlines show published group parcels for shape-selective regions LO and PFS (Julian et al., 2012). Most of the large swath of shape-biased cortex avoids color-biased cortex, except at the most anterior location. Scale bar, 1 cm. B, Bar charts quantifying the response of color-biased and shape-biased regions to chromatic (cyan bars) and achromatic (gray bars) intact objects (O) and scrambled objects (ScO). C, Scatter plot showing the extent of color bias and shape bias in color-biased regions (cyan triangles), shape regions (navy triangles), OFA, FFA, iPCc, and iCAc (gray triangles). Selectivity indices for shape and color bias were determined for each ROI using the data from B. Bias was computed as [PSCpreferred − PSCnon-preferred]/PSCpreferred + PSCnon-preferred]. For color bias, “preferred” is chromatic (intact and scrambled) and “nonpreferred” is achromatic (intact and scrambled). For shape bias, “preferred” is intact (chromatic and achromatic) and “nonpreferred” is scrambled (chromatic and achromatic). Error bars indicate 95% confidence interval (10,000 bootstrapped samples). Horizontal dashed line separates color-biased and shape-biased regions at a color-bias index of ∼0.1.
Figure 6.
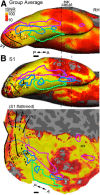
Signal coverage of the ventral surface. To compute the tSNR, the motion-corrected and smoothed (3 mm) functional volumes were high-pass filtered with a cutoff of 0.004 Hz to remove slow drifts; for each voxel, we then computed the mean of the time course divided by the SD of the time course. A, Mean tSNR map across the group of subjects (n = 13). ROIs and other conventions are as in Figure 2_A_. The tSNR in cortex near the ear canals is low. B, Example subject's tSNR map (S1); inflated view (top) and flattened view (bottom). Gray outline shows the representation of the central 2°s of the visual field. Cortex anterior to the anterior color-biased region has low tSNR (white asterisks).
Figure 7.
Comparison of responses to movie clips versus gratings. Color activity was measured using drifting equiluminant chromatic versus achromatic gratings. A, Comparison of color activations elicited by the movie clips (left) and the gratings (right) on the digitally flattened cortical surface (S5, right hemisphere; white outlines show the location of the color-biased activations localized using the movie clips). The gratings stimulus uncovered regions Pc and Cc, but failed to uncover Ac (black arrow). B, Quantification of the responses to movie clips (top) and gratings (bottom) (n = 3 subjects); cyan bars (chromatic conditions), gray (achromatic conditions). Functional ROIs (Pc, Cc, Ac, OFA, FFA, PPA) were defined with the movie clips; V1, V2, and MT+ were defined using an automatic parcellation (Freesurfer). Bars in the top graph were computed by averaging responses to all five categories.
Figure 8.
Responses to color and shape in monkeys measured using movie clips. We measured responses to the movie clips (Fig. 1_A_) in the two animals from an earlier report (Lafer-Sousa and Conway, 2013). Bar plots (top) show the percent signal change in the functional regions defined in that study: PLc, CLc, ALc, and ML. Cyan bars show responses to colored movie clips, and gray bars show responses to achromatic movie clips, either for intact objects (O) or scrambled objects (Sc) (compare with data obtained in humans, Fig. 5_B_). Scatter plot (bottom) shows color as a function of shape preference; conventions as in Figure 5_C_. The macaque color-biased regions responded similarly to the human color-biased regions; PLc and CLc showed a color bias but no shape preference, whereas ALc showed both a color bias and a shape bias. The macaque middle face patch ML showed a weak color bias and a strong shape bias. Horizontal dashed line separates shape-biased and color-biased regions (as in Figure 5).
Figure 9.
Comparison of the functional topography in monkey IT and human VVP suggests a broad homology. Reconstructed cortical surfaces showing the location of face (purple), color (blue), and place (green) ROIs for a macaque monkey (A) and a human (B). Top panels show pial surface views (lateral view in the monkey; ventral view in the human); bottom panels show digitally flattened surfaces exposing functional activation buried in the superior temporal sulcus (sts; prefrontal cortex is cut off). In both species, color-biased regions (in macaque, PLc, CLc, ALc; in human, Pc, Cc and Ac) are sandwiched between face-selective regions (in macaque, PL, ML, AL; in human, OFA, FFA1, FFA2) and place-selective regions (in macaque, mPPA, APP; in human PPA). Both species show evidence for an additional face-processing stream in the sts running parallel to the ventral pathway (in macaque, MF, AF; in human, pSTS, aSTS) (Yovel and Freiwald, 2013; Fisher and Freiwald, 2015). The region of cortex separating the two face-processing streams (white arrow) is relatively larger in humans; this tissue is implicated in communicative and social behaviors and expanded considerably during evolution (Orban et al., 2004; Hill et al., 2010; Chaplin et al., 2013), accounting for the ventral (and medial) displacement of the ventral visual pathway in humans. Macaque data are from Lafer-Sousa and Conway (2013) and Verhoef et al. (2015).
Similar articles
- Neural representations of faces and body parts in macaque and human cortex: a comparative FMRI study.
Pinsk MA, Arcaro M, Weiner KS, Kalkus JF, Inati SJ, Gross CG, Kastner S. Pinsk MA, et al. J Neurophysiol. 2009 May;101(5):2581-600. doi: 10.1152/jn.91198.2008. Epub 2009 Feb 18. J Neurophysiol. 2009. PMID: 19225169 Free PMC article. - Functional architecture for disparity in macaque inferior temporal cortex and its relationship to the architecture for faces, color, scenes, and visual field.
Verhoef BE, Bohon KS, Conway BR. Verhoef BE, et al. J Neurosci. 2015 Apr 29;35(17):6952-68. doi: 10.1523/JNEUROSCI.5079-14.2015. J Neurosci. 2015. PMID: 25926470 Free PMC article. - The Contribution of Object Shape and Surface Properties to Object Ensemble Representation in Anterior-medial Ventral Visual Cortex.
Cant JS, Xu Y. Cant JS, et al. J Cogn Neurosci. 2017 Feb;29(2):398-412. doi: 10.1162/jocn_a_01050. Epub 2016 Sep 27. J Cogn Neurosci. 2017. PMID: 27676614 - [Visual Processing in the Ventral Pathway: Shape, Face, Color, Material Properties, and Stereoscopic Depth].
Inagaki M, Fujita I. Inagaki M, et al. Brain Nerve. 2016 Nov;68(11):1363-1370. doi: 10.11477/mf.1416200599. Brain Nerve. 2016. PMID: 27852026 Review. Japanese. - Division of labor between lateral and ventral extrastriate representations of faces, bodies, and objects.
Taylor JC, Downing PE. Taylor JC, et al. J Cogn Neurosci. 2011 Dec;23(12):4122-37. doi: 10.1162/jocn_a_00091. Epub 2011 Jul 7. J Cogn Neurosci. 2011. PMID: 21736460 Review.
Cited by
- The neural code for "face cells" is not face-specific.
Vinken K, Prince JS, Konkle T, Livingstone MS. Vinken K, et al. Sci Adv. 2023 Sep;9(35):eadg1736. doi: 10.1126/sciadv.adg1736. Epub 2023 Aug 30. Sci Adv. 2023. PMID: 37647400 Free PMC article. - Color Tuning of Face-Selective Neurons in Macaque Inferior Temporal Cortex.
Duyck M, Chang ALY, Gruen TJ, Tello LY, Eastman S, Fuller-Deets J, Conway BR. Duyck M, et al. eNeuro. 2021 Apr 12;8(2):ENEURO.0395-20.2020. doi: 10.1523/ENEURO.0395-20.2020. Print 2021 Mar-Apr. eNeuro. 2021. PMID: 33483324 Free PMC article. - Face pareidolia minimally engages macaque face selective neurons.
Koyano KW, Taubert J, Robison W, Waidmann EN, Leopold DA. Koyano KW, et al. Prog Neurobiol. 2025 Feb;245:102709. doi: 10.1016/j.pneurobio.2024.102709. Epub 2025 Jan 2. Prog Neurobiol. 2025. PMID: 39755201 - Visual recognition in rhesus monkeys requires area TE but not TEO.
Eldridge MAG, Pearl JE, Fomani GP, Masseau EC, Fredericks JM, Chen G, Richmond BJ. Eldridge MAG, et al. Cereb Cortex. 2023 Mar 10;33(6):3098-3106. doi: 10.1093/cercor/bhac263. Cereb Cortex. 2023. PMID: 35770336 Free PMC article. - Facephenes and rainbows: Causal evidence for functional and anatomical specificity of face and color processing in the human brain.
Schalk G, Kapeller C, Guger C, Ogawa H, Hiroshima S, Lafer-Sousa R, Saygin ZM, Kamada K, Kanwisher N. Schalk G, et al. Proc Natl Acad Sci U S A. 2017 Nov 14;114(46):12285-12290. doi: 10.1073/pnas.1713447114. Epub 2017 Oct 30. Proc Natl Acad Sci U S A. 2017. PMID: 29087337 Free PMC article.
References
- Balas B, Sinha P. “Filling-in” colour in natural scenes. Vis Cogn. 2007:765–778. doi: 10.1080/13506280701295453. - DOI
- Bartels A, Zeki S. The architecture of the colour centre in the human visual brain: new results and a review. Eur J Neurosci. 2000;12:172–193. - PubMed
- Bloj MG, Kersten D, Hurlbert AC. Perception of three-dimensional shape influences colour perception through mutual illumination. Nature. 1999;402:877–879. - PubMed
Publication types
MeSH terms
Grants and funding
- EY023322/EY/NEI NIH HHS/United States
- 5T32GM007484-38/GM/NIGMS NIH HHS/United States
- T32 GM007484/GM/NIGMS NIH HHS/United States
- S10 RR021110/RR/NCRR NIH HHS/United States
- R01 EY023322/EY/NEI NIH HHS/United States
- P41EB015896/EB/NIBIB NIH HHS/United States
- EY13455/EY/NEI NIH HHS/United States
- R01 EY013455/EY/NEI NIH HHS/United States
- P41 EB015896/EB/NIBIB NIH HHS/United States
LinkOut - more resources
Full Text Sources
Other Literature Sources


