The Hepatitis C Virus-Induced Membranous Web and Associated Nuclear Transport Machinery Limit Access of Pattern Recognition Receptors to Viral Replication Sites - PubMed (original) (raw)
The Hepatitis C Virus-Induced Membranous Web and Associated Nuclear Transport Machinery Limit Access of Pattern Recognition Receptors to Viral Replication Sites
Christopher J Neufeldt et al. PLoS Pathog. 2016.
Abstract
Hepatitis C virus (HCV) is a positive-strand RNA virus of the Flaviviridae family and a major cause of liver disease worldwide. HCV replicates in the cytoplasm, and the synthesis of viral proteins induces extensive rearrangements of host cell membranes producing structures, collectively termed the membranous web (MW). The MW contains the sites of viral replication and assembly, and we have identified distinct membrane fractions derived from HCV-infected cells that contain replication and assembly complexes enriched for viral RNA and infectious virus, respectively. The complex membrane structure of the MW is thought to protect the viral genome limiting its interactions with cytoplasmic pattern recognition receptors (PRRs) and thereby preventing activation of cellular innate immune responses. Here we show that PRRs, including RIG-I and MDA5, and ribosomes are excluded from viral replication and assembly centers within the MW. Furthermore, we present evidence that components of the nuclear transport machinery regulate access of proteins to MW compartments. We show that the restricted assess of RIG-I to the MW can be overcome by the addition of a nuclear localization signal sequence, and that expression of a NLS-RIG-I construct leads to increased immune activation and the inhibition of viral replication.
Conflict of interest statement
The authors have declared that no competing interests exist.
Figures
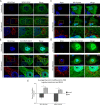
Fig 1. Exclusion of RLRs from cytoplasmic regions enriched for HCV proteins.
Uninfected and HCV-infected Huh7.5 cells were transfected with constructs encoding for FLAG-tagged RIG-I (A), V5-tagged MDA5 (B), or FLAG-tagged RIG-I-K270A (C) 2 days after HCV infection. On day 4 after infection, the localization of HCV proteins and RLRs in uninfected and HCV-infected cells was evaluated by indirect immunofluorescence confocal microscopy using antibodies specific for the indicated HCV protein or double-strand viral RNA and either the V5 or FLAG epitope tag. DNA was detected with DAPI (blue) and scale bars represent 5 μm. Pearson’s correlation coefficients shown in the merge images of HCV-infected cells in panels A and B were calculated using Coloc2 software in ImageJ and represent overlap between the red and green fluorescent channels in the indicated image.
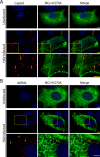
Fig 2. Exclusion of RLRs from cytoplasmic regions enriched for HAV proteins.
A and B) Uninfected and HAV-infected Huh7.5 cells were transfected 5 days after viral infection with constructs encoding the catalytically inactive FLAG-tagged RIG-I-K270A. On day 7 after HAV infection, the localization of RIG-I-K270A (green) and either HAV capsid protein (red, panel A) or dsRNA (red, panel B) were evaluated by indirect immunofluorescence confocal microscopy using specific antibodies. DNA was stained with DAPI (blue) and scale bars represent 5 μm. Arrows point to regions of the cytoplasm that contain capsid proteins or dsRNA but lack RIG-I-K270A signal and the boxes in the middle panels represent the area of magnification in the bottom panels.
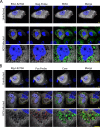
Fig 3. Exclusion of RIG-I from compartments containing plus-strand and minus-strand HCV RNA.
A and B) Uninfected and HCV-infected Huh7.5 cells were transfected with constructs encoding for FLAG-tagged RIG-I-K207A 2 days after HCV infection. On day 4 after infection, cells were probed with antibodies directed against the FLAG epitope (grey) and either HCV core or NS5A (green). DNA probes (Affymetrix) targeted to either the positive-strand or the negative-strand of the HCV RNA (red) were then hybridized to the viral RNA. DNA was stained with DAPI (blue) and cells were examined by confocal fluorescence microscopy. Boxed regions in the middle row of both panels outline the area of magnification presented in the bottom rows. Scale bars represent 5 μm.
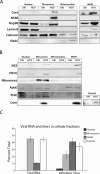
Fig 4. HCV proteins are associated with physically distinct membrane fractions in infected cells.
A-C) Total cell lysates isolated from uninfected (UN) or HCV-infected (HCV) Huh7.5 cells were subjected to subcellular fractionation. A and B) Western blotting with antibodies specific for the indicated proteins was used to evaluate their relative amounts in various subcellular membrane fractions. Indicated above the blot image are membrane species predicted to reside in the fractions analyzed. Equal amounts of total protein were loaded into each lane. All samples were run on the same gel and images shown are derived from the same membrane. For the core cytosolic blot (B, bottom right) exposure levels were increased 4 fold in order to observe the signal. C) The total HCV RNA present in the nuclear, microsomal, MAM, or cytosolic fractions analyzed in panel A was determined by qPCR. The number of infectious HCV particles in these same fractions was determined by infecting Huh7.5 cells with a portion of the sample from each fraction followed by counting focus-forming units identified using indirect immunofluorescence microscopy and antibodies directed against HCV core protein.
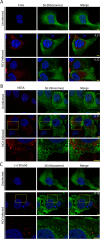
Fig 5. Exclusion of ribosomes from viral replication compartments.
A) Huh7.5 cells were untreated or infected with HCV for four days. The localization of the 40S ribosomal subunit protein S6 (green), HCV core protein (panel A, red), HCV NS5A protein (panel B, red), or positive-strand HCV RNA (panel C, red) in cells was evaluated by indirect immunofluorescence confocal microscopy using specific antibodies. DNA was stained with DAPI (blue). Pearson’s correlation coefficients shown in the merge images of HCV-infected cells were calculated using Coloc2 software in ImageJ and represent overlap between the red and green fluorescent channels in the indicated image. For panels B and C, the boxed regions in the middle row of both panels outline the area of magnification presented in the bottom rows. Scale bars represent 5 μm.
Fig 6. NLS-tagged RIG-I and MDA5 colocalize with HCV proteins.
A and B) Uninfected and HCV-infected Huh7.5 cells were transfected with constructs encoding either V5-tagged MDA5-I923V (A) or V5-tagged NLS-MDA5-I923V (B) 2 days after HCV infection. On day 4 after infection, the localization of HCV NS5A protein (red) was compared to that of MDA5-I923V or NLS-MDA5-I923V (green) using antibodies specific for the HCV NS5A and the V5 epitope tag and indirect immunofluorescence microscopy. DNA was stained with DAPI (blue). Boxed regions in the middle row of both panels outline the area of magnification presented in the bottom rows. Scale bars represent 5 μm. C and D) Uninfected or HCV-infected Huh7.5 cells were transfected with constructs encoding for either GFP-tagged RIG-I-K270A (C) or GFP-tagged NLS-RIG-I-K270A (D) 2 days after HCV infection. On day 4 after infection, the localization of HCV NS5A protein (red) was compared to that of GFP-tagged RIG-I-K270A or NLS-RIG-I-K270A (green). NS5A was detected using specific antibodies and indirect immunofluorescence and the GFP fusions were visualized directly using fluorescence confocal microscopy. DNA was stained with DAPI (blue). Boxed regions in the middle row of both panels outline the area of magnification presented in the bottom rows. Scale bars represent 5 μm. For all image panels, Pearson’s correlation coefficients shown in the merge images of HCV-infected cells were calculated using Coloc2 software in ImageJ and represent overlap between the red and green fluorescent channels in the indicated image. E) Pearson’s correlation coefficients were determined to assess overlap of HCV NS5SA and either GFP or V5 fluorescence signals in confocal sections derived from HCV-infected cells expressing GFP-tagged RIG-I-K270A, GFP-tagged NLS-RIG-I-K270A, V5-tagged MDA5-I923V or V5-tagged NLS-MDA5-I923V. The values presented represent an average over 10 images (> 15 cells) and the error bars indicate standard error. Significance was evaluated using t-tests comparing and p-values less than 0.05 (*) are indicated.
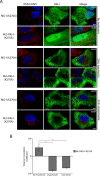
Fig 7. Inhibition of NLS-importin α/β transport limit access of NLS-tagged RIG-I to the MW.
A and B) HCV-infected Huh7.5 cells were transfected with constructs encoding for either GFP-tagged RIG-I-K270A or GFP-tagged NLS-RIG-I-K270A 2 days after HCV infection. On day 4 after infection, cells were treated with 25 μM ivermectin or 40 μM importazole for 4 hours and then examined. A) HCV NS5A was detected using specific antibodies and indirect immunofluorescence and the GFP fusions were visualized directly using fluorescence confocal microscopy. DNA was stained with DAPI (blue). Boxed regions in the middle row of both panels outline the area of magnification presented in the bottom rows. Scale bars represent 5 μm. Pearson’s correlation coefficients shown in the merge images of HCV-infected cells were calculated using Coloc2 software in ImageJ and represent overlap between the red and green fluorescent channels in the indicated image. B) Pearson’s correlation coefficients were determined to assess overlap of HCV NS5SA and GFP signals in confocal images derived from HCV-infected cells expressing the indicated RIG construct. The values presented represent an average over 10 images (at least 15 cells) and the error bars indicate standard error. Significance was evaluated using t-tests and p-values less than 0.05 (*) are indicated.
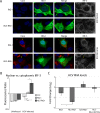
Fig 8. NLS-tagged RIG-I stimulates immune responses and decreased viral RNA levels in HCV-infected cells.
A and B) Uninfected or HCV-infected Huh7.5 cells were transfected with constructs encoding either GFP-tagged RIG-I or GFP-tagged NLS-RIG-I 2 days after HCV infection. On day 4 after infection, the localization of IRF-3 (grey) was examined using specific antibodies and indirect immunofluorescence and the GFP fusions (green) were visualized directly using fluorescence confocal microscopy. In addition, to identify HCV-infected cells amongst those expressing the RIG-I constructs, cells were stained with antibodies directed against the HCV core protein (red). DNA was stained with DAPI (blue) and scale bars represent 5 μm. B) The ratio of nuclear to cytoplasmic fluorescence signal arising from IRF-3 indirect immunofluorescence was calculated using ImageJ for > 30 uninfected or HCV-infected cells alone or expressing either GFP-tagged RIG-I or GFP-tagged NLS-RIG-I. Significance was evaluated using t-tests and p-values less than 0.05 (*), 0.01 (**) or 0.001 (*) are indicated. C) Uninfected and HCV-infected Huh7.5 cells were transfected with constructs encoding for GFP-RIG-I, GFP-NLS-RIG-I, GFP-SLN-RIG-I, or GFP-NLS-RIG-I-K270A 1 day after HCV infection. 3 days after infection, cells were harvested and levels of intracellular HCV RNA were determined by qPCR. Fold change of intracellular HCV RNA was calculated relative to HCV-infected cells transfected with constructs encoding for GFP alone.
Similar articles
- Functional characterization of nuclear localization and export signals in hepatitis C virus proteins and their role in the membranous web.
Levin A, Neufeldt CJ, Pang D, Wilson K, Loewen-Dobler D, Joyce MA, Wozniak RW, Tyrrell DL. Levin A, et al. PLoS One. 2014 Dec 8;9(12):e114629. doi: 10.1371/journal.pone.0114629. eCollection 2014. PLoS One. 2014. PMID: 25485706 Free PMC article. - Hepatitis C virus-induced cytoplasmic organelles use the nuclear transport machinery to establish an environment conducive to virus replication.
Neufeldt CJ, Joyce MA, Levin A, Steenbergen RH, Pang D, Shields J, Tyrrell DL, Wozniak RW. Neufeldt CJ, et al. PLoS Pathog. 2013 Oct;9(10):e1003744. doi: 10.1371/journal.ppat.1003744. Epub 2013 Oct 31. PLoS Pathog. 2013. PMID: 24204278 Free PMC article. - Mechanisms of Cellular Membrane Reorganization to Support Hepatitis C Virus Replication.
Wang H, Tai AW. Wang H, et al. Viruses. 2016 May 20;8(5):142. doi: 10.3390/v8050142. Viruses. 2016. PMID: 27213428 Free PMC article. Review. - Ultrastructural and biochemical analyses of hepatitis C virus-associated host cell membranes.
Ferraris P, Blanchard E, Roingeard P. Ferraris P, et al. J Gen Virol. 2010 Sep;91(Pt 9):2230-7. doi: 10.1099/vir.0.022186-0. Epub 2010 May 19. J Gen Virol. 2010. PMID: 20484561 - Cellular and molecular biology of HCV infection and hepatitis.
Tang H, Grisé H. Tang H, et al. Clin Sci (Lond). 2009 Jun 15;117(2):49-65. doi: 10.1042/CS20080631. Clin Sci (Lond). 2009. PMID: 19515018 Review.
Cited by
- Classification, replication, and transcription of Nidovirales.
Liao Y, Wang H, Liao H, Sun Y, Tan L, Song C, Qiu X, Ding C. Liao Y, et al. Front Microbiol. 2024 Jan 24;14:1291761. doi: 10.3389/fmicb.2023.1291761. eCollection 2023. Front Microbiol. 2024. PMID: 38328580 Free PMC article. Review. - Escaping Host Factor PI4KB Inhibition: Enterovirus Genomic RNA Replication in the Absence of Replication Organelles.
Melia CE, van der Schaar HM, Lyoo H, Limpens RWAL, Feng Q, Wahedi M, Overheul GJ, van Rij RP, Snijder EJ, Koster AJ, Bárcena M, van Kuppeveld FJM. Melia CE, et al. Cell Rep. 2017 Oct 17;21(3):587-599. doi: 10.1016/j.celrep.2017.09.068. Cell Rep. 2017. PMID: 29045829 Free PMC article. - Determination of host proteins composing the microenvironment of coronavirus replicase complexes by proximity-labeling.
V'kovski P, Gerber M, Kelly J, Pfaender S, Ebert N, Braga Lagache S, Simillion C, Portmann J, Stalder H, Gaschen V, Bruggmann R, Stoffel MH, Heller M, Dijkman R, Thiel V. V'kovski P, et al. Elife. 2019 Jan 11;8:e42037. doi: 10.7554/eLife.42037. Elife. 2019. PMID: 30632963 Free PMC article. - miR-122 does not impact recognition of the HCV genome by innate sensors of RNA but rather protects the 5' end from the cellular pyrophosphatases, DOM3Z and DUSP11.
Amador-Cañizares Y, Bernier A, Wilson JA, Sagan SM. Amador-Cañizares Y, et al. Nucleic Acids Res. 2018 Jun 1;46(10):5139-5158. doi: 10.1093/nar/gky273. Nucleic Acids Res. 2018. PMID: 29672716 Free PMC article. - Viral rewiring of cellular lipid metabolism to create membranous replication compartments.
Strating JR, van Kuppeveld FJ. Strating JR, et al. Curr Opin Cell Biol. 2017 Aug;47:24-33. doi: 10.1016/j.ceb.2017.02.005. Epub 2017 Feb 24. Curr Opin Cell Biol. 2017. PMID: 28242560 Free PMC article. Review.
References
- Wasley A, Alter MJ. Epidemiology of hepatitis C: geographic differences and temporal trends. Semin Liver Dis. 2000;20(1):1–16. Epub 2000/07/15. . - PubMed
Publication types
MeSH terms
Substances
Grants and funding
- MOP 126142/Canadian Institutes of Health Research/Canada
- U19 AI083019/AI/NIAID NIH HHS/United States
- R01 AI118916/AI/NIAID NIH HHS/United States
- MOP 106502/Canadian Institutes of Health Research/Canada
- U19 AI109662/AI/NIAID NIH HHS/United States
LinkOut - more resources
Full Text Sources
Other Literature Sources

