The cellular composition of the human immune system is shaped by age and cohabitation - PubMed (original) (raw)
. 2016 Apr;17(4):461-468.
doi: 10.1038/ni.3371. Epub 2016 Feb 15.
Affiliations
- PMID: 26878114
- PMCID: PMC4890679
- DOI: 10.1038/ni.3371
The cellular composition of the human immune system is shaped by age and cohabitation
Edward J Carr et al. Nat Immunol. 2016 Apr.
Erratum in
- Author Correction: The cellular composition of the human immune system is shaped by age and cohabitation.
Carr EJ, Dooley J, Garcia-Perez JE, Lagou V, Lee JC, Wouters C, Meyts I, Goris A, Boeckxstaens G, Linterman MA, Liston A. Carr EJ, et al. Nat Immunol. 2021 Feb;22(2):254. doi: 10.1038/s41590-020-00839-4. Nat Immunol. 2021. PMID: 33239822 No abstract available.
Abstract
Detailed population-level description of the human immune system has recently become achievable. We used a 'systems-level' approach to establish a resource of cellular immune profiles of 670 healthy individuals. We report a high level of interindividual variation, with low longitudinal variation, at the level of cellular subset composition of the immune system. Despite the profound effects of antigen exposure on individual antigen-specific clones, the cellular subset structure proved highly elastic, with transient vaccination-induced changes followed by a return to the individual's unique baseline. Notably, the largest influence on immunological variation identified was cohabitation, with 50% less immunological variation between individuals who share an environment (as parents) than between people in the wider population. These results identify local environmental conditions as a key factor in shaping the human immune system.
Figures
Figure 1
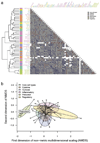
Data-driven analysis of immunological variation reveals biologically meaningful co-correlations between individual immune parameters. (a) On the complete dataset of 638 individuals (most recent sample only), a dendrogram of immune parameters was generated by hierarchical clustering on Euclidean distances of Spearman correlations between each parameter (left). Correlation plots using pairwise Spearman correlation coefficients between each two immunological parameters are shown (right). Coefficients are shown by the angle of eclipse (left-leaning, negative; right-leaning, positive) and colour (blue, negative; red, positive). Manually annotated thematic groups of immune parameters are shown by the colour bar next to the dendrogram. **(b)**Non-metric multidimensional scaling of pairwise Spearman correlations. The dataset is reduced from 54 immune parameters (54 dimensions) to a 2 dimensional representation, an exploratory approach to investigate the presence or absence of inter-relatedness between immune parameters. Each immune parameter is a point and the thematic groups are highlighted.
Figure 2
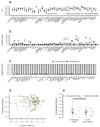
The human immune system is robustly maintained in multiple stable equilibriums. 177 individuals were sampled at least twice, allowing a dissection of inter- versus intra-individual variation. (a) Linear models were made for each immune parameter based on the multiple samples from each individual (ANOVA model: immune parameter ~ subject identifier + visit number). Open circles represent models built using all individuals (_n_=638) with multiple visits (177 individuals with up to 3 repeat visits; 921 visits in total). The filled circles represent models using only individuals who were continuously healthy between visits (152 individuals), filled squares represent models using only individuals who experienced acute gastroenteritis between their samples (24 individuals). For each cohort, R2_values and (b) -log10 of Bonferroni adjusted_P values are shown for the linear models. **(c)**Proportion of the R2 values from all volunteers attributable to either inter-individual differences or intra-individual differences. (d) Multidimensional scaling of the pre- and post-travel study visits. Each individual is represented twice; their first and second visits depicted with a dot or diamond respectively and linked by a grey line indicating immunological distance (50 individuals; 100 visits). Continuously healthy individuals (_n_=26) are shown in aqua, individuals with intervening acute gastroenteritis (_n_=24) are shown in orange. (e) Quantification of the immunological distance between the first and second visits for continuously healthy individuals (_n_=26) versus individuals with intervening acute gastroenteritis (_n_=24). A two-tailed Mann-Whitney test was used to compare the immunological distances.
Figure 3
Immunologial equilibria demonstrate elasticity following influenza vaccination. In a parallel cohort of 32 English individuals, volunteers were sampled prior to vaccination, with follow-up samples at day 7 and day 42 post-vaccination.(a) Samples were phenotyped, normalised to the day 0 value and assessed for change using paired t-tests. Unchanged variables are shown in grey, significantly modified variables are shown in red, with (b)boxplots for each significant immune parameter. Each parameter is labeled on the graph with an (uncorrected, two tailed) paired t-test P value. Boxes show median and interquartile ranges (IQRs), whiskers extend to 1.5 x IQR.(c) A linear model was made for each immune parameter based on the multiple samples from each individual (ANOVA model: immune parameter ~ subject identifier + visit number). For each parameter the proportion of the R2 values from all volunteers attributable to either inter-individual differences or intra-individual differences was assessed for day 0 and 7 or (d) day 0 and 42. **(e)**Multidimensional scaling of the vaccination time-points. Each individual is represented at day 0 (green), 7 (red) and 42 (blue) and linked by a grey line indicating immunological distance (32 individuals; 96 visits). (f)Quantification of the immunological distance between day 0 and 7, 7 and 42, and 0 and 42 for each volunteer (_n_=32), with paired t-test.(g) For each volunteer, a Z-score was calculated for each parameter at day 0 and 42, indicating standard deviations from the mean value. Correlation analysis indicates the line of best fit. *, p<0.001; **,p<0.0001.
Figure 4
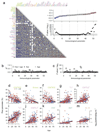
Age is a major determinant of immunological equilibria. (a) Each immune parameter was correlated with age and each other immune parameter using pairwise Spearman r values. The arrangement of the immune parameters is determined by their correlation with age. Inset panels show Spearman’s r (upper) and -log10 Bonferroni corrected P values (lower) plotted against age.(b) R2 for each immune parameter for models incorporating gender (filled circles), age (grey squares) or both gender and age (open circles) as the independent variable(s), with (c)accompanying -log10 of Bonferroni corrected _P_values. (d) to (m) Individual scatterplots for each of the immune parameters with significant association with age. The percentage values of the flow parameters, or log10 cytokine concentrations, are plotted against age, with women in red, men in blue and linear regression lines for the whole cohort in black. Data shown for (d) CD4+RTE (p=3x10-18), (e) transitional B cells (p=8x10⁻⁷), (f) CD8+ RTE (p=1x10⁻⁸), (g) TH1 (p=3x10-20), (h) CD4+ IL-2+ T cells (p=5x10-23), (i) Tc1 (p=5x10-31),(j) CD8+ IL-2+ T cells (p=8x10-33), (k) CD8+ T cells (p=8x10-11) (l) _i_NKT cells (p=6x10⁻¹⁰) and (m) serum IL-6 (p=7x10-11).
Figure 5
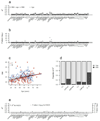
Immunoprofile is not influenced by BMI, depression, or anxiety. (a) R2 for each immune parameter for models incorporating BMI (filled circles; 213 individuals), age (filled squares; 367 individuals) or both BMI and age (open circles; 213 individuals) as the independent variable(s), with (b) accompanying -log10 of Bonferroni corrected P values. Analysis excluded children (<18 years). (c) Relationship between BMI and age in the analysed cohort. (d) The relative _R2_contributions of age and BMI to immune parameters that were significant in a model including both BMI and age (adjusted P<0.05).(e) R2 and -log10 adjusted _P_values for each immune parameter for a model incorporating HADS anxiety score and HADS depression score (235 individuals).
Figure 6
Parenthood shapes the immune system towards a shared equilibria. **(a)**140 individuals were identified as adult (18-65 years) biological parents with a child still living at home. The immune profile (54 parameters) was compressed using multidimensional scaling (k=2) of the correlation matrix between individuals, visualising pairwise Spearman’s correlation coefficients between each individual. The immunological distance between each male:female pair is indicated by the connecting gray line. (b) The immunological distance, as measured by multidimensional scaling, between parental pairs versus random male:female pairs. To generate the random distribution, each male was computationally paired in a random fashion with 5 females from the parental dataset. Distributions were compared using a two-tailed Mann-Whitney test. *, p=8x10-11.
Similar articles
- Impact of ageing and a synbiotic on the immune response to seasonal influenza vaccination; a randomised controlled trial.
Enani S, Przemska-Kosicka A, Childs CE, Maidens C, Dong H, Conterno L, Tuohy K, Todd S, Gosney M, Yaqoob P. Enani S, et al. Clin Nutr. 2018 Apr;37(2):443-451. doi: 10.1016/j.clnu.2017.01.011. Epub 2017 Jan 28. Clin Nutr. 2018. PMID: 28215759 Free PMC article. Clinical Trial. - Continuous immunotypes describe human immune variation and predict diverse responses.
Kaczorowski KJ, Shekhar K, Nkulikiyimfura D, Dekker CL, Maecker H, Davis MM, Chakraborty AK, Brodin P. Kaczorowski KJ, et al. Proc Natl Acad Sci U S A. 2017 Jul 25;114(30):E6097-E6106. doi: 10.1073/pnas.1705065114. Epub 2017 Jul 10. Proc Natl Acad Sci U S A. 2017. PMID: 28696306 Free PMC article. - Impact of aging and HIV infection on serologic response to seasonal influenza vaccination.
Pallikkuth S, De Armas LR, Pahwa R, Rinaldi S, George VK, Sanchez CM, Pan L, Dickinson G, Rodriguez A, Fischl M, Alcaide M, Pahwa S. Pallikkuth S, et al. AIDS. 2018 Jun 1;32(9):1085-1094. doi: 10.1097/QAD.0000000000001774. AIDS. 2018. PMID: 29424779 Free PMC article. - Vaccine-induced antibody responses as parameters of the influence of endogenous and environmental factors.
Van Loveren H, Van Amsterdam JG, Vandebriel RJ, Kimman TG, Rümke HC, Steerenberg PS, Vos JG. Van Loveren H, et al. Environ Health Perspect. 2001 Aug;109(8):757-64. doi: 10.1289/ehp.01109757. Environ Health Perspect. 2001. PMID: 11564609 Free PMC article. Review. - Aging and impaired immunity to influenza viruses: implications for vaccine development.
Liu WM, van der Zeijst BA, Boog CJ, Soethout EC. Liu WM, et al. Hum Vaccin. 2011 Jan-Feb;7 Suppl:94-8. doi: 10.4161/hv.7.0.14568. Epub 2011 Jan 1. Hum Vaccin. 2011. PMID: 21301210 Review.
Cited by
- Coordinated expression of tyro3, axl, and mer receptors in macrophage ontogeny.
Malawista A, Wang X, Trentalange M, Allore HG, Montgomery RR. Malawista A, et al. Macrophage (Houst). 2016;3:e1261. doi: 10.14800/macrophage.1261. Epub 2016 Apr 22. Macrophage (Houst). 2016. PMID: 27695708 Free PMC article. - Similarities and Differences Between Juvenile and Adult Spondyloarthropathies.
Fisher C, Ciurtin C, Leandro M, Sen D, Wedderburn LR. Fisher C, et al. Front Med (Lausanne). 2021 May 31;8:681621. doi: 10.3389/fmed.2021.681621. eCollection 2021. Front Med (Lausanne). 2021. PMID: 34136509 Free PMC article. Review. - Aging promotes reorganization of the CD4 T cell landscape toward extreme regulatory and effector phenotypes.
Elyahu Y, Hekselman I, Eizenberg-Magar I, Berner O, Strominger I, Schiller M, Mittal K, Nemirovsky A, Eremenko E, Vital A, Simonovsky E, Chalifa-Caspi V, Friedman N, Yeger-Lotem E, Monsonego A. Elyahu Y, et al. Sci Adv. 2019 Aug 21;5(8):eaaw8330. doi: 10.1126/sciadv.aaw8330. eCollection 2019 Aug. Sci Adv. 2019. PMID: 31457092 Free PMC article. - Germline genetic host factors as predictive biomarkers in immuno-oncology.
Chat V, Ferguson R, Kirchhoff T. Chat V, et al. Immunooncol Technol. 2019 Sep 5;2:14-21. doi: 10.1016/j.iotech.2019.08.001. eCollection 2019 Sep. Immunooncol Technol. 2019. PMID: 35756849 Free PMC article. Review. - Booster Immunization Improves Memory B Cell Responses in Older Adults Unresponsive to Primary SARS-CoV-2 Immunization.
Verheul MK, Nijhof KH, de Zeeuw-Brouwer ML, Duijm G, Ten Hulscher H, de Rond L, Beckers L, Eggink D, van Tol S, Reimerink J, Boer M, van Beek J, Rots N, van Binnendijk R, Buisman AM. Verheul MK, et al. Vaccines (Basel). 2023 Jul 4;11(7):1196. doi: 10.3390/vaccines11071196. Vaccines (Basel). 2023. PMID: 37515012 Free PMC article.
References
- De Jager PL, Hacohen N, Mathis D, Regev A, Stranger BE, Benoist C. ImmVar project: Insights and design considerations for future studies of “healthy” immune variation. Semin Immunol. 2015 - PubMed
Publication types
MeSH terms
Substances
Grants and funding
- BBS/E/B/000C0407/BB_/Biotechnology and Biological Sciences Research Council/United Kingdom
- WT_/Wellcome Trust/United Kingdom
- 637801/ERC_/European Research Council/International
- 105920/Z/14/Z/WT_/Wellcome Trust/United Kingdom
- BBS/E/B/000C0409/BB_/Biotechnology and Biological Sciences Research Council/United Kingdom
LinkOut - more resources
Full Text Sources
Other Literature Sources
Medical


