Stiffening hydrogels for investigating the dynamics of hepatic stellate cell mechanotransduction during myofibroblast activation - PubMed (original) (raw)
Stiffening hydrogels for investigating the dynamics of hepatic stellate cell mechanotransduction during myofibroblast activation
Steven R Caliari et al. Sci Rep. 2016.
Abstract
Tissue fibrosis contributes to nearly half of all deaths in the developed world and is characterized by progressive matrix stiffening. Despite this, nearly all in vitro disease models are mechanically static. Here, we used visible light-mediated stiffening hydrogels to investigate cell mechanotransduction in a disease-relevant system. Primary hepatic stellate cell-seeded hydrogels stiffened in situ at later time points (following a recovery phase post-isolation) displayed accelerated signaling kinetics of both early (Yes-associated protein/Transcriptional coactivator with PDZ-binding motif, YAP/TAZ) and late (alpha-smooth muscle actin, α-SMA) markers of myofibroblast differentiation, resulting in a time course similar to observed in vivo activation dynamics. We further validated this system by showing that α-SMA inhibition following substrate stiffening resulted in attenuated stellate cell activation, with reduced YAP/TAZ nuclear shuttling and traction force generation. Together, these data suggest that stiffening hydrogels may be more faithful models for studying myofibroblast activation than static substrates and could inform the development of disease therapeutics.
Figures
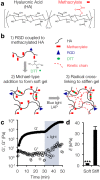
Figure 1. Visible-light mediated stiffening of MeHA gels.
(a) Hyaluronic acid was modified with methacrylates to enable both addition and radical crosslinking. (b) RGD-containing peptide was coupled to MeHA followed by an initial Michael-type addition reaction to form a soft gel. Radical polymerization in the presence of visible blue light and the photoinitiator LAP enabled substrate stiffening. (c) Rheology profile showing stiffening of MeHA in response to blue light (3 mW/cm2, 15 min, shaded) in the presence of LAP (6.6 mM). Closed circles represent storage modulus (G’), open circles represent loss modulus (G”). (d) AFM measurements of both soft and stiff (blue light: 10 mW/cm2, 5 min, LAP: 6.6 mM) hydrogel elastic moduli (n = 3 gels per group, error bars represent s.e.m.). ***P < 0.001.
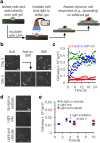
Figure 2. Hepatic stellate cells spread and assume myofibroblast morphology in response to in situ stiffening.
(a) Schematic of in situ stiffening process. (b) Phase contrast images of stellate cells on soft and stiff static substrates, as well as a dynamically stiffened soft-to-stiff substrate (in situ stiffening performed on day 4). Scale bars: 50 μm. (c) Representative stellate cell spread area quantification over 24 h time lapse following in situ stiffening on day 4 (n = 3 cells per group, each shape represents a single cell whose spread area was monitored every 15 min). Spread areas are relatively constant in soft and stiff static groups, but increase steadily in soft-to-stiff group, especially during the first 12 h. (d) To ensure that stellate cells were spreading in response to stiffness and not free radical generation, soft MeHA gels were fabricated where the remaining methacrylates were capped with a thiol, so that in the presence of light and initiator free radicals would be generated but no secondary crosslinking (stiffening) would occur. Representative phase contrast images showed no differences in cell spread areas between groups. Scale bars: 50 μm. (e) Quantification of cell area confirmed no differences in spread area between groups (n > 22 cells per group per time point, error bars represent s.e.m.).
Figure 3. Delayed stiffening promotes more rapid YAP/TAZ nuclear translocation and α-SMA stress fiber assembly.
(a) Schematic of experimental design. (b) Quantification of stellate cell spread area (n > 12 cells per group), (c) YAP/TAZ nuclear to cytoplasmic intensity ratio (n > 29 cells per group), (d) cell fraction displaying organized α-SMA stress fibers (n > 20 cells per group), (e) and cell fraction displaying organized F-actin stress fibers (n > 20 cells per group) 1, 6, 24, or 72 h following either early (Day 1) or later (Day 6) stiffening (error bars represent s.e.m.). (f) Representative phase contrast images of cells 1 or 72 h following stiffening at either day 1 or 6. (g) Representative immunostaining showing more rapid YAP/TAZ nuclear translocation and α-SMA stress fiber assembly at later stiffening time point (day 6). While YAP/TAZ nuclear localization was more evident 72 h following earlier stiffening (day 1), α-SMA staining was still diffuse and did not co-localize with F-actin stress fibers. In contrast, within 1 h following later stiffening (day 6) YAP/TAZ nuclear translocation was present and 72 h following stiffening the majority of stellate cells displayed α-SMA stress fibers. Representative immunostaining for all experimental groups is presented in the Supplementary Information. Dashed lines represent levels on soft gels at Day 1 (light blue) or Day 6 (dark blue). *P < 0.05, **P < 0.01, ***P < 0.001 where comparisons shown in figure are between day 1 and day 6 results for each post-stiffening time point (e.g., in panel (c) the day 6 YAP/TAZ nuclear intensity ratio 1 h post-stiffening is significantly greater than day 1 YAP/TAZ intensity 1 h post-stiffening, P < 0.05). Scale bars: 50 μm.
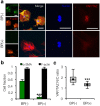
Figure 4. Blocking α-SMA polymerization results in reduced YAP/TAZ nuclear shuttling.
(a) Stellate cells were seeded on soft gels that were stiffened after 3 days and cultured in normal media (BP(−)) or media supplemented with α-SMA blocking peptide (25 μg/mL, BP(+)) for an additional 4 days. The blocking peptide almost completely abrogated α-SMA expression without impacting other filamentous actin, but reduced nuclear YAP/TAZ accumulation. Scale bars: 50 μm. (b) Immunostaining quantification indicates that α-SMA blocking does not affect the fraction of cells displaying F-actin stress fibers (n > 30 cells per group, error bars represent s.e.m.). (c) Tukey box plot of YAP/TAZ nuclear to cytoplasmic intensity ratio demonstrated significant reduction in YAP/TAZ nuclear localization in BP(+) group (n > 30 cells per group). ***P < 0.001.
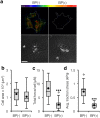
Figure 5. Inhibiting α-SMA does not alter stellate cell spread area but significantly reduces traction force generation.
(a) Representative traction force vector maps and phase contrast images illustrating similar spreading but stronger tractions in BP(−) group. Scale bar: 50 μm. (b) Tukey box plot quantification of cell spread area (n > 12 cells per group). (c) Tukey box plot quantification of total force generated per cell (n > 12 cells per group). (d) Tukey box plot quantification of average traction stress (n > 12 cells per group). ***P < 0.001.
Similar articles
- Gradually softening hydrogels for modeling hepatic stellate cell behavior during fibrosis regression.
Caliari SR, Perepelyuk M, Soulas EM, Lee GY, Wells RG, Burdick JA. Caliari SR, et al. Integr Biol (Camb). 2016 Jun 13;8(6):720-8. doi: 10.1039/c6ib00027d. Epub 2016 May 10. Integr Biol (Camb). 2016. PMID: 27162057 Free PMC article. - Matrix stiffness-induced myofibroblast differentiation is mediated by intrinsic mechanotransduction.
Huang X, Yang N, Fiore VF, Barker TH, Sun Y, Morris SW, Ding Q, Thannickal VJ, Zhou Y. Huang X, et al. Am J Respir Cell Mol Biol. 2012 Sep;47(3):340-8. doi: 10.1165/rcmb.2012-0050OC. Epub 2012 Mar 29. Am J Respir Cell Mol Biol. 2012. PMID: 22461426 Free PMC article. - Hydrogels with differential and patterned mechanics to study stiffness-mediated myofibroblastic differentiation of hepatic stellate cells.
Guvendiren M, Perepelyuk M, Wells RG, Burdick JA. Guvendiren M, et al. J Mech Behav Biomed Mater. 2014 Oct;38:198-208. doi: 10.1016/j.jmbbm.2013.11.008. Epub 2013 Dec 4. J Mech Behav Biomed Mater. 2014. PMID: 24361340 Free PMC article. - Signaling in Fibrosis: TGF-β, WNT, and YAP/TAZ Converge.
Piersma B, Bank RA, Boersema M. Piersma B, et al. Front Med (Lausanne). 2015 Sep 3;2:59. doi: 10.3389/fmed.2015.00059. eCollection 2015. Front Med (Lausanne). 2015. PMID: 26389119 Free PMC article. Review. - YAP/TAZ Signaling as a Molecular Link between Fibrosis and Cancer.
Noguchi S, Saito A, Nagase T. Noguchi S, et al. Int J Mol Sci. 2018 Nov 20;19(11):3674. doi: 10.3390/ijms19113674. Int J Mol Sci. 2018. PMID: 30463366 Free PMC article. Review.
Cited by
- Recent advances in bio-orthogonal and dynamic crosslinking of biomimetic hydrogels.
Arkenberg MR, Nguyen HD, Lin CC. Arkenberg MR, et al. J Mater Chem B. 2020 Sep 21;8(35):7835-7855. doi: 10.1039/d0tb01429j. Epub 2020 Jul 21. J Mater Chem B. 2020. PMID: 32692329 Free PMC article. Review. - Reversible control of biomaterial properties for dynamically tuning cell behavior.
Fumasi FM, Stephanopoulos N, Holloway JL. Fumasi FM, et al. J Appl Polym Sci. 2020 Jul 5;137(25):49058. doi: 10.1002/app.49058. Epub 2020 Feb 9. J Appl Polym Sci. 2020. PMID: 34054139 Free PMC article. - New Insights into Hippo/YAP Signaling in Fibrotic Diseases.
Mia MM, Singh MK. Mia MM, et al. Cells. 2022 Jun 29;11(13):2065. doi: 10.3390/cells11132065. Cells. 2022. PMID: 35805148 Free PMC article. Review. - MicroRNA-223 Suppresses Human Hepatic Stellate Cell Activation Partly via Regulating the Actin Cytoskeleton and Alleviates Fibrosis in Organoid Models of Liver Injury.
Ariyachet C, Chuaypen N, Kaewsapsak P, Chantaravisoot N, Jindatip D, Potikanond S, Tangkijvanich P. Ariyachet C, et al. Int J Mol Sci. 2022 Aug 19;23(16):9380. doi: 10.3390/ijms23169380. Int J Mol Sci. 2022. PMID: 36012644 Free PMC article. - Rate-based approach for controlling the mechanical properties of 'thiol-ene' hydrogels formed with visible light.
Wiley KL, Ovadia EM, Calo CJ, Huber RE, Kloxin AM. Wiley KL, et al. Polym Chem. 2019 Aug 28;10(32):4428-4440. doi: 10.1039/C9PY00447E. Epub 2019 Jul 8. Polym Chem. 2019. PMID: 32405326 Free PMC article.
References
- Desmouliere A., Darby I. A. & Gabbiani G. Normal and pathologic soft tissue remodeling: role of the myofibroblast, with special emphasis on liver and kidney fibrosis. Lab Invest 83, 1689–1707 (2003). - PubMed
- Thannickal V. J., Toews G. B., White E. S., Lynch Iii J. P. & Martinez F. J. Mechanisms of pulmonary fibrosis. Annu Rev Med 55, 395–417 (2004). - PubMed
- World Health Organization, Cause specific mortality: regional estimates 2000-2011. (2012) Available at: http://www.who.int/healthinfo/global_burden_disease/estimates_regional_2.... (Accessed: 30th November 2015).
Publication types
MeSH terms
Substances
LinkOut - more resources
Full Text Sources
Other Literature Sources


