Sex speeds adaptation by altering the dynamics of molecular evolution - PubMed (original) (raw)
Comparative Study
. 2016 Mar 10;531(7593):233-6.
doi: 10.1038/nature17143. Epub 2016 Feb 24.
Affiliations
- PMID: 26909573
- PMCID: PMC4855304
- DOI: 10.1038/nature17143
Comparative Study
Sex speeds adaptation by altering the dynamics of molecular evolution
Michael J McDonald et al. Nature. 2016.
Abstract
Sex and recombination are pervasive throughout nature despite their substantial costs. Understanding the evolutionary forces that maintain these phenomena is a central challenge in biology. One longstanding hypothesis argues that sex is beneficial because recombination speeds adaptation. Theory has proposed several distinct population genetic mechanisms that could underlie this advantage. For example, sex can promote the fixation of beneficial mutations either by alleviating interference competition (the Fisher-Muller effect) or by separating them from deleterious load (the ruby in the rubbish effect). Previous experiments confirm that sex can increase the rate of adaptation, but these studies did not observe the evolutionary dynamics that drive this effect at the genomic level. Here we present the first, to our knowledge, comparison between the sequence-level dynamics of adaptation in experimental sexual and asexual Saccharomyces cerevisiae populations, which allows us to identify the specific mechanisms by which sex speeds adaptation. We find that sex alters the molecular signatures of evolution by changing the spectrum of mutations that fix, and confirm theoretical predictions that it does so by alleviating clonal interference. We also show that substantially deleterious mutations hitchhike to fixation in adapting asexual populations. In contrast, recombination prevents such mutations from fixing. Our results demonstrate that sex both speeds adaptation and alters its molecular signature by allowing natural selection to more efficiently sort beneficial from deleterious mutations.
Figures
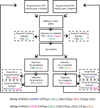
Extended Data Figure 1. Genetic system and experimental protocol for evolution of sexual populations
Genotypes of the two haploid mating types are indicated at bottom, with selectable markers that are expressed in each strain indicated in color. Steps in our experimental protocols involving these markers are indicated in the corresponding color. STE5pr is a haploid-specific promoter and STE2pr and STE3pr are a and α-specific promoters respectively, so haploid a cells express URA3 and HIS3, while haploid α cells express URA3 and LEU2. The drug resistance markers KANMX and HPHB, tightly linked to the a and α mating locus respectively, are constitutively expressed. URA3 is counterselectable; it is not expressed in diploids, rendering them resistant to 5’ FOA.
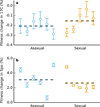
Extended Data Figure 2. Adaptation to 17°C and sporulation conditions
a, b, Relative fitness of evolved asexual (blue) and sexual (orange) populations over four days in 17°C (a) and sporulation conditions (b). Fitness changes are reported averaged over a complete experimental cycle (90 generations; mean of three replicate fitness assays, error bars ±s.e.m.). Mean fitness differences between asexual and sexual evolved strains are not significant in either the 17°C (two-sided t-test, _P_=0.5) or sporulation (two-sided t-test, _P_=0.8) treatment.
Extended Data Figure 3. Adaptation in mixed and non-mixed asexual populations
Fitness increases after 990 generations of evolution in mixed (blue) and non-mixed (pink) alternative asexual control populations (mean of four replicate fitness measurements, error bars ±s.e.m.). Each non-mixed line was maintained independently. Subpopulations from mixed populations were mixed in pairs every 90 generations; each pair is indicated by a corresponding light and dark circle.
Extended Data Figure 4. Read-depth variation analysis of sequenced clones
Denoised, normalized coverage in 100bp windows along the genome (Methods). Each panel represents a clone isolated from one of 4 independent populations. Pairs of clones from the same population are adjacent and indicated by the population label on the left. Regions containing putative amplifications and deletions (Extended Data Table 4) are highlighted in orange.
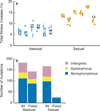
Figure 1. The rate and molecular signatures of adaptation
a, Total fitness increase over ~1000 generations of adaptation in asexual (blue) and sexual (orange) populations. Open circles represent the mean fitness of the population (for type a populations without frequency dependence); solid points represent the fitness of individual clones (mean of five replicate fitness assays, error bars ±s.e.m.). b, Classification of observed and fixed mutations in sequenced lines.
Figure 2. Fates of spontaneously arising mutations
a–h, The frequencies of all identified de novo mutations through ~1000 generations in four asexual populations (a–d) and four sexual populations (e–h). Solid lines are nonsynonymous mutations; dashed are synonymous; dotted are intergenic. Black trajectories represent mutations in ERG3 subject to balancing selection. i, Distribution of correlations in frequency changes among pairs of trajectories in asexual (blue) and sexual (orange) populations. j,k, Comparison between these correlations and an empirical null distribution (gray) in asexual (j) and sexual (k) populations. l, Quantile-quantile plot summarizing deviations from null expectations (gray) in asexual (blue) and sexual (orange) populations.
Figure 3. Fitness effects of individual mutations
a, b, Mutation trajectories in an asexual (a) and sexual (b) line. Orange mutations are significantly beneficial; blue are deleterious; gray are unmeasured or consistent with neutrality. Several mutations were present in the founding population and hence omitted from Figures 1 and 2. c, Identities and fitness effects of significantly beneficial or deleterious mutations (chromosome number in parenthesis). Asterisks indicate fitness effects measured from reconstructions (mean of six replicate fitness assays, error bars ±s.e.m.); other fitnesses are from sequencing-based assay (error bars ±s.e. of regression coefficient; Methods). Italicized mutations are synonymous.
Comment in
- Molecular evolution: Sex accelerates adaptation.
Goddard MR. Goddard MR. Nature. 2016 Mar 10;531(7593):176-7. doi: 10.1038/nature17304. Epub 2016 Feb 24. Nature. 2016. PMID: 26909572 No abstract available. - Molecular evolution: Friends with benefits--sex speeds up adaptation.
Cloney R. Cloney R. Nat Rev Genet. 2016 May;17(5):254-5. doi: 10.1038/nrg.2016.32. Epub 2016 Mar 14. Nat Rev Genet. 2016. PMID: 26972589 No abstract available.
Similar articles
- Molecular evolution: Friends with benefits--sex speeds up adaptation.
Cloney R. Cloney R. Nat Rev Genet. 2016 May;17(5):254-5. doi: 10.1038/nrg.2016.32. Epub 2016 Mar 14. Nat Rev Genet. 2016. PMID: 26972589 No abstract available. - Rate of adaptation in sexuals and asexuals: a solvable model of the Fisher-Muller effect.
Park SC, Krug J. Park SC, et al. Genetics. 2013 Nov;195(3):941-55. doi: 10.1534/genetics.113.155135. Epub 2013 Aug 26. Genetics. 2013. PMID: 23979572 Free PMC article. - Molecular evolution: Sex accelerates adaptation.
Goddard MR. Goddard MR. Nature. 2016 Mar 10;531(7593):176-7. doi: 10.1038/nature17304. Epub 2016 Feb 24. Nature. 2016. PMID: 26909572 No abstract available. - Limits to adaptation in asexual populations.
de Visser JA, Rozen DE. de Visser JA, et al. J Evol Biol. 2005 Jul;18(4):779-88. doi: 10.1111/j.1420-9101.2005.00879.x. J Evol Biol. 2005. PMID: 16033549 Review. - Beneficial mutations and the dynamics of adaptation in asexual populations.
Sniegowski PD, Gerrish PJ. Sniegowski PD, et al. Philos Trans R Soc Lond B Biol Sci. 2010 Apr 27;365(1544):1255-63. doi: 10.1098/rstb.2009.0290. Philos Trans R Soc Lond B Biol Sci. 2010. PMID: 20308101 Free PMC article. Review.
Cited by
- Let's get physical - mechanisms of crossover interference.
von Diezmann L, Rog O. von Diezmann L, et al. J Cell Sci. 2021 May 15;134(10):jcs255745. doi: 10.1242/jcs.255745. Epub 2021 May 26. J Cell Sci. 2021. PMID: 34037217 Free PMC article. Review. - Asexual Experimental Evolution of Yeast Does Not Curtail Transposable Elements.
Chen P, Zhang J. Chen P, et al. Mol Biol Evol. 2021 Jun 25;38(7):2831-2842. doi: 10.1093/molbev/msab073. Mol Biol Evol. 2021. PMID: 33720342 Free PMC article. - Parthenogenesis in Darevskia lizards: A rare outcome of common hybridization, not a common outcome of rare hybridization.
Freitas S, Westram AM, Schwander T, Arakelyan M, Ilgaz Ç, Kumlutas Y, Harris DJ, Carretero MA, Butlin RK. Freitas S, et al. Evolution. 2022 May;76(5):899-914. doi: 10.1111/evo.14462. Epub 2022 Apr 12. Evolution. 2022. PMID: 35323995 Free PMC article. - Bacteriophages evolve enhanced persistence to a mucosal surface.
Chin WH, Kett C, Cooper O, Müseler D, Zhang Y, Bamert RS, Patwa R, Woods LC, Devendran C, Korneev D, Tiralongo J, Lithgow T, McDonald MJ, Neild A, Barr JJ. Chin WH, et al. Proc Natl Acad Sci U S A. 2022 Jul 5;119(27):e2116197119. doi: 10.1073/pnas.2116197119. Epub 2022 Jun 29. Proc Natl Acad Sci U S A. 2022. PMID: 35767643 Free PMC article. - Crossover patterning in plants.
Lloyd A. Lloyd A. Plant Reprod. 2023 Mar;36(1):55-72. doi: 10.1007/s00497-022-00445-4. Epub 2022 Jul 14. Plant Reprod. 2023. PMID: 35834006 Free PMC article. Review.
References
REFERENCES CITED
- Bell G. The Masterpiece of Nature: The Evolution and Genetics of Sexuality. University of California Press; 1982.
- Otto SP, Lenormand T. Resolving the paradox of sex and recombination. Nature Reviews Genetics. 2002;3:252–261. - PubMed
- Kondrashov A. Classification of hypotheses on the advantage of amphimixis. J Heredity. 1993;84:372–387. - PubMed
- Weismann A. In: Essays upon heredity and kindred biological problems. Poulton EB, Schonland S, Shipley AE, editors. Clarendon; 1889. pp. 251–332.
- Fisher RA. The Genetical Theory of Natural Selection. Oxford University Press; 1930.
METHODS REFERENCES
- Tong AH. Systematic genetic analysis with ordered arrays of yeast deletion mutants. Science. 2001;294:2364–2368. - PubMed
- Giaever G, et al. Functional profiling of the Saccharomyces cerevisiae genome. Nature. 2002;418:387–391. - PubMed
Publication types
MeSH terms
LinkOut - more resources
Full Text Sources
Other Literature Sources
Molecular Biology Databases


