Morphogenesis of 3D vascular networks is regulated by tensile forces - PubMed (original) (raw)
Morphogenesis of 3D vascular networks is regulated by tensile forces
Dekel Rosenfeld et al. Proc Natl Acad Sci U S A. 2016.
Abstract
Understanding the forces controlling vascular network properties and morphology can enhance in vitro tissue vascularization and graft integration prospects. This work assessed the effect of uniaxial cell-induced and externally applied tensile forces on the morphology of vascular networks formed within fibroblast and endothelial cell-embedded 3D polymeric constructs. Force intensity correlated with network quality, as verified by inhibition of force and of angiogenesis-related regulators. Tensile forces during vessel formation resulted in parallel vessel orientation under static stretching and diagonal orientation under cyclic stretching, supported by angiogenic factors secreted in response to each stretch protocol. Implantation of scaffolds bearing network orientations matching those of host abdominal muscle tissue improved graft integration and the mechanical properties of the implantation site, a critical factor in repair of defects in this area. This study demonstrates the regulatory role of forces in angiogenesis and their capacities in vessel structure manipulation, which can be exploited to improve scaffolds for tissue repair.
Keywords: endothelial cells; engineered tissue; mechanical forces; vascularization.
Conflict of interest statement
The authors declare no conflict of interest.
Figures
Fig. 1.
The influence of cytoskeleton and intracellular signaling inhibitors on cell-induced contractile forces and vascular network formation. (A) Immunofluorescence imaging of a uniaxially fixated fibrin gel embedded with a coculture of endothelial cells and fibroblasts and grown for 8 d. Inhibitors were added to the culture medium on day 3 and replaced daily, along with the medium: (I) control gel, (II) gel treated with Blebbistatin, (III) gel treated with Y27632, (IV) gel treated with SU5416, and (V) gel treated with DAPT. Samples were stained to visualize the nuclei (DAPI, blue), endothelial cells (CD31, red), and actin fibers (Phalloidin-FITC, green). (B) Cell-induced contractile forces were measured as a function of µpost deflections of cell-embedded fibrin gels on days 1–8 postseeding. (C) A coplot of vessel quality and cell-induced contractile forces measured on day 8 postseeding.
Fig. 2.
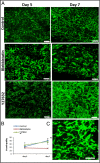
Vascular organization within free-floating scaffolds upon inhibition of cell-generated forces. (A) HUVEC-GFP cells were embedded on a free-floating scaffold that was treated with an inhibitor (blebbistatin/Y27632) on day 3 of culture and later imaged on days 5 and 7. (Scale bars: 250 µm.) (B) Quantification of vessel quality determined by estimating the roundness parameter on days 5 and 7 postseeding. (C) Reformation of vascular networks on day 9, 2 d after removal of blebbistatin. (Scale bars: 250 µm.)
Fig. S1.
Coculture of ECs and fibroblasts embedded in a uniaxially fixated fibrin gel. (A) Two PDMS µposts were positioned within a well of a 96-well plate. The fibrin gel is attached to the upper side of the µposts. (B, Upper) CD31-stained HUVEC cells grown within a fixated fibrin gel (Left) or within a free-floating fibrin gel (Right). (Lower) Higher magnification of samples grown as described above and immunofluorescently stained for CD31 (red) and actin (Phalloidin-FITC, green). (C) Orientation analysis of uniaxially fixated fibrin versus control gels. Under conditions of fibrin fixation, most objects were in the zero direction whereas, in the control group, no preferred direction was observed. (D) Measurement of contractile forces exerted by cells embedded within the uniaxially fixated fibrin gel, measured as a function of the deflection of the µpost. *P value < 0.05, **P value < 0.01.
Fig. S2.
Vessel structure orientation and cell force estimation. Vessel orientation was analyzed using Matlab. The threshold was set to the binary image (A), and the image was segmented into objects. By using the Hough transform, lines were detected in the image (B). For each line, an angle (θ) and distance (ρ) from the origin were determined. The line angle distribution between −90 and +90° was then determined (C). The average number of objects in specific angle intervals was then estimated. (D) PDMS µpost deflections during the experiment days. Shown is the top view of the µpost heads.
Fig. S3.
Examining cell density and cell viability in the presence of inhibitors. Live–dead assays were performed on day 5, 2 d after addition of the inhibitor. Constructs were loaded with calcein acetoxymethyl ester (calcein AM;) (1 µmol/L), an indicator of viable cells and ethidium homodimer-1 (4 µmol/L) (Sigma-Aldrich), an indicator of dead cells, for 30 min at 37 °C. Scaffolds were imaged, and viability and cell density were quantified using Matlab (The Mathworks). (A) Fluorescent image of live–dead assay in fibrin gel within the µposts treated with various inhibitors. By estimating the percentage of dead cells in the constructs from the initial seeded number of cells, we received ∼1% dead cells, a suggestion of good and similar viability under all conditions. (B) Quantification of cell density, demonstrating no significant change between the culture conditions.
Fig. 3.
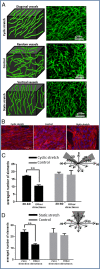
The orientation of vessel-like structures upon exposure to various mechanical stretching regimens. (A) Cyclic stretching applied on uniaxially fixated seeded constructs resulted in diagonal vessels whereas static stretching resulted in vertical vessels, and free-floating scaffolds resulted in randomly orientated vessels. Green, HUVEC-GFP cells. (Scale bars: 250 µm.) The presented images are the projection of about a 500-µm volume. (B) The orientation of cell actin fibers upon exposure to the mechanical forces described in A. Red, phalloidin staining; blue, DAPI. (C) Orientation analysis. Quantification of the average number of objects in 30–60° direction under cyclic stretching and control. (D) Orientation analysis. Quantification of the average number of objects in the stretching direction under static stretching and control.
Fig. S4.
Lumens of vessel-like structures. Paraffin-embedded sections cut perpendicular to the stretching direction contained lumen-like structures, as observed by staining for CD31 (an endothelial marker). Shown is CD31 (red) and DAPI (blue) staining, demonstrating lumens of vessel-like structures, which are marked with arrows.
Fig. S5.
Self-designed fixation device. For applying static tensile forces on cell-seeded 3D scaffold constructs, a fixation device was designed to allow for uniaxial fixation of the scaffold at both sides. The advantages of this device are the small size and portability, which enable imaging of fluorescently labeled cells during the culturing period.
Fig. 4.
Secretion of angiogenic proteins by cells under the various mechanical stretching regimens. Angiogenesis-related protein secretion from cell-embedded Gelfoam scaffolds grown under cyclic stretching or static stretching conditions. Medium was collected from all samples on day 8 postseeding. Fold change from the control (no stretch) group (=1) is presented. **P value < 0.01.
Fig. S6.
Proangiogenic factor secretion under different mechanical conditions. Protein secretion from fibrin gels measured (A) 2 d or (B) 7 d postseeding. A comparison between free-floating gels (=1), uniaxially fixated gels, and gels attached to a plate. **P value < 0.01. This figure demonstrates the comparison between the different conditions of the fibrin gel in two time points. Attached gel resembles stronger forces than uniaxially fixated gel, all compared with the free-floating control. On day 2, we observed differences in the level of FGF, IL8, PDGF, Timp1, Timp2, and TNF. On day 7, we observed differences in ANG2, FGF, HFG, PDGF, and TNF. Similar to the Gelfoam construct, the level of PDGF increased under the induction of mechanical forces. In addition, the level of ANG2 increased with increasing forces on day 7. However, here, we couldn't identify changes in the level of VEGF.
Fig. 5.
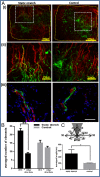
Implantation of static-stretched and control scaffolds in the mouse abdominal muscle. Scaffolds were implanted on day 8 postseeding. Two weeks thereafter, rhodamine-dextran was injected through the mouse tail vein to view functional vessels. (A, I) Fluorescence imaging of HUVEC-GFP cells and of rhodamine-dextran in the retrieved scaffolds. Scaffold area is marked in yellow. (II) A larger magnification of the retrieved scaffolds, showing a connection between the implanted and the host vascular network, as well as functional implanted vessel-like structures. (III) Histological staining of frozen sections of the retrieved scaffold. Green, HUVEC-GFP; red, mouse vessels stained with anti-CD31 antibody; blue, DAPI for nucleic staining. (Scale bar: III, 50 µm.) (B) Orientation analysis of vessel-like structures 2 wk postimplantation. Objects from static-stretched scaffolds preserved their orientation in the zero direction, compared with the control scaffold, where no dominant direction was observed. (C) The mean length of functional implanted vessel-like structures.
Fig. S7.
In vivo implantation. (A) Implantation of oriented vascular network within mouse abdominal muscle. (B) H&E staining of an implantation site after scaffold retrieval. (C) A typical stress–strain curve of the implantation site after 14 d in vivo. (D) Blood vessel density before and after implantation: The blood vessel density was measured using a self-written Matlab program. No significant change was observed in the vessel density pre- and postimplantation.
Fig. S8.
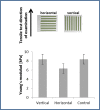
Young’s modulus of the engineered construct after 7 d of static stretching and preimplantation. Engineered constructs seeded with endothelial cells and fibroblasts and cultured under static stretching conditions were mounted within the Biodynamic test instrument. Scaffolds were stretched along the static stretching direction (vertical, in the direction of the vessel-like structures) and orthogonal to the static stretching direction (horizontal, orthogonal to the vessel-like structures orientation direction). No significant change in Young’s modulus was observed between the vertically and horizontally stretched samples or with the unstretched controls. This suggests that the implanted structures featured similar initial mechanical properties preimplantation and strengthens the hypothesis that mechanical properties improve with better integration with the host tissue.
Fig. 6.
Mechanical analysis of the implantation site postimplantation. (A) Oriented vessels were implanted parallel vs. perpendicular to the vessels of the abdominal tissue. (B) The stiffness (Young’s modulus) and (C) UTS of the tissue 14 d postimplantation, comparing vertical (n = 6), horizontal (n = 4) and control group (n = 4) vessels. *P value < 0.05, **P value < 0.01.
Similar articles
- Novel method to improve vascularization of tissue engineered constructs with biodegradable fibers.
Wong HK, Ivan Lam CR, Wen F, Mark Chong SK, Tan NS, Jerry C, Pal M, Tan LP. Wong HK, et al. Biofabrication. 2016 Jan 7;8(1):015004. doi: 10.1088/1758-5090/8/1/015004. Biofabrication. 2016. PMID: 26741237 - The delayed addition of human mesenchymal stem cells to pre-formed endothelial cell networks results in functional vascularization of a collagen-glycosaminoglycan scaffold in vivo.
McFadden TM, Duffy GP, Allen AB, Stevens HY, Schwarzmaier SM, Plesnila N, Murphy JM, Barry FP, Guldberg RE, O'Brien FJ. McFadden TM, et al. Acta Biomater. 2013 Dec;9(12):9303-16. doi: 10.1016/j.actbio.2013.08.014. Epub 2013 Aug 17. Acta Biomater. 2013. PMID: 23958783 - Elderly Patient-Derived Endothelial Cells for Vascularization of Engineered Muscle.
Perry L, Flugelman MY, Levenberg S. Perry L, et al. Mol Ther. 2017 Apr 5;25(4):935-948. doi: 10.1016/j.ymthe.2017.02.011. Epub 2017 Mar 6. Mol Ther. 2017. PMID: 28279644 Free PMC article. - Vascularization and Angiogenesis in Tissue Engineering: Beyond Creating Static Networks.
Rouwkema J, Khademhosseini A. Rouwkema J, et al. Trends Biotechnol. 2016 Sep;34(9):733-745. doi: 10.1016/j.tibtech.2016.03.002. Epub 2016 Mar 28. Trends Biotechnol. 2016. PMID: 27032730 Review. - Vascularization--the conduit to viable engineered tissues.
Kaully T, Kaufman-Francis K, Lesman A, Levenberg S. Kaully T, et al. Tissue Eng Part B Rev. 2009 Jun;15(2):159-69. doi: 10.1089/ten.teb.2008.0193. Tissue Eng Part B Rev. 2009. PMID: 19309238 Review.
Cited by
- Mechanical Loading Promotes the Expansion of Primitive Osteoprogenitors and Organizes Matrix and Vascular Morphology in Long Bone Defects.
Liu C, Cabahug-Zuckerman P, Stubbs C, Pendola M, Cai C, Mann KA, Castillo AB. Liu C, et al. J Bone Miner Res. 2019 May;34(5):896-910. doi: 10.1002/jbmr.3668. Epub 2019 Feb 20. J Bone Miner Res. 2019. PMID: 30645780 Free PMC article. - The extracellular matrix mechanics in the vasculature.
Wang D, Brady T, Santhanam L, Gerecht S. Wang D, et al. Nat Cardiovasc Res. 2023 Aug;2(8):718-732. doi: 10.1038/s44161-023-00311-0. Epub 2023 Aug 10. Nat Cardiovasc Res. 2023. PMID: 39195965 Review. - Formation of pressurizable hydrogel-based vascular tissue models by selective gelation in composite PDMS channels.
Fukushi M, Kinoshita K, Yamada M, Yajima Y, Utoh R, Seki M. Fukushi M, et al. RSC Adv. 2019 Mar 19;9(16):9136-9144. doi: 10.1039/c9ra00257j. eCollection 2019 Mar 15. RSC Adv. 2019. PMID: 35517655 Free PMC article. - Tissue Engineering the Vascular Tree.
Traore MA, George SC. Traore MA, et al. Tissue Eng Part B Rev. 2017 Dec;23(6):505-514. doi: 10.1089/ten.teb.2017.0010. Epub 2017 Aug 11. Tissue Eng Part B Rev. 2017. PMID: 28799844 Free PMC article. Review. - External mechanical loading overrules cell-cell mechanical communication in sprouting angiogenesis during early bone regeneration.
Dazzi C, Mehl J, Benamar M, Gerhardt H, Knaus P, Duda GN, Checa S. Dazzi C, et al. PLoS Comput Biol. 2023 Nov 13;19(11):e1011647. doi: 10.1371/journal.pcbi.1011647. eCollection 2023 Nov. PLoS Comput Biol. 2023. PMID: 37956208 Free PMC article.
References
- Novosel EC, Kleinhans C, Kluger PJ. Vascularization is the key challenge in tissue engineering. Adv Drug Deliv Rev. 2011;63(4-5):300–311. - PubMed
- Takebe T, et al. Vascularized and functional human liver from an iPSC-derived organ bud transplant. Nature. 2013;499(7459):481–484. - PubMed
- Caspi O, et al. Tissue engineering of vascularized cardiac muscle from human embryonic stem cells. Circ Res. 2007;100(2):263–272. - PubMed
Publication types
MeSH terms
LinkOut - more resources
Full Text Sources
Other Literature Sources


