Myelodysplastic Syndrome Revealed by Systems Immunology in a Melanoma Patient Undergoing Anti-PD-1 Therapy - PubMed (original) (raw)
Case Reports
Myelodysplastic Syndrome Revealed by Systems Immunology in a Melanoma Patient Undergoing Anti-PD-1 Therapy
Allison R Greenplate et al. Cancer Immunol Res. 2016 Jun.
Abstract
Antibodies aimed at blocking the interaction between programmed cell death-1 (PD-1) and its ligands have shown impressive efficacy in a variety of malignancies and are generally well tolerated. Research has focused intensely on T cells and their interaction with cells within melanoma tumors, while relatively little is understood about the systems immunology of the cells in the blood during checkpoint inhibitor therapy. Longitudinal cytomic analysis using mass cytometry can characterize all the cells in a small sample of blood and has the potential to reveal key shifts in the cellular milieu occurring during treatment. We report a case of advanced melanoma in which mass cytometry detected abnormal myeloid cells resulting from myelodysplastic syndrome (MDS) in the blood following treatment with an anti-PD-1 agent. Myeloid blasts comprised <1% of peripheral blood mononuclear cells (PBMC) 1 month after the start of treatment. Six months after starting therapy, myeloid blasts comprised 5% of PBMCs, and a bone marrow biopsy confirmed refractory anemia with excess blasts-2 (RAEB-2). Longitudinal mass cytometry immunophenotyping comprehensively characterized blast phenotype evolution and revealed elevated PD-1 expression on the surface of nonblast myeloid cells. These findings highlight the clinical significance of cytomic monitoring, indicate that the myeloid compartment should be monitored during checkpoint inhibitor therapy, and emphasize the value of systems immunology in medicine. Cancer Immunol Res; 4(6); 474-80. ©2016 AACR.
©2016 American Association for Cancer Research.
Figures
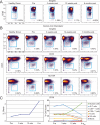
Figure 1. Clinical Imaging and Blood Counts
A) Pre-therapy and post-therapy PET/CT scans are shown that highlight a lingular metastasis that increases in size during the course of therapy. B) Select peripheral blood counts and blast cells by manual differential are shown prior to and during therapy. The patient had a pre-existing thrombocytopenia (green line) that worsened over time. After therapy initiation, blasts (yellow) are seen to increase as hemoglobin (Hgb, orange line) drops and white blood cells (blue line, same scale as Hgb) remain in the normal range. As of 9 months post therapy initiation, the patient remains on anti–PD-1 therapy.
Figure 2. Identification of peripheral blasts by mass cytometry in a melanoma patient undergoing anti–PD-1 therapy
A 33 parameter mass cytometry panel was used to immunophenotype peripheral blood from a melanoma patient over the course of anti–PD-1 therapy. A) Cells positive for nucleic acid intercalator, a marker of nuclear DNA, and low for CD45 were identified over the course of therapy, but not in a healthy donor. B) The majority of CD45lo events (blue gate) from the patient expressed intermediate levels of CD33 and high levels of both HLA-DR and CD38 compared to non-blasts, consistent with peripheral myeloblast phenotype. C) Peripheral blasts increased from 1.16% to 4.65% of all PBMC (left). The percentage of T (light blue), B (yellow), and NK (red) cells declined over the course of therapy while the percentage of myeloid cells (green) increased (right).
Figure 3. Frequency of PD-1+ monocytes in this case remained higher during therapy than in untreated healthy controls
A) The percentage of PD-1+ cells was determined for blasts, CD8 T cells, CD4 T cells, myeloid cells, NK cells, and B cells. For healthy, n = 5. B) Biaxial plots show the increase of activated monocytes through dual expression of CD45RA and HLA-DR on non-lymphoid cells from a healthy donor and from the patient over the course of anti–PD-1 therapy.
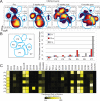
Figure 4. Peripheral blast phenotype shifts dramatically over the course of anti–PD-1 therapy
A) CD45lo events from the patient were gated and used to create a viSNE map. Blue gates identify major islands of cell density over all four time points. Each population denoted by the letter P followed by a number. B) Increase in cell density within each population (P, right) is shown as fold change over percentage of cells within sectors from the pre-therapy sample (left). C) A heatmap displays intensities of 28 measured proteins for each population identified on the viSNE map. Intensity is shown as heat, calculated as a transformed ratio of medians by the table's minimum.
Similar articles
- [Analysis of immunophenotypic features of blasts in patients with myelodysplastic syndrome by flow cytometry and its diagnostic significance].
Sun JF, Yang B, Zhang L, Huang Y, Yang J. Sun JF, et al. Zhongguo Shi Yan Xue Ye Xue Za Zhi. 2012 Jun;20(3):632-5. Zhongguo Shi Yan Xue Ye Xue Za Zhi. 2012. PMID: 22739171 Chinese. - The Next Immune-Checkpoint Inhibitors: PD-1/PD-L1 Blockade in Melanoma.
Mahoney KM, Freeman GJ, McDermott DF. Mahoney KM, et al. Clin Ther. 2015 Apr 1;37(4):764-82. doi: 10.1016/j.clinthera.2015.02.018. Epub 2015 Mar 29. Clin Ther. 2015. PMID: 25823918 Free PMC article. Review. - Characteristics of the phenotypic abnormalities of bone marrow cells in childhood myelodysplastic syndromes and juvenile myelomonocytic leukemia.
Oliveira AF, Tansini A, Vidal DO, Lopes LF, Metze K, Lorand-Metze I. Oliveira AF, et al. Pediatr Blood Cancer. 2017 Apr;64(4). doi: 10.1002/pbc.26285. Epub 2016 Oct 17. Pediatr Blood Cancer. 2017. PMID: 27748021 - Safety of pembrolizumab for the treatment of melanoma.
Martin-Liberal J, Kordbacheh T, Larkin J. Martin-Liberal J, et al. Expert Opin Drug Saf. 2015 Jun;14(6):957-64. doi: 10.1517/14740338.2015.1021774. Epub 2015 Apr 30. Expert Opin Drug Saf. 2015. PMID: 25927979 Review. - Checkpoint inhibition for advanced mucosal melanoma.
Thierauf J, Veit JA, Hess J, Treiber N, Lisson C, Weissinger SE, Bommer M, Hoffmann TK. Thierauf J, et al. Eur J Dermatol. 2017 Apr 1;27(2):160-165. doi: 10.1684/ejd.2016.2949. Eur J Dermatol. 2017. PMID: 28174141
Cited by
- Characterizing cell subsets using marker enrichment modeling.
Diggins KE, Greenplate AR, Leelatian N, Wogsland CE, Irish JM. Diggins KE, et al. Nat Methods. 2017 Mar;14(3):275-278. doi: 10.1038/nmeth.4149. Epub 2017 Jan 30. Nat Methods. 2017. PMID: 28135256 Free PMC article. - Computational Immune Monitoring Reveals Abnormal Double-Negative T Cells Present across Human Tumor Types.
Greenplate AR, McClanahan DD, Oberholtzer BK, Doxie DB, Roe CE, Diggins KE, Leelatian N, Rasmussen ML, Kelley MC, Gama V, Siska PJ, Rathmell JC, Ferrell PB, Johnson DB, Irish JM. Greenplate AR, et al. Cancer Immunol Res. 2019 Jan;7(1):86-99. doi: 10.1158/2326-6066.CIR-17-0692. Epub 2018 Nov 9. Cancer Immunol Res. 2019. PMID: 30413431 Free PMC article. - Picturing Polarized Myeloid Phagocytes and Regulatory Cells by Mass Cytometry.
Roussel M, Bartkowiak T, Irish JM. Roussel M, et al. Methods Mol Biol. 2019;1989:217-226. doi: 10.1007/978-1-4939-9454-0_14. Methods Mol Biol. 2019. PMID: 31077108 Free PMC article. - Regulatory myeloid cells: an underexplored continent in B-cell lymphomas.
Roussel M, Irish JM, Menard C, Lhomme F, Tarte K, Fest T. Roussel M, et al. Cancer Immunol Immunother. 2017 Aug;66(8):1103-1111. doi: 10.1007/s00262-017-2036-5. Epub 2017 Jul 8. Cancer Immunol Immunother. 2017. PMID: 28689360 Free PMC article. Review. - Mass cytometry deep phenotyping of human mononuclear phagocytes and myeloid-derived suppressor cells from human blood and bone marrow.
Roussel M, Ferrell PB Jr, Greenplate AR, Lhomme F, Le Gallou S, Diggins KE, Johnson DB, Irish JM. Roussel M, et al. J Leukoc Biol. 2017 Aug;102(2):437-447. doi: 10.1189/jlb.5MA1116-457R. Epub 2017 Apr 11. J Leukoc Biol. 2017. PMID: 28400539 Free PMC article.
References
Publication types
MeSH terms
Substances
Grants and funding
- L30 CA179768/CA/NCI NIH HHS/United States
- K12 CA090625/CA/NCI NIH HHS/United States
- F31 CA199993/CA/NCI NIH HHS/United States
- P30 CA068485/CA/NCI NIH HHS/United States
- R00 CA143231/CA/NCI NIH HHS/United States
LinkOut - more resources
Full Text Sources
Other Literature Sources
Medical
Research Materials
Miscellaneous


