Allantoin transport protein, PucI, from Bacillus subtilis: evolutionary relationships, amplified expression, activity and specificity - PubMed (original) (raw)
Allantoin transport protein, PucI, from Bacillus subtilis: evolutionary relationships, amplified expression, activity and specificity
Pikyee Ma et al. Microbiology (Reading). 2016 May.
Abstract
This work reports the evolutionary relationships, amplified expression, functional characterization and purification of the putative allantoin transport protein, PucI, from Bacillus subtilis. Sequence alignments and phylogenetic analysis confirmed close evolutionary relationships between PucI and membrane proteins of the nucleobase-cation-symport-1 family of secondary active transporters. These include the sodium-coupled hydantoin transport protein, Mhp1, from Microbacterium liquefaciens, and related proteins from bacteria, fungi and plants. Membrane topology predictions for PucI were consistent with 12 putative transmembrane-spanning α-helices with both N- and C-terminal ends at the cytoplasmic side of the membrane. The pucI gene was cloned into the IPTG-inducible plasmid pTTQ18 upstream from an in-frame hexahistidine tag and conditions determined for optimal amplified expression of the PucI(His6) protein in Escherichia coli to a level of about 5 % in inner membranes. Initial rates of inducible PucI-mediated uptake of 14C-allantoin into energized E. coli whole cells conformed to Michaelis-Menten kinetics with an apparent affinity (Kmapp) of 24 ± 3 μM, therefore confirming that PucI is a medium-affinity transporter of allantoin. Dependence of allantoin transport on sodium was not apparent. Competitive uptake experiments showed that PucI recognizes some additional hydantoin compounds, including hydantoin itself, and to a lesser extent a range of nucleobases and nucleosides. PucI(His6) was solubilized from inner membranes using n-dodecyl-β-d-maltoside and purified. The isolated protein contained a substantial proportion of α-helix secondary structure, consistent with the predictions, and a 3D model was therefore constructed on a template of the Mhp1 structure, which aided localization of the potential ligand binding site in PucI.
Figures
Fig. 1.
Metabolic pathway for catabolism of purine nucleobases in B. subtilis. The large oval represents the inner cell membrane of B. subtilis containing transport proteins for purine nucleobases and their catabolites (black circles) encoded by the given genes: pbuG (hypoxanthine and guanine), pbuX (xanthine), pucJ/pucK (uric acid), pucI (allantoin) and pbuE (adenine and hypoxanthine efflux). Compound structures are numbered as follows: 1, adenine; 2, hypoxanthine; 3, guanine; 4, xanthine; 5, uric acid; 6, allantoin; 7, allantoic acid; 8, ureidoglycine; 9, ureidoglycolic acid; 10, urea; 11, glyoxylic acid. The genes encoding the enzymes for the conversion reactions are labelled on the reaction arrows. For simplicity, the other reactants and reaction products involved in each conversion are not shown on the diagram, but are listed as follows: adeC (adenine deaminase, H2O → NH3), gde (guanine deaminase, H2O → NH3), pucABCDE (xanthine dehydrogenase, O2 → H2O2), pucLM (uricase, O2 → CO2), pucH (allantoinase, O2 → CO2), pucF (allantoic acid aminohydrolase, H2O → CO2+NH3), pucG (ureidoglycolase). This diagram was constructed based on information given in: Nygaard et al. (1996), (2000); Schultz et al. (2001); Saxild et al. (2001); Beier et al. (2002); Nygaard & Saxild (2005); Goelzer et al. (2008).
Fig. 2.
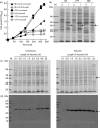
Induced amplified expression of the PucI(His6) protein in E. coli. (a) Growth curves for BL21(DE3) cells containing the pTTQ18-pucI(His6) construct in LB (squares), 2TY (circles) and M9 minimal (triangles) media supplemented with 20 mM glycerol left uninduced (black shapes) or induced with 0.5 mM IPTG at OD680 0.4–0.6 (white shapes). (b) SDS-PAGE analysis of total membranes prepared from the cells described above. The arrows indicate the position of the amplified PucI(His6) protein. M, Molecular mass markers; I, induced; U, uninduced. (c, d) Effect of induction time on amplified expression of the PucI(His6) protein in E. coli shown by SDS-PAGE (c) and Western blot (d) analysis of total membrane preparations from cultures of BL21(DE3) cells containing the pTTQ18-pucI(His6) construct in M9 minimal medium supplemented with 20 mM glycerol uninduced (left) or induced with 0.5 mM IPTG at OD680 0.4–0.6 (right) and grown for the given further length of time, from 0.1 to 22 h. The arrows indicate the position of the amplified PucI(His6) protein. M, Molecular mass markers.
Fig. 3.
Evolutionary relationships of PucI with NCS-1 family transporters. Phylogenetic tree showing evolutionary relationships of PucI from B. subtilis (P94575) with experimentally characterized bacterial, fungal (Fur-type and Fcy-type) and plant NCS-1 family transport proteins. The NCS-1 proteins are: Mhp1 from M. liquefaciens (D6R8X8), CodB from E. coli (P0AA82), FurA from Asp. nidulans (Q5BFM0), FurD from Asp. nidulans (A6N844), FurE from Asp. nidulans (Q5ATG4), Fur4 from Sac. cerevisiae (P05316), Dal4 from Sac. cerevisiae (Q04895), Fui1 from Sac. cerevisiae (P38196), FcyB from Asp. nidulans (C8V329), Fcy2 from Sac. cerevisiae (P17064), Thi7 from Sac. cerevisiae (Q05998), Tpn1 from Sac. cerevisiae (P53099), Nrt1 from Sac. cerevisiae (Q08485), AtNCS1 (PLUTO) from Ara. thaliana (Q9LZD0), CrNCS1 from C. reinhardtii (A8J166), ZmNCS1 from Z. mays (B4FJ20), SvNCS1 from Set. viridis (V9SBV7). Protein sequences were taken from the UniProt KnowledgeBase (
/) and aligned using the online multiple sequence alignment tool
clustal
Omega (
http://www.ebi.ac.uk/Tools/msa/clustalo/
; Sievers et al., 2011). The resultant neighbour-joining phylogenetic tree was exported in Newick format and drawn using the online tool Phylodendron (
http://iubio.bio.indiana.edu/treeapp/treeprint-form.html
). The overall sequence homology (percentage of identical plus highly similar residues) of PucI with Mhp1 and with each group of proteins is given in parentheses. These values were calculated from the sequence alignments shown in Figs S3, S4 and S5.
Fig. 4.
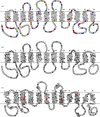
Putative membrane topology of the PucI protein from B. subtilis and conserved residues shared with bacterial putative allantoin permeases and with the hydantoin transport protein Mhp1 from M. liquefaciens. (a, b) The putative membrane topology of the PucI protein (Bsu3645, P94575, ALLP_BACSU) from B. subtilis (strain 168) based on analyses of its sequence using the membrane topology prediction tools
tmhmm
server v. 2.0 (
http://www.cbs.dtu.dk/services/TMHMM/
; Krogh et al., 2001) and
topcons
consensus prediction server (
; Bernsel et al., 2009) (Fig. S6). The putative 12 transmembrane-spanning α-helices are drawn from the N- to the C-terminal end left to right and labelled using roman numerals I–XII. (a) Colours highlight specific types of amino acid residue as follows: positively charged (arginine and lysine, red), negatively charged (aspartic acid and glutamic acid, blue), cysteine (yellow), tryptophan (pink), histidine (orange), proline (green). (b) Grey shading shows residues that are conserved between PucI from B. subtilis and 19 other proteins encoded by allP genes. (c) This diagram is based on an alignment between the sequences for PucI from B. subtilis and the hydantoin transport protein Mhp1 from M. liquefaciens and on the positions of helices in the crystal structure of Mhp1 with bound benzylhydantoin (PDB 4D1B; Simmons et al., 2014) (Fig. S3). Residues are shaded to show those that are conserved between PucI and
Mhp1. In
(b) and (c), identical residues are shown as dark grey and highly similar residues are pale grey. In (c), the red circles highlight residues identical with those in Mhp1 that are involved in direct binding interactions with the hydantoin substrate: Trp117, Gln121, Trp220, Asn318, Leu363.
Fig. 5.
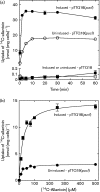
PucI-mediated 14C-allantoin uptake into energized whole cells. (a) Time-course of 14C-allantoin uptake. Uptake of 14C-allantoin (50 μM) at time points over 60 min into energized E. coli BL21(DE3) cells containing the empty plasmid pTTQ18 (squares) or the construct pTTQ18-pucI(His6) (circles) that were uninduced (white shapes) or induced with IPTG (black shapes). (b) Concentration dependence of initial rate PucI-mediated 14C-allantoin uptake. Michaelis–Menten plots for the uptake of 14C-allantoin at concentrations up to 500 μM after 15 s into energized E. coli BL21(DE3) cells containing the construct pTTQ18-pucI(His6) that were uninduced (black circles) or induced with IPTG (black squares). The plot for induced cells was analysed by a least-squares fit to obtain values for the apparent affinity of initial-rate transport (K mapp) and the maximum velocity (V max) of 24.4 ± 3 μM and 14.8 nmol (mg cells)− 1, respectively. For all measurements, cells were cultured in minimal medium with 20 mM glycerol and induced at OD680 0.4–0.6 with 0.5 mM IPTG for 1 h. Harvested cells were washed three times with assay buffer (150 mM KCl, 5 mM MES, pH 6.6) and resuspended to an OD680 of 2.0. Cells were energized with 20 mM glycerol and bubbled air for 3 min, followed by incubation with 14C-allantoin at the given concentrations and removal of aliquots for analysis at the given times. The data points represent the mean of triplicate measurements and the error bars represent
sem
s.
Fig. 6.
Competition of PucI-mediated 14C-allantoin uptake into energized whole cells by unlabelled compounds. Relative uptake (%) of 14C-allantoin (50 μM) after 15 s and 2 min into energized E. coli BL21(DE3) cells containing the construct pTTQ18-pucI(His6) that were induced with IPTG in the presence of a number of unlabelled competing compounds (500 μM). Cells were cultured in minimal medium with 20 mM glycerol and induced at OD680 0.4–0.6 with 0.5 mM IPTG for 1 h. Harvested cells were washed three times with assay buffer (150 mM KCl, 5 mM MES, pH 6.6) and resuspended to an OD680 of 2.0. Cells were energized with 20 mM glycerol and bubbled air for 3 min followed by incubation with 14C-allantoin (50 μM) and removal of aliquots for analysis after 15 s and 2 min. Unlabelled competing compounds (500 μM) were introduced prior to the energization period. The non-competed uptake rate was taken as 100 % corresponding to 14.6 and 30.4 nmol 14C-allantoin (mg cells)− 1 for 15 s and 2 min post addition of 14C-allantoin, respectively. Final uptake samples contain 2 % DMSO or no DMSO for the control sample (denoted by ‘None’ in the figure). The data points represent the mean of duplicate measurements. Structures of many of the compounds are shown in Fig. S9.
Fig. 7.
Ligand binding site in a homology model of PucI. (a) Homology model of PucI (green carbon atoms) docked with (S)-allantoin (PDBeChem 3AL) superimposed with the crystal structure of the Mhp1-benzylhydantoin complex (PDB 4D1B; Simmons et al., 2014; yellow carbon atoms) highlighting key differences in the ligand binding site of PucI. (b) PucI protein interactions with allantoin represented by LigPlot+ (
http://www.ebi.ac.uk/thornton-srv/software/LigPlus/
; Laskowski & Swindells, 2011). Residues are labelled accordingly to the PucI protein.
Similar articles
- The hydantoin transport protein from Microbacterium liquefaciens.
Suzuki S, Henderson PJ. Suzuki S, et al. J Bacteriol. 2006 May;188(9):3329-36. doi: 10.1128/JB.188.9.3329-3336.2006. J Bacteriol. 2006. PMID: 16621827 Free PMC article. - Molecular basis of alternating access membrane transport by the sodium-hydantoin transporter Mhp1.
Shimamura T, Weyand S, Beckstein O, Rutherford NG, Hadden JM, Sharples D, Sansom MS, Iwata S, Henderson PJ, Cameron AD. Shimamura T, et al. Science. 2010 Apr 23;328(5977):470-3. doi: 10.1126/science.1186303. Science. 2010. PMID: 20413494 Free PMC article. - A systematic approach to the amplified expression, functional characterization and purification of inositol transporters from Bacillus subtilis.
Bettaney KE, Sukumar P, Hussain R, Siligardi G, Henderson PJ, Patching SG. Bettaney KE, et al. Mol Membr Biol. 2013 Feb;30(1):3-14. doi: 10.3109/09687688.2012.729093. Epub 2012 Oct 18. Mol Membr Biol. 2013. PMID: 23078035 - From membrane to molecule to the third amino acid from the left with a membrane transport protein.
Kaback HR, Wu J. Kaback HR, et al. Q Rev Biophys. 1997 Nov;30(4):333-64. doi: 10.1017/s0033583597003387. Q Rev Biophys. 1997. PMID: 9634651 Review.
Cited by
- A novel expression vector for the secretion of abaecin in Bacillus subtilis.
Li L, Mu L, Wang X, Yu J, Hu R, Li Z. Li L, et al. Braz J Microbiol. 2017 Oct-Dec;48(4):809-814. doi: 10.1016/j.bjm.2017.01.009. Epub 2017 Jun 3. Braz J Microbiol. 2017. PMID: 28651889 Free PMC article. - Characterisation of the DAACS Family Escherichia coli Glutamate/Aspartate-Proton Symporter GltP Using Computational, Chemical, Biochemical and Biophysical Methods.
Rahman M, Ismat F, Jiao L, Baldwin JM, Sharples DJ, Baldwin SA, Patching SG. Rahman M, et al. J Membr Biol. 2017 Apr;250(2):145-162. doi: 10.1007/s00232-016-9942-x. Epub 2016 Dec 26. J Membr Biol. 2017. PMID: 28025687 - Impacts of feeding preweaned calves milk containing drug residues on the functional profile of the fecal microbiota.
Pereira RVV, Carroll LM, Lima S, Foditsch C, Siler JD, Bicalho RC, Warnick LD. Pereira RVV, et al. Sci Rep. 2018 Jan 11;8(1):554. doi: 10.1038/s41598-017-19021-2. Sci Rep. 2018. PMID: 29323259 Free PMC article. Clinical Trial. - Integrative analysis of microbiota and metabolomics in chromium-exposed silkworm (Bombyx mori) midguts based on 16S rDNA sequencing and LC/MS metabolomics.
Chen YZ, Rong WT, Qin YC, Lu LY, Liu J, Li MJ, Xin L, Li XD, Guan DL. Chen YZ, et al. Front Microbiol. 2023 Oct 25;14:1278271. doi: 10.3389/fmicb.2023.1278271. eCollection 2023. Front Microbiol. 2023. PMID: 37954243 Free PMC article.
References
- Beier L., Nygaard P., Jarmer H., Saxild H. H. (2002). Transcription analysis of the Bacillus subtilis PucR regulon and identification of a cis-acting sequence required for PucR-regulated expression of genes involved in purine catabolism J Bacteriol 184 3232–3241 10.1128/JB.184.12.3232-3241.2002 . - DOI - PMC - PubMed
- Bettaney K. E., Sukumar P., Hussain R., Siligardi G., Henderson P. J., Patching S. G. (2013). A systematic approach to the amplified expression, functional characterization and purification of inositol transporters from Bacillus subtilis Mol Membr Biol 30 3–14 10.3109/09687688.2012.729093 . - DOI - PubMed
MeSH terms
Substances
Grants and funding
- BB/C51725X/1/BB_/Biotechnology and Biological Sciences Research Council/United Kingdom
- BB/D524832/1/BB_/Biotechnology and Biological Sciences Research Council/United Kingdom
- BB/G020043/1/BB_/Biotechnology and Biological Sciences Research Council/United Kingdom
LinkOut - more resources
Full Text Sources
Other Literature Sources
Molecular Biology Databases


