Inbreeding depression across the lifespan in a wild mammal population - PubMed (original) (raw)
Inbreeding depression across the lifespan in a wild mammal population
Jisca Huisman et al. Proc Natl Acad Sci U S A. 2016.
Abstract
Inbreeding depression is of major concern for the conservation of threatened species, and inbreeding avoidance is thought to be a key driver in the evolution of mating systems. However, the estimation of individual inbreeding coefficients in natural populations has been challenging, and, consequently, the full effect of inbreeding on fitness remains unclear. Genomic inbreeding coefficients may resolve the long-standing paucity of data on inbreeding depression in adult traits and total fitness. Here we investigate inbreeding depression in a range of life history traits and fitness in a wild population of red deer (Cervus elaphus) in Scotland using individual inbreeding coefficients derived from dense Single-Nucleotide Polymorphism (SNP) data (Fgrm). We find associations between[Formula: see text]and annual breeding success in both sexes, and between maternal inbreeding coefficient and offspring survival. We also confirm previous findings of inbreeding depression in birth weight and juvenile survival. In contrast, inbreeding coefficients calculated from a deep and comparatively complete pedigree detected inbreeding depression in juvenile survival, but not in any adult fitness component. The total effect of inbreeding on lifetime breeding success (LBS) was substantial in both sexes: for Fgrm = 0.125, a value resulting from a half-sib mating, LBS declined by 72% for females and 95% for males. Our results demonstrate that SNP-based estimates of inbreeding provide a powerful tool for evaluating inbreeding depression in natural populations, and suggest that, to date, the prevalence of inbreeding depression in adult traits may have been underestimated.
Keywords: Single-Nucleotide Polymorphism; adult traits; fitness; parental inbreeding; red deer.
Conflict of interest statement
The authors declare no conflict of interest.
Figures
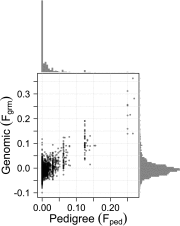
Fig. 1.
Pedigree and genomic inbreeding coefficients for n= 1,968 individuals for whom both measures were available, including individuals with at least both parents and the maternal grandfather known for Fped (see Results, Level of Inbreeding); r=0.74, β±SE=0.886±0.018. Histograms show the distributions of Fped (top) and Fgrm (right). At Fped =0.125, the scatter of Fgrm is in line with the theoretical distribution of realized inbreeding coefficients for a mating between half-siblings [2.5–97.5 percentile: 0.05–0.20 (13); based on a human genome, which is of similar total length as the red deer genome].
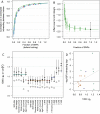
Fig. S1.
(A) Minor allele frequencies of the 37,292 autosomal SNPs that passed quality control; (B) the distribution of putative physical distance between neighboring SNPs; and (C) the decay of LD (r2) with putative distance. Pairwise LD is calculated with the 10 nearest neighbors of each SNP, and averages per bin spanning 5 kb are shown, with error bars indicating 1 SE.
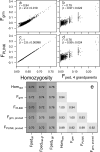
Fig. S2.
Relationships between inbreeding estimated as Fgrm (A and B) or FPLINK (C and D) and average SNP homozygosity (A and C, n = 2,248) or pedigree inbreeding for individuals with all four grandparents known (B and D, n = 1,198). Correlations (r) between a wider range of estimators are given in E, with a pairwise sample size of n = 2,248 between all genomic estimators, n = 1944 between genomic estimators and Fpedmat gf (both parents plus maternal grandfather known), and n = 1,198 between genomic estimators and Fped4 gp. “Pruned” refers to using a subset of about 90% of SNPs after pruning on LD (details in SI Materials and Methods).
Fig. S3.
(A) Correlations between average marker homozygosity (red), Fgrm (green), and FPLINK (blue) calculated within the two halves of SNP subsets of increasing size, using 50 replicates for each subset (details in SI Materials and Methods). (B) Estimated effect size for birth weight, using individual Fgrm calculated in each SNP subset as the explanatory variable. Vertical error bar shows 1 SE around the estimate when all SNPs are used. In A and B, curves show nonlinear least square regressions of type y=cx/(1+dx), with, in A, c=d=14.92 for homozygosity, 14.96 for FPLINK, and 20.27 for Fgrm and, in B, c=−89.7 and d=38.0. (C) Identity disequilibrium g2 calculated in various data subsets using the approach in ref. (black dots; error bars show 95% CI from 200 boostrap replications), and variance in Fgrm (gray) or Fped (white). Horizontal colored lines denote averages for juveniles (green), mothers (brown), adult females (red), and adult males (blue). (D) Relationship between − log10 P values of estimated inbreeding depression (depr.) in the traits considered, using Fgrm, and g2 values (black dots in C), using the same color coding as the horizontal lines in C; LBS is omitted. The gray regression line is given by β=3.05±1.8 (P=0.11, adj. r2=0.10), and the horizontal line indicates P=0.05.
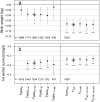
Fig. S4.
Comparison between estimated effect sizes of inbreeding depression using different ancestry thresholds (Left) or different genomic inbreeding estimators (Right) in models for two traits known to show inbreeding depression, birth weight (A) and first winter survival (B; birth weight accounted for). Each estimator was scaled to have an SD of 1 before fitting the model, for this comparison only, and no maternal inbreeding coefficients were fitted; models are otherwise identical to those used in the main text. The pedigree and genomic estimators used in the main text are indicated by open diamonds. Sample sizes are given for each model, and all models with genomic estimators have the same sample size. Asterisks denote standard levels of significance. The subset of individuals with both parents and at least one grandparent known is omitted, as it was identical to the subset with both parents known. The model for first winter survival using Fped including all individuals (Fpedall) failed to converge. “Pruned” refers to using a subset of about 90% of SNPs after pruning on LD (details in SI Materials and Methods).
Fig. 2.
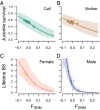
The relationship between Fgrm and juvenile survival and LBS. Survival from birth to age 2 y decreases with the genomic inbreeding coefficient Fgrm of the offspring (A), as well as with Fgrm of the mother (B), and LBS decreases with Fgrm in both females (C) and males (D). Points show observations, grouped into seven bins using the septiles among newborns (−0.029, −0.018, −0.010, −0.002, 0.007, and 0.020), with point sizes proportional to number of observations in each bin, and error bars indicating 1 SE around the mean. Lines show the fitted models, and shaded areas show the 95% CI; estimated slopes and SEs are given in Table 1. Fgrm ranged from −0.10 to 0.36 among neonates, and from −0.10 to 0.19 among adults.
Fig. S5.
Means (A) and SDs (B) of inbreeding coefficients and number of individuals (C) at each age in females (light red lines) and males (dark blue, immigrants are excluded), for Fped (dashed lines) and Fgrm (solid lines). The erratic patterns of mean and variance at older ages are due to limited sample size for those age classes. Points indicate the respective values among mothers, for _F_ped (white) and _F_grm (black).
Fig. S6.
(A) Estimated slopes and 95% CIs of trait values on Fped (brown) and Fgrm (green) of the focal individual (diamonds) or its mother (asterisks), on datascale (M1, M2), log scale (M7, M11), or logit scale (M3–M6, M8–M10). For the hurdle Poisson models (M12–M14), the effect of F on the hurdle is denoted by open diamonds, and, on the truncated Poisson, is denoted by filled diamonds. B_−_D show, for M6 (B for focal and C for mother) and M11 (D), the estimated slopes when Fped or Fgrm is fitted in a smaller dataset, in which both metrics are known for all individuals (middle bars, gray shaded area), compared with the larger datasets in which either Fped (outer left) or Fgrm (outer right) is known (these are identical to the bars in A). Sample sizes are given under each bar, and asterisks indicate standard levels of significance.
Similar articles
- Estimating selection on the act of inbreeding in a population with strong inbreeding depression.
Troianou E, Huisman J, Pemberton JM, Walling CA. Troianou E, et al. J Evol Biol. 2018 Dec;31(12):1815-1827. doi: 10.1111/jeb.13376. Epub 2018 Oct 16. J Evol Biol. 2018. PMID: 30230082 Free PMC article. - Inbreeding depression influences lifetime breeding success in a wild population of red deer (Cervus elaphus).
Slate J, Kruuk LE, Marshall TC, Pemberton JM, Clutton-Brock TH. Slate J, et al. Proc Biol Sci. 2000 Aug 22;267(1453):1657-62. doi: 10.1098/rspb.2000.1192. Proc Biol Sci. 2000. PMID: 11467429 Free PMC article. - Genomic analysis reveals depression due to both individual and maternal inbreeding in a free-living mammal population.
Bérénos C, Ellis PA, Pilkington JG, Pemberton JM. Bérénos C, et al. Mol Ecol. 2016 Jul;25(13):3152-68. doi: 10.1111/mec.13681. Epub 2016 Jun 6. Mol Ecol. 2016. PMID: 27135155 Free PMC article. - Inbreeding depression in non-human primates: a historical review of methods used and empirical data.
Charpentier MJ, Widdig A, Alberts SC. Charpentier MJ, et al. Am J Primatol. 2007 Dec;69(12):1370-86. doi: 10.1002/ajp.20445. Am J Primatol. 2007. PMID: 17486606 Review. - Genomics advances the study of inbreeding depression in the wild.
Kardos M, Taylor HR, Ellegren H, Luikart G, Allendorf FW. Kardos M, et al. Evol Appl. 2016 Oct 23;9(10):1205-1218. doi: 10.1111/eva.12414. eCollection 2016 Dec. Evol Appl. 2016. PMID: 27877200 Free PMC article. Review.
Cited by
- Extra Territorial Excursions by European badgers are not limited by age, sex or season.
Kelly DJ, Gaughran A, Mullen E, MacWhite T, Maher P, Good M, Marples NM. Kelly DJ, et al. Sci Rep. 2020 Jun 15;10(1):9665. doi: 10.1038/s41598-020-66809-w. Sci Rep. 2020. PMID: 32541685 Free PMC article. - Meiotic recombination shapes precision of pedigree- and marker-based estimates of inbreeding.
Knief U, Kempenaers B, Forstmeier W. Knief U, et al. Heredity (Edinb). 2017 Mar;118(3):239-248. doi: 10.1038/hdy.2016.95. Epub 2016 Nov 2. Heredity (Edinb). 2017. PMID: 27804967 Free PMC article. - Estimating selection on the act of inbreeding in a population with strong inbreeding depression.
Troianou E, Huisman J, Pemberton JM, Walling CA. Troianou E, et al. J Evol Biol. 2018 Dec;31(12):1815-1827. doi: 10.1111/jeb.13376. Epub 2018 Oct 16. J Evol Biol. 2018. PMID: 30230082 Free PMC article. - The role of selection and evolution in changing parturition date in a red deer population.
Bonnet T, Morrissey MB, Morris A, Morris S, Clutton-Brock TH, Pemberton JM, Kruuk LEB. Bonnet T, et al. PLoS Biol. 2019 Nov 5;17(11):e3000493. doi: 10.1371/journal.pbio.3000493. eCollection 2019 Nov. PLoS Biol. 2019. PMID: 31689300 Free PMC article. - Detailed insights into pan-European population structure and inbreeding in wild and hatchery Pacific oysters (Crassostrea gigas) revealed by genome-wide SNP data.
Vendrami DLJ, Houston RD, Gharbi K, Telesca L, Gutierrez AP, Gurney-Smith H, Hasegawa N, Boudry P, Hoffman JI. Vendrami DLJ, et al. Evol Appl. 2018 Dec 31;12(3):519-534. doi: 10.1111/eva.12736. eCollection 2019 Mar. Evol Appl. 2018. PMID: 30847007 Free PMC article.
References
- Keller L, Waller D. Inbreeding effects in wild populations. Trends Ecol Evol. 2002;17(5):230–241.
- Charlesworth D, Charlesworth B. Inbreeding depression and its evolutionary consequences. Annu Rev Ecol Syst. 1987;18:237–268.
- Frankham R, Briscoe D, Ballou J. Introduction to Conservation Genetics. Cambridge Univ Press; New York: 2002.
- Mc Parland S, Kearney JF, Rath M, Berry DP. Inbreeding effects on milk production, calving performance, fertility, and conformation in Irish Holstein-Friesians. J Dairy Sci. 2007;90(9):4411–4419. - PubMed
Publication types
MeSH terms
LinkOut - more resources
Full Text Sources
Other Literature Sources
