Visualization of immediate immune responses to pioneer metastatic cells in the lung - PubMed (original) (raw)
. 2016 Mar 24;531(7595):513-7.
doi: 10.1038/nature16985. Epub 2016 Mar 16.
Affiliations
- PMID: 26982733
- PMCID: PMC4892380
- DOI: 10.1038/nature16985
Visualization of immediate immune responses to pioneer metastatic cells in the lung
Mark B Headley et al. Nature. 2016.
Abstract
Lung metastasis is the lethal determinant in many cancers and a number of lines of evidence point to monocytes and macrophages having key roles in its development. Yet little is known about the immediate fate of incoming tumour cells as they colonize this tissue, and even less known about how they make first contact with the immune system. Primary tumours liberate circulating tumour cells (CTCs) into the blood and we have developed a stable intravital two-photon lung imaging model in mice for direct observation of the arrival of CTCs and subsequent host interaction. Here we show dynamic generation of tumour microparticles in shear flow in the capillaries within minutes of CTC entry. Rather than dispersing under flow, many of these microparticles remain attached to the lung vasculature or independently migrate along the inner walls of vessels. Using fluorescent lineage reporters and flow cytometry, we observed 'waves' of distinct myeloid cell subsets that load differentially and sequentially with this CTC-derived material. Many of these tumour-ingesting myeloid cells collectively accumulated in the lung interstitium along with the successful metastatic cells and, as previously understood, promote the development of successful metastases from surviving tumour cells. Although the numbers of these cells rise globally in the lung with metastatic exposure and ingesting myeloid cells undergo phenotypic changes associated with microparticle ingestion, a consistently sparse population of resident conventional dendritic cells, among the last cells to interact with CTCs, confer anti-metastatic protection. This work reveals that CTC fragmentation generates immune-interacting intermediates, and defines a competitive relationship between phagocyte populations for tumour loading during metastatic cell seeding.
Figures
Extended Data Figure 1. Loading of lung immune cells by prospective metastatic B16 melanoma
a, Schema for assessing immune cell loading by i.v.-injected B16ZsGreen cells. b, Representative plots of ZsGreen+ populations in the lungs of mice injected with B16ZsGreen over the first 24 h following injection. Data are gated on the basis of expression of the immune cell marker CD45. c, Quantification of b with n = 6 per group, error bars are standard deviation. d, Confocal imaging of CD45+ZsGreen+ cells sorted from a lung digest from a ubiquitous membrane-bound TdTomato fluorescent mouse 24 h after i.v. injection with B16ZsGreen.
Extended Data Figure 2. Intercostal insertion window for lung intravital microscopy
a, Top, side, and bottom views of the intercostal insertion window. The window accommodates an 8 mm coverslip and allows for visualization of a 4 mm field of the left lung lobe. b–e, Images detailing surgical insertion of the intercostal window. b, Mouse is intubated, attached to ventilator, and placed in right lateral decubitis position and surgical field is shaved. c, An ~6 mm incision is made immediately above ribs 4 and 5 over the anterior surface of left lung lobe. d, The intercostal window is slipped between ribs 4 and 5, and attached to a rigid support. e, Around 20 mm Hg of vacuum suction is applied to the window to secure a small portion of lung to the coverglass. f, Schema showing approach for two-photon intravital microscopy of lung seeding by B16ZsGreen cells.
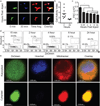
Extended Data Figure 3. Assessment of tumour cell activity and cytoplast characterization
a, Binarized maximum intensity projections of representative cells at 2 or 24 h after injection. Cells were time-projected over a 30 min window to assess overall cellular activity during the interval. Images show the beginning time point (0 min), the ending time point (30 min), the time projection, and the overlay. White-filled space in the overlay represents the region of the cell that was stable during the analysed interval. These data are associated with Supplementary Video 3. These data are representative from imaging performed in 3 mice. b, Quantification of the cell activity index (defined as the area calculated from the projection of all positions over time as a ratio of the common area over all time (for example, area of overlap)) from analysis in d (n = 10 cells per group, horizontal bars are mean value). c, Flow cytometric quantification of FSC for tumour cells isolated from lung via digestion at 15 min, 2 h, 4 h, 6 h, and 24 h after injection. *P < 0.05, one-way ANOVA with Bonferroni post-hoc test, error bars are standard deviation. d, Representative data from flow cytometric discrimination of nucleated karyoplasts and anucleate cytoplasts derived from B16ZsGreen tumour cells in the lung in vivo over a 24 h time course, full data set quantified in Fig. 1e. e, confocal analysis of Hoechst and Mitotracker-labelled B16ZsGreen karyoplasts and cytoplasts sorted from in vitro culture of B16ZsGreen cells.
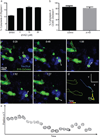
Extended Data Figure 4. Autonomous motility of cytoplasts in vivo
a. Flow cytometric quantification of cytoplasts in vitro following 24 h treatment with Z-VAD at indicated concentrations. b. Flow cytometric quantification of cytoplasts in vivo from lung digests of mice treated with 10 µg Z-VAD i.v at the time of injection with 2.5 × 10⁵ B15ZsGreen cells (a and b n = 4 per group; no significant difference detected between groups, unpaired _t_-test, error bars are standard deviation). c, Image series for B16ZsGreen cytoplast migrating autonomously through the lung microvasculature of a MacBlue host. Arrows represent the direction of the trajectory of the cytoplast at indicated time point. These data are associated with Supplementary Video 6. These data are representative of imaging collected from at least 12 mice. d, Representative tracking of a cytoplast from Supplementary Video 6 (and Extended Data Fig. 4c). e, A superposition image of 23 consecutive time points of a cytoplast migrating through lung microvasculature. Image shows the change in position in the Y-axis of direction as defined in d at each subsequent timepoint as the cytoplast migrates up and down the vessel.
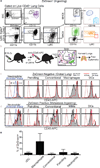
Extended Data Figure 5. Characterization of tumour-interacting myeloid cell waves
a, Representative gating for total lung myeloid populations. b, Schema detailing method for discrimination of intravascular versus extravascular localization of lung myeloid populations. c, d, Representative histograms of intravascular CD45 staining used to discriminate between intravascular and extravascular localization of lung myeloid cells at 4 and 24 h after injection with B16ZsGreen. Data quantified in Fig. 3d. In the leftmost panels, alveolar macrophages at 24 h after tumour injection are shown as a known control for extravascular staining. c, Total lung myeloids. d, ZsGreen+ myeloid cells. e, Quantification ZsGreen+ myeloid populations by flow cytometry in lungs of mice bearing 2-week subdermal B16ZsGreen tumours, _n_=4 per group, error bars are standard deviation.
Extended Data Figure 6. Stimulatory capacity of CD103+ DCs in lung-draining lymph node
a, CD69 vs Nur77-GFP expression 24 h after culture from ex vivo coculture of OT-I TCR transgenic CD8+ T cells with sorted APCs from mLNs, where the latter were isolated 72 h post-injection with B16ZsGreenSL8. b, Quantification of a. c, Dilution of SE670 as an index of proliferation 72 h after culture with indicated APC populations. d, Quantification of c. n = 6 (b) or 6–12 (d) per group from 2 experiments; *P < 0.05, one-way ANOVA with Bonferroni post-hoc test, horizontal bars are mean value.
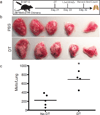
Extended Data Figure 7. cDCs confer anti-metastatic activity in the presence of a primary tumour
a, Experimental schema for evaluation of role of cDCs in lung metastasis in the presence of a primary tumour. b, Representative images of lungs from Zbtb46-DTR bone marrow chimaeras treated with PBS or DT after implantation of a primary subdermal tumour (1 × 10⁵ B16F10 in matrigel) and i.v. metastases (1.5 × 10⁵ B16ZsGreen). Metastases were assessed one week after i.v. injection. c, Quantification of total number of visible ZsGreen+ lung metastases in PBS- or DT-treated Zbtb46-DTR bone marrow chimaeras. n = 4–5 per group, representative of 2 experiments; *P < 0.05, unpaired _t_-test, horizontal bars are mean value.
Figure 1. Intravital imaging of the first hours of lung seeding by B16 melanoma
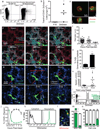
a, Representative plots of CD45+ZSgreen+ cells in lungs of mice bearing 2-week primary B16 melanoma tumours with or without ZsGreen expression. Alveolar macrophages were excluded, as auto-fluorescent signal interfered with ZsGreen discrimination. b, Absolute number of CD45+ZsGreen+ and CD45−ZsGreen+ cells in lungs from a. *P = 0.0421 by unpaired _t_-test, horizontal bars represent mean value. c, Confocal imaging of sorted CD45+ZsGreen+ cells from lungs of mTmG mouse (ubiquitous expression of membrane-bound TdTomato) bearing tumours as per a. Red, TdTomato; green, ZsGreen. d, e, LIVM after i.v. injection of Hoechst-labelled B16ZsGreen cells into mTmG mice with Evan’s Blue labelling vascular flow (see also Supplementary Video 1) (d). LIVM Hoechst-labelled B16ZsGreen cells from 15 min to 9 h after i.v. injection into actin–CFP recipient (see also Supplementary Video 2) (e). White arrows highlight the formation of cytoplasmic blebs (cytoplasts) and red arrows highlight regions of membrane activity (extension or retraction). Representative of at least 10 mice. f, Cytoplast diameter at 0–5 h, 5–10 h and >24 h after injection, horizontal bars are mean values. g, Percent cytoplast producing B16ZsGreen cells from non-shear (slice imaging) or shear (LIVM) (15 cells per group from 3 mice; *P = 0.002 by unpaired _t_-test, error bars are standard deviation). h, Cytoplast speed in non-shear or shear conditions as f (15 cytoplasts per group in 3 mice; *P = 0.036, unpaired _t_-test, horizontal bars are mean values). i, Gating strategy for karyoplast and cytoplast discrimination within lung single-cell suspension. j, In vivo mean cytoplast and karyoplast frequency in lung (n = 6 per group), error bars are standard deviation. k, Mitotracker staining of cytoplasts and karyoplasts. l, LIVM of mitotracker labelled B16ZsGreen cells. m, In vivo cytoplast frequency in lung 2 h after injection of primary-isolated B16ZsGreen cells or mock injected. Green, karyoplasts; white, cytoplasts. n = 4 per group, error bars are standard deviation. n, In vivo cytoplast frequency 2 h after injection of B16ZsGreen, murine breast tumour (PyMT-B), human breast tumour (MDA-MB-231), and non-transformed primary mouse embryonic fibroblasts (n = 3 per group from 2 experiments, error bars are standard deviation.)
Figure 2. Encounter and uptake of tumour-derived cytoplasts by lung myeloid cells
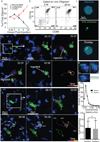
a, Frequencies of cytoplasts, karyoplasts, and CD45+ZsGreen+ cells in the lung over 24 h (n = 6 per group). b, Flow cytometry of CD11b+CD45+ cells in total ZsGreen+ population 2 and 24 h after injection. c, Confocal imaging of CD45+ZsGreen+ cells from MacBlue mice 24 h after injection. d, LIVM of cytoplast phagocytosis by a CFP+ myeloid cell (see also Supplementary Video 7). Green, karyoplasts; white, cytoplasts; red, cytoplast ingesting cell. Rightmost panel shows tracking data for a subset of cells. Representative of 5 mice. e, xy, yz and xz renders of CFP+ from d. f, LIVM of CFP+ cell targeting cytoplast (see also Supplementary Video 8). Colours and tracking as in d. Tracked cells labelled as cell 1, 2 or 3 in f for comparison with tracks. Representative of 5 mice. g, Speed of cytoplast-ingesting and non-ingesting cells. h, Track straightness of cytoplast-ingesting and non-ingesting cells. Data from 75 non-ingesting and 10 ingesting cells from 4 mice, error bars are standard deviation.
Figure 3. Discrete waves of cytoplast loaded myeloid cells define the early metastatic niche
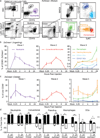
a, Gating strategy for total lung myeloid populations. b, Frequency of tumour-ingesting myeloid cells in the lung over 24 h following i.v. injection with B16ZsGreen (n = 6, error bars are standard deviation). c, Frequency of myeloid cells in total lung cells over 24 h following i.v. injection with B16ZsGreen (n = 6). d, Frequency of intravascular versus extravascular myeloid populations at 4 or 24 h following i.v. injection of B16ZsGreen cells (n = 6 per group; *P < 0.05, two-way ANOVA with multiple comparison between row and column means, error bars are standard deviation).
Figure 4. Lung-resident dendritic cells inhibit metastasis of B16 melanoma
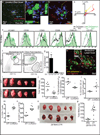
a, Maximum intensity projection of LIVM of B16ZsGreen tumour 24 h after injection into CD11c-mCherry, MacBlue host (see also Supplementary Video 9). Representative of 5 mice. b, High magnification showing tumour-loaded MacBlue+ cells in close interaction with B16ZsGreen cell at 24 h after injection. c, Representative image from time-lapse. Track overlays describe motion of tracked MacBlue+ cells over a period of ~1 h. d, Overlay of 10 tracks of MacBlue+ cells from c. e, Staining of ZsGreen+ and ZsGreen− macrophages 24 h after tumour injection (n = 4), ISO represents staining with isotype control antibody. f, Gating of lung-draining mLN 72 h after injection. Contour lines, total LN; green dots, ZsGreen+ cells. g, Frequency of CD8+, CD11b+ and CD103+ DCs in total ZsGreen+ cells in the mLN 72 h after injection. (n = 6; *P < 0.05, one-way ANOVA with Bonferroni post-hoc test, error bars are standard deviation). h, Representative image of ZsGreen+CD11c-mCherry+ APCs interacting with GFP-labelled OT-I T cells in a mLN 72 h after injection with B16ZsGreenSL8 (see also Supplementary Video 10). Inset highlights two ZsGreen-bearing CD11c+ cells in close interaction with OT-I T cells (n = 3 mice). i, Representative images of metastasis-bearing lungs from wild-type (WT) or CCR2-knockout (KO) mice 2 weeks after injection with B16ZsGreen. j, Total number of lung metastases (mets) in wild-type and CCR2-knockout mice 2 weeks after injection with B16ZsGreen (n = 7 per group; *P < 0.05, unpaired _t_-test, horizontal bars are mean values). k, Frequency of ZsGreen+ macrophages in lungs of wild-type and CCR2-knockout mice 24 h after injection with B16ZsGreen (n = 4 per group; *P < 0.05 by unpaired _t_-test, horizontal bars are mean values). l, Frequency of ZsGreen+ CD103+ cDCs in lungs of wild-type and CCR2-knockout mice 24 h after injection with B16ZsGreen (n = 4 per group; *P < 0.05, unpaired _t_-test, horizontal bars are mean values). m, n, Frequency (m) and absolute number (n) of CD8+ T cells in lungs of wild-type or CCR20-knockout mice from k (n = 4 per group; *P < 0.05, unpaired _t_-test, horizontal bars are mean values). o, Representative images of lungs from Zbtb46-DTR bone marrow chimaeras treated with phosphate buffered saline (PBS) or diphtheria toxin (DT). Lungs collected 2 weeks after injection with B16ZsGreen. p, Total number of lung metastases in PBS- or DT-treated Zbtb46-DTR bone marrow chimaeras 2 weeks after injection with B16ZsGreen (n = 5 for PBS and 10 for DT groups, respectively; *P < 0.05, unpaired _t_-test, horizontal bars are mean values).
Comment in
- Tumour immunology: Metastasis in action.
Bird L. Bird L. Nat Rev Immunol. 2016 May;16(5):277. doi: 10.1038/nri.2016.45. Epub 2016 Apr 18. Nat Rev Immunol. 2016. PMID: 27087662 No abstract available.
Similar articles
- Prophylactic Dendritic Cell-Based Vaccines Efficiently Inhibit Metastases in Murine Metastatic Melanoma.
Markov OV, Mironova NL, Sennikov SV, Vlassov VV, Zenkova MA. Markov OV, et al. PLoS One. 2015 Sep 1;10(9):e0136911. doi: 10.1371/journal.pone.0136911. eCollection 2015. PLoS One. 2015. PMID: 26325576 Free PMC article. - Tumour-mediated upregulation of chemoattractants and recruitment of myeloid cells predetermines lung metastasis.
Hiratsuka S, Watanabe A, Aburatani H, Maru Y. Hiratsuka S, et al. Nat Cell Biol. 2006 Dec;8(12):1369-75. doi: 10.1038/ncb1507. Epub 2006 Nov 26. Nat Cell Biol. 2006. PMID: 17128264 - Circulating and disseminated tumor cells from breast cancer patient-derived xenograft-bearing mice as a novel model to study metastasis.
Giuliano M, Herrera S, Christiny P, Shaw C, Creighton CJ, Mitchell T, Bhat R, Zhang X, Mao S, Dobrolecki LE, Al-rawi A, Chen F, Veneziani BM, Zhang XH, Hilsenbeck SG, Contreras A, Gutierrez C, Jeselsohn RM, Rimawi MF, Osborne CK, Lewis MT, Schiff R, Trivedi MV. Giuliano M, et al. Breast Cancer Res. 2015 Jan 9;17(1):3. doi: 10.1186/s13058-014-0508-5. Breast Cancer Res. 2015. PMID: 25572662 Free PMC article. - Circulating tumour cells, their role in metastasis and their clinical utility in lung cancer.
O'Flaherty JD, Gray S, Richard D, Fennell D, O'Leary JJ, Blackhall FH, O'Byrne KJ. O'Flaherty JD, et al. Lung Cancer. 2012 Apr;76(1):19-25. doi: 10.1016/j.lungcan.2011.10.018. Epub 2011 Dec 29. Lung Cancer. 2012. PMID: 22209049 Review. - The molecular biology of pulmonary metastasis.
Krishnan K, Khanna C, Helman LJ. Krishnan K, et al. Thorac Surg Clin. 2006 May;16(2):115-24. doi: 10.1016/j.thorsurg.2005.12.003. Thorac Surg Clin. 2006. PMID: 16805200 Review.
Cited by
- Neutrophils under the microscope: neutrophil dynamics in infection, inflammation, and cancer revealed using intravital imaging.
Yam AO, Jakovija A, Gatt C, Chtanova T. Yam AO, et al. Front Immunol. 2024 Oct 8;15:1458035. doi: 10.3389/fimmu.2024.1458035. eCollection 2024. Front Immunol. 2024. PMID: 39439807 Free PMC article. Review. - Circulating tumor cells in pancreatic cancer: more than liquid biopsy.
Li Z, Qin C, Zhao B, Li T, Zhao Y, Zhang X, Wang W. Li Z, et al. Ther Adv Med Oncol. 2024 Oct 9;16:17588359241284935. doi: 10.1177/17588359241284935. eCollection 2024. Ther Adv Med Oncol. 2024. PMID: 39421679 Free PMC article. Review. - Intravital imaging of pulmonary lymphatics in inflammation and metastatic cancer.
Cleary SJ, Qiu L, Seo Y, Baluk P, Liu D, Serwas NK, Cyster JG, McDonald DM, Krummel MF, Looney MR. Cleary SJ, et al. bioRxiv [Preprint]. 2024 Sep 17:2024.09.12.612619. doi: 10.1101/2024.09.12.612619. bioRxiv. 2024. PMID: 39345499 Free PMC article. Preprint. - Blood-Derived Extracellular Vesicles as a Promising Liquid Biopsy Diagnostic Tool for Early Cancer Detection.
He D, Cui B, Lv H, Lu S, Zhu Y, Cheng Y, Dang L, Zhang H. He D, et al. Biomolecules. 2024 Jul 14;14(7):847. doi: 10.3390/biom14070847. Biomolecules. 2024. PMID: 39062561 Free PMC article. Review. - Nuclear rupture induced by capillary constriction forces promotes differential effects on metastatic and normal breast cells.
Perea Paizal J, Au SH, Bakal C. Perea Paizal J, et al. Sci Rep. 2024 Jun 26;14(1):14793. doi: 10.1038/s41598-024-64733-x. Sci Rep. 2024. PMID: 38926422 Free PMC article.
References
- Nguyen DX, Bos PD, Massague J. Metastasis: from dissemination to organ-specific colonization. Nature Rev. Cancer. 2009;9:274–284. - PubMed
Publication types
MeSH terms
Grants and funding
- P01 HL024136/HL/NHLBI NIH HHS/United States
- T32 AI007334/AI/NIAID NIH HHS/United States
- R21CA167601/CA/NCI NIH HHS/United States
- U54 CA163123/CA/NCI NIH HHS/United States
- R21 CA167601/CA/NCI NIH HHS/United States
LinkOut - more resources
Full Text Sources
Other Literature Sources
Medical
Molecular Biology Databases


