Quantitative Gait Analysis Using a Motorized Treadmill System Sensitively Detects Motor Abnormalities in Mice Expressing ATPase Defective Spastin - PubMed (original) (raw)
Quantitative Gait Analysis Using a Motorized Treadmill System Sensitively Detects Motor Abnormalities in Mice Expressing ATPase Defective Spastin
James W Connell et al. PLoS One. 2016.
Abstract
The hereditary spastic paraplegias (HSPs) are genetic conditions in which there is progressive axonal degeneration in the corticospinal tract. Autosomal dominant mutations, including nonsense, frameshift and missense changes, in the gene encoding the microtubule severing ATPase spastin are the most common cause of HSP in North America and northern Europe. In this study we report quantitative gait analysis using a motorized treadmill system, carried out on mice knocked-in for a disease-associated mutation affecting a critical residue in the Walker A motif of the spastin ATPase domain. At 4 months and at one year of age homozygous mutant mice had a number of abnormal gait parameters, including in stride length and stride duration, compared to heterozygous and wild-type littermates. Gait parameters in heterozygous animals did not differ from wild-type littermates. We conclude that quantitative gait analysis using the DigiGait system sensitively detects motor abnormalities in a hereditary spastic paraplegia model, and would be a useful method for analyzing the effects of pharmacological treatments for HSP.
Conflict of interest statement
Competing Interests: The authors have declared that no competing interests exist.
Figures
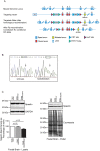
Fig 1. SpastinN384K/N384K knock-in mouse generation and validation.
A) Schematic diagram of strategy used to generate spastinN384K allele. Numbering refers to spastin exons. Puro = puromycin resistance cassette, Neo = neomycin resistance cassette, Flp = flippase, FRT = flippase recognition target, UTR = untranslated region. B) DNA sequencing of PCR product generated using primers designed to amplify fragment of spastin exon 8 from genomic DNA of a wild-type mouse and spastinN384K/N384K littermate. C) Immunoblotting versus spastin of lysate or pellet fraction from foetal brain tissue (E17), from mice of the genotypes indicated. The histogram shows corresponding densitometry of the spastin bands in the lysate (n = 3 per genotype, p-values generated by paired t-tests). GAPDH immunoblotting or Coomassie staining serve to verify equal loading of lanes. Size bars indicate molecular weight in kD.
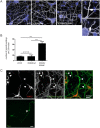
Fig 2. SpastinN384K/N384K mice develop axonal swellings.
A) Day 7 in vitro primary cortical neurons from animals with the genotypes indicated labeled with antibody to acetylated tubulin. DAPI staining (blue) was used to label nuclei. Examples of swellings seen in spastinN384K/N384K neurons are shown in the boxed areas, which are magnified in the right hand panels. B) Primary cortical neurons were labeled as in A) and the number of swellings per 250 nuclei was quantified in animals with the genotypes shown (n = 3 repeats per genotype). Mean number of swellings per 250 nuclei ± S.E.M.: spastwt/wt = 16.0 ± 1.53, spastN384K/wt = 16.3 ± 3.28 and for spastN384K/wt 62 ± 4.04. P-values were generated by 1-way ANOVA with Bonferroni post-test for comparison of individual pairs of genotypes. C) Day 7 in vitro primary cortical neurons from spastinN384K/N384K mice were labeled with the antibodies indicated. Swellings (arrowheads) were always MAP2 negative or tau positive, indicating that they were present in axons. Scale bars = 20μm.
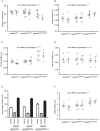
Fig 3. Weight and key left hindlimb gait parameters in spastinN384K/N384K mice versus littermate controls at 1 year old.
Plots show values for each animal tested with the genotypes indicated. Squares = male animals, circles = females. A) weight in grammes, B) stride duration, C) swing phase duration, D) stance phase duration. E) Histogram showing the mean percentage of time that tested animals with the genotypes indicated spent in each phase of gait. F) Stride length in animals with the genotypes shown. Error bars = mean ± S.E.M. Numerical p-values for corresponding statistical tests using two-way ANOVA for the effect of gender and genotype on gait parameters are shown in Table 2. To facilitate interpretation, p-values for genotype are indicated on the plots by * p<0.05, ** p<0.01, *** p<0.001, **** p<0.0001.
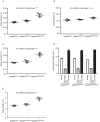
Fig 4. Key left hindlimb gait parameters in spastinN384K/N384K mice versus littermate controls at 4 months old.
Plots show values for each animal tested with the genotypes indicated. A) stride duration, B) swing phase duration, C) stance phase duration. D) Histogram showing the mean percentage of time that tested animals with the genotypes indicated spent in each phase of gait. E) Stride length in animals with the genotypes shown. Numerical values for corresponding statistical tests using one-way ANOVA for the effect of genotype on gait parameters are shown in Table 4. To facilitate interpretation, p-values for genotype are indicated on the plots by * p<0.05, ** p<0.01, *** p<0.001, **** p<0.0001. Error bars = mean ± S.E.M
Similar articles
- Direct evidence for axonal transport defects in a novel mouse model of mutant spastin-induced hereditary spastic paraplegia (HSP) and human HSP patients.
Kasher PR, De Vos KJ, Wharton SB, Manser C, Bennett EJ, Bingley M, Wood JD, Milner R, McDermott CJ, Miller CC, Shaw PJ, Grierson AJ. Kasher PR, et al. J Neurochem. 2009 Jul;110(1):34-44. doi: 10.1111/j.1471-4159.2009.06104.x. Epub 2009 Apr 22. J Neurochem. 2009. PMID: 19453301 - Hereditary spastic paraplegia SPG4: what is known and not known about the disease.
Solowska JM, Baas PW. Solowska JM, et al. Brain. 2015 Sep;138(Pt 9):2471-84. doi: 10.1093/brain/awv178. Epub 2015 Jun 20. Brain. 2015. PMID: 26094131 Free PMC article. Review. - Cold temperature improves mobility and survival in Drosophila models of autosomal-dominant hereditary spastic paraplegia (AD-HSP).
Baxter SL, Allard DE, Crowl C, Sherwood NT. Baxter SL, et al. Dis Model Mech. 2014 Aug;7(8):1005-12. doi: 10.1242/dmm.013987. Epub 2014 Jun 6. Dis Model Mech. 2014. PMID: 24906373 Free PMC article. - Loss of spastin function results in disease-specific axonal defects in human pluripotent stem cell-based models of hereditary spastic paraplegia.
Denton KR, Lei L, Grenier J, Rodionov V, Blackstone C, Li XJ. Denton KR, et al. Stem Cells. 2014 Feb;32(2):414-23. doi: 10.1002/stem.1569. Stem Cells. 2014. PMID: 24123785 Free PMC article. - The AAA ATPase spastin links microtubule severing to membrane modelling.
Lumb JH, Connell JW, Allison R, Reid E. Lumb JH, et al. Biochim Biophys Acta. 2012 Jan;1823(1):192-7. doi: 10.1016/j.bbamcr.2011.08.010. Epub 2011 Aug 25. Biochim Biophys Acta. 2012. PMID: 21888932 Review.
Cited by
- ESCRT-III-associated proteins and spastin inhibit protrudin-dependent polarised membrane traffic.
Connell JW, Allison RJ, Rodger CE, Pearson G, Zlamalova E, Reid E. Connell JW, et al. Cell Mol Life Sci. 2020 Jul;77(13):2641-2658. doi: 10.1007/s00018-019-03313-z. Epub 2019 Oct 5. Cell Mol Life Sci. 2020. PMID: 31587092 Free PMC article. - ACAD10 protein expression and Neurobehavioral assessment of Acad10-deficient mice.
Bloom K, Karunanidhi A, Tobita K, Hoppel C, Thiels E, Peet E, Wang Y, Basu S, Vockley J. Bloom K, et al. PLoS One. 2020 Dec 10;15(12):e0242445. doi: 10.1371/journal.pone.0242445. eCollection 2020. PLoS One. 2020. PMID: 33301490 Free PMC article. - Complexity of Generating Mouse Models to Study the Upper Motor Neurons: Let Us Shift Focus from Mice to Neurons.
Genc B, Gozutok O, Ozdinler PH. Genc B, et al. Int J Mol Sci. 2019 Aug 7;20(16):3848. doi: 10.3390/ijms20163848. Int J Mol Sci. 2019. PMID: 31394733 Free PMC article. Review. - Mechanistic basis of an epistatic interaction reducing age at onset in hereditary spastic paraplegia.
Newton T, Allison R, Edgar JR, Lumb JH, Rodger CE, Manna PT, Rizo T, Kohl Z, Nygren AOH, Arning L, Schüle R, Depienne C, Goldberg L, Frahm C, Stevanin G, Durr A, Schöls L, Winner B, Beetz C, Reid E. Newton T, et al. Brain. 2018 May 1;141(5):1286-1299. doi: 10.1093/brain/awy034. Brain. 2018. PMID: 29481671 Free PMC article. - Molecular and cellular mechanisms of spastin in neural development and disease (Review).
Liu Q, Zhang G, Ji Z, Lin H. Liu Q, et al. Int J Mol Med. 2021 Dec;48(6):218. doi: 10.3892/ijmm.2021.5051. Epub 2021 Oct 19. Int J Mol Med. 2021. PMID: 34664680 Free PMC article. Review.
References
- Reid E. The hereditary spastic paraplegias. J Neurol. 1999;246(11):995–1003. Epub 2000/01/13. . - PubMed
- Fink JK. Hereditary spastic paraplegia. Neurol Clin. 2002;20(3):711–26. Epub 2002/11/16. . - PubMed
- Harding AE. The hereditary ataxias and related disorders. Edinburgh: Churchill Livingston; 1984.
- Finsterer J, Loscher W, Quasthoff S, Wanschitz J, Auer-Grumbach M, Stevanin G. Hereditary spastic paraplegias with autosomal dominant, recessive, X-linked, or maternal trait of inheritance. Journal of the neurological sciences. 2012;318(1–2):1–18. Epub 2012/05/05. 10.1016/j.jns.2012.03.025 . - DOI - PubMed
Publication types
MeSH terms
Substances
Grants and funding
- MR/M00046X/1/MRC_/Medical Research Council/United Kingdom
- 093026/WT_/Wellcome Trust/United Kingdom
- 082381/WT_/Wellcome Trust/United Kingdom
- 100140/WT_/Wellcome Trust/United Kingdom
- WT_/Wellcome Trust/United Kingdom
LinkOut - more resources
Full Text Sources
Other Literature Sources
Molecular Biology Databases


