Extracellular Vesicles Isolated from the Brains of rTg4510 Mice Seed Tau Protein Aggregation in a Threshold-dependent Manner - PubMed (original) (raw)
Extracellular Vesicles Isolated from the Brains of rTg4510 Mice Seed Tau Protein Aggregation in a Threshold-dependent Manner
Juan Carlos Polanco et al. J Biol Chem. 2016.
Abstract
The microtubule-associated protein tau has a critical role in Alzheimer disease and related tauopathies. There is accumulating evidence that tau aggregates spread and replicate in a prion-like manner, with the uptake of pathological tau seeds causing misfolding and aggregation of monomeric tau in recipient cells. Here we focused on small extracellular vesicles enriched for exosomes that were isolated from the brains of tau transgenic rTg4510 and control mice. We found that these extracellular vesicles contained tau, although the levels were significantly higher in transgenic mice that have a pronounced tau pathology. Tau in the vesicles was differentially phosphorylated, although to a lower degree than in the brain cells from which they were derived. Several phospho-epitopes (AT8, AT100, and AT180) thought to be critical for tau pathology were undetected in extracellular vesicles. Despite this, when assayed with FRET tau biosensor cells, extracellular vesicles derived from transgenic mice were capable of seeding tau aggregation in a threshold-dependent manner. We also observed that the dye used to label extracellular vesicle membranes was still present during nucleation and formation of tau inclusions, suggesting either a role for membranes in the seeding or in the process of degradation. Together, we clearly demonstrate that extracellular vesicles can transmit tau pathology. This indicates a role for extracellular vesicles in the transmission and spreading of tau pathology. The characteristics of tau in extracellular vesicles and the seeding threshold we identified may explain why tau pathology develops very slowly in neurodegenerative diseases such as Alzheimer disease.
Keywords: Alzheimer disease; Tau protein (Tau); exosome (vesicle); phosphorylation; tauopathy.
© 2016 by The American Society for Biochemistry and Molecular Biology, Inc.
Figures
FIGURE 1.
Physical analysis of nanovesicles isolated from brains of P301L tau transgenic rTg4510 mice. Exosome-like EVs were isolated from the brain extracellular space according to Perez-Gonzalez et al. (20). A, transmission electron microscopy analysis of sucrose F1-F6 shows nanovesicles mostly in F2 (0.6
m
sucrose, ρ = 1.08g/ml) and F3 (0.95
m
sucrose, ρ = 1.12g/ml). Scale bars = 100 nm. B, tunable resistive pulse sensing using a qNano instrument (Izon). Concentration histograms of size distributions (sizes in nanometers versus particles per milliliter) are shown for each population in the different sucrose fractions (F1-F6). In agreement with transmission electron microscopy, the highest concentrations of nanovesicles were found in F2 (0.6
m
) and F3 (0.95
m
). The size distribution is compatible with exosomes for both WT and rTg4510 Tg nanovesicles, with an average size of 130 nm in F3 (0.95
m
sucrose) and the most common nanovesicle size of ∼74 nm for both WT and Tg samples. However, some larger extracellular vesicles (>130 nm) were co-isolated with these potential exosomes. More exosome-like EVs were obtained from the WT samples than the Tg samples.
FIGURE 2.
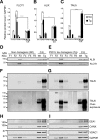
Analysis of protein contents in isolated EVs. Shown are quantitative Western blotting analysis of FLOT1, ALIX, and TAU expression. The same amount of protein (20 μg) was loaded for F3 EVs and whole control cell extracts (C.E). Error bars represent S.E. (n = 3). *, p < 0.05; **, p < 0.01; ****, p < 0.0001. A, quantification of protein levels for FLOT1, showing a very strong enrichment. B, protein levels for ALIX, an exosome marker of the endocytic pathway, were also enriched. C, quantification of protein levels for total tau. D–I, representative Western blots for different sucrose fractions of exosome isolations from WT and Tg mice, showing ALIX and FLOT1 expression (D and E) as well as total tau (mouse and human) detected with the Tau5 antibody (F and G). Note the bottom panels (F and G) for Tau5 overexposure, revealing high molecular weight (MW) proteins in F3, stronger around 150 kDa (asterisks), indicating potential trimers of tau in EVs. F5 and F6 show a continuous high molecular weight smear, indicating that some of the aggregates visualized by transmission electron microscopy (Fig. 1) could be free tau aggregates, which sediment at high concentrations of sucrose (59). H and I, detection of markers for cytoplasmic organelles in the sucrose fractions of exosome-like EVs: mitochondrial (VDAC1), early endosome (EEA1), and endoplasmic reticulum markers (calnexin) were tested.
FIGURE 3.
Phosphorylation-dependent tau epitopes are present at very low levels in exosome-like EVs isolated from mouse brains. Shown are Western blotting analysis of sucrose fractions F1-F6, testing different AD-associated phospho-tau epitopes. 20 μg of total protein was loaded for F3 exosome-like EVs and whole cell lysate controls. Error bars represent S.E. (n = 3). *, p < 0.05; ***, p < 0.001; ****, p < 0.0001; ns, not significant. A, representative Western blots for paired helical filament-tau phospho-epitopes and additional proteins. MW, molecular weight; C.E, cell extract. B–G, quantification of protein levels for (B) AT8, (C) AT100, (D) AT180, (E) AT270, (F) Ser(P)-262, and (G) Ser(P)-422. Analysis reveals that F3, enriched for exosome markers, contains the phospho-tau epitopes AT270, Ser(P)-262, and Ser(P)-422. Interestingly, the AT8, AT100, and AT180 phospho-epitopes are not detected in exosome-like EVs. H, protein levels for neuron-specific class III β-tubulin (TUJ1), demonstrating the neuronal origin of the EVs. I, PK surface shaving was performed with exosome-like EVs in sucrose fraction F3 (0.95
m
sucrose). Total tau was assayed with the Tau5 antibody. No tau was identified in the supernatant (S) after PK treatment. Tau was associated with the pellet (P) of intact exosome-like EVs after centrifugation in both WT and Tg mice. Tau protein was completely degraded when PK was added to lysed EVs (L).
FIGURE 4.
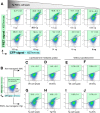
Exosome-like EVs can induce endogenous tau aggregation in FRET tau biosensor cells. FRET tau biosensor cells are HEK293T cells that express both tau-CFP and tau-YFP (RD domain). Cells were treated and analyzed by FRET flow cytometry after a 24-h treatment (n = 3, average ± S.D., 20,000 cells/experiment were analyzed). Representative flow cytometry plots show the FRET signal as detected in the right gate (Q2, shaded in green). A, titration of protein sample to determine concentrations near saturation of FRET tau biosensor cells. Cells were treated with decreasing amounts of rTg4510 transgenic brain cell lysates in the presence of Lipofectamine and analyzed by FRET flow cytometry after a 24-h treatment. 20 μg of protein in cell lysates is sufficient to generate a FRET signal that is not much lower than that obtained with only 1.0 or 0.5 μg of protein. Even with 8 ng of protein, a FRET signal is detected. Therefore, cells are saturated at 20 μg of cell lysate and detect tau seeds up to the low nanogram range. This implies that even minute amounts of tau seeds are detectable in 20 μg of protein. ex, excitation. B–J, analysis of the requirement of Lipofectamine. FRET tau biosensor cells were treated in the presence (C, D, G, and H) or absence (E, F, I, and J) of Lipofectamine, with vehicle (B) showing a lack of signal in the gate for FRET (upper right gate Q2, shaded green). C–F, none of the treatments with WT EVs or cell lysates can induce FRET. G–J, a strong FRET signal is detected with Tg cell lysates (G) and Tg EVs (H), but only in the presence of Lipofectamine. I and J, the same Tg samples without using Lipofectamine.
FIGURE 5.
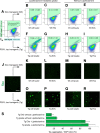
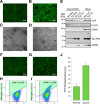
Effect of an extended culture on the generation of the FRET signal and tau aggregation. FRET tau biosensor cells were treated in the presence (B, C, F, and G) or absence (D, E, H, and I) of Lipofectamine and analyzed by FRET flow cytometry after a 72-h treatment (n = 3, average ± S.D.. 40,000 cells/experiment were analyzed). A, FRET tau biosensor cells treated only with Lipofectamine do not induce FRET (upper right gate Q2, shaded green). ex, excitation. B–E, none of the treatments with WT exosome-like EVs or cell lysates triggers FRET. F and G, a strong FRET signal is detected with Tg cell lysates (F) and Tg exosome-like EVs (G) in the presence of Lipofectamine. H and I, when Lipofectamine is omitted, a weak signal is detected for Tg lysates (H) and also for Tg EVs (I). J–R, parallel experiment using the same conditions was performed with cells grown on coverslips to then be analyzed by confocal microscopy. Scale bar = 50 μm. O–R, induced tau aggregates were visualized only with Tg samples. S, quantification of the ratio of the area occupied by tau inclusions normalized by the area occupied by nuclei 72-h after treatment (tau aggregates/DAPI in percent, n = 4).
FIGURE 6.
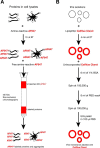
Far-red fluorescent labeling of proteins and exosome-like EVs. A, the strategy for labeling of free proteins and protein aggregates present in brain cell lysates. Amine-reactive Alexa Fluor 647 (AF647) labels the available N termini. Unreacted label is discarded by size exclusion chromatography, which recovers only AF647-labeled proteins and aggregates above 40 kDa. RT, room temperature. B, outline of the labeling of EV membranes with a lipophilic far-red dye (Cell Vue Claret). Lipophilic Cell Vue Claret incorporates with high affinity into the lipid bilayer of EV membranes. Traces of unbound dye are chelated with 1% BSA, and labeled exosome-like EVs are further purified by ultracentrifugation and PBS washes. It is important to note that the fluorescent label is in the membranes of exosome-like EVs, not the proteins.
FIGURE 7.
Lipofectamine increases the uptake of EVs and protein aggregates that trigger intracellular tau inclusions that are closely associated with internalized seeds. A–K, tau biosensor cells were treated in the presence (B, C, F, G, J, and K) or absence (D, E, H, and I) of Lipofectamine, analyzed by confocal microscopy after 24-h treatment. To visualize uptake by cells, cell lysates were labeled on the N terminus of proteins with AF647. Membranes of EVs were labeled with the lipophilic far-red dye Cell Vue Claret (CV) for a similar internalization assay. Endogenous tau was detected by green/yellow emission (530–600 nm). Scale bars = 50 μm (A–K) and 20 μm (M and N). A, FRET tau biosensor cells treated with Lipofectamine vehicle only. No far-red signal is detected because no exosome-like EVs or cell lysates were added. B–E, none of the treatments with labeled WT exosome-like EVs or WT cell lysates induces aggregation of endogenous tau. F–I, treatments with labeled Tg cell lysates or exosome-like EVs. Bright tau inclusions are visualized with AF647 Tg cell lysates (F) and CV-Claret Tg EVs (G) in the presence of Lipofectamine. Tau inclusions are also detected with AF647 Tg cell lysates (H) or CV-Claret Tg EVs (I) in the absence of Lipofectamine. J–K, Lipofectamine-mediated uptake of P301L Tg cell lysates and exosome-like EVs without far-red label, used as positive controls. L, quantification of the ratio of the areas of induced tau aggregates normalized over the area of nuclei detected 24 h after treatment for Tg samples shown in F–I (tau aggregates/DAPI in percent, n = 4). M and N, high-magnification images of the internalization of far-red labeled Tg cell lysates (M) and Tg exosomes (N) in the presence of Lipofectamine. M, tau inclusions form in close proximity to internalized exogenous protein aggregates, sometimes completely surrounding the seed. N, this is also observed for internalized exosome-like EVs, where membranes are still showing Cell Vue Claret stain, whereas EVs nucleate the formation of intracellular tau inclusions. The signal of Cell Vue Claret suggests that there is a compartmentalized membrane involved in the presentation of tau seed to the cell for triggering aggregation.
FIGURE 8.
Levels of uptake of exosome-like EVs and proteins in cell lysates determine the generation of the FRET signal. Tau biosensor cells were treated in the presence (B, C, F, G, J, and K) or absence (D, E, H, and I) of Lipofectamine and analyzed by FRET flow cytometry after a 24-h treatment. To perform quantification of uptake, protein cell lysates were labeled with AF647 and membranes of EVs with CV Claret. Arbitrary gates representing different levels of uptake (low, L; medium, M; high, H; unstained cells, U) are shown. The percentage of cells in each of the gates shown is depicted in the corresponding individual table below each flow cytometry plot (n = 3, average ± S.D., 40,000 cells/experiment were analyzed). A, FRET tau biosensor cells do not show FRET when treated with Lipofectamine vehicle only (right gates, shaded green) and show no far-red signal because no exosome-like EVs or cell lysates were added. B–E, none of the treatments with labeled WT exosome-like EVs or WT cell lysates induces FRET. However, far-red analysis of the uptake shows that the tau biosensor cells internalized proteins in cell lysates and whole EVs from WT samples in the absence of Lipofectamine (D and E), but uptake increased with Lipofectamine (B and C). F and G, Tau biosensor cells treated with Tg cell lysates or EVs in the presence of Lipofectamine. A strong FRET signal is detected with AF647 Tg cell lysates (F) and CV Claret Tg exosome-like EVs (G). In the presence of Lipofectamine, the majority of cells reached a high level of uptake. Consequently, the majority of cells showing FRET are those with the highest level of uptake of far-red labeled Tg sample. H and I, no FRET events are detected with AF647 Tg cell lysates (H) or CV Claret Tg EVs (I) in the absence of Lipofectamine. The majority of cells only reached a medium level of uptake. J and K, treatments with P301L Tg cell lysates and exosome-like EVs without the far-red label were used as a positive control.
FIGURE 9.
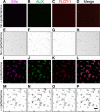
Induction of EV clusters and immunocolocalization of Alix and flotillin-1. I–L, mouse brain-derived EVs labeled with Cell Vue Claret and treated with Lipofectamine for immunofluorescence analysis of Alix and flotillin-1. A–D, EVs not treated with Lipofectamine were used as a control. Corresponding grayscale-inverted look-up table images are shown below each immunofluorescence image for better visualization (E–H and M–P). Shown is colocalization of Alix, expressed mostly in a punctuated fashion (bright green dots), and flotillin-1. Colocalization occurs independent of Lipofectamine treatment. However, Lipofectamine increases the binding capacity of EVs and induces the formation of EV clusters, which also increased the sensitivity of the immunofluorescence detection. Clusters of EVs varied in size. Scale bar = 10 μm.
FIGURE 10.
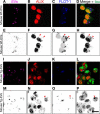
Alix and flotillin-1 are also immunocolocalized on EVs after cellular uptake. Shown is Lipofectamine-mediated internalization of mouse brain-derived EVs labeled with Cell Vue Claret by tau biosensor cells. The arrowheads indicate sites of Alix and flotillin-1 colocalization. The corresponding grayscale-inverted look-up table images are shown below each immunofluorescence image for better visualization (E–H and M–P). A–D, exosome-like EVs from WT mice (Wt-EVs) were robustly internalized but failed to engage in tau aggregation. However, ALIX, forming intracellular puncta, and FLOT-1 colocalized in internalized EVs (arrowheads). I–L, exosome-like EVs from rTg4510 transgenic mice (Tg-EVs) strongly induced intracellular tau inclusions (bright green) in recipient cells. In the middle of this reorganized cytoplasm, some colocalization of ALIX and FLOT-1 is observed, sometimes buried in EVs inside tau inclusions (arrowheads). Scale bar = 20 μm.
FIGURE 11.
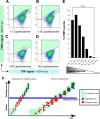
Lipofectamine increases the uptake of exogenous seeds and accelerates the seeding process in a dose-dependent manner. Tau biosensor cells were treated with the same amount of transgenic cell lysate for all conditions shown. However, Lipofectamine was gradually decreased at 2-fold dilutions and analyzed by FRET flow cytometry after a 24-h treatment (n = 3, average ± S.E., 40,000 cells analyzed per experiment). A–D, flow cytometry plots of representative treatments showing that the less Lipofectamine was added to the treatment the less FRET events of tau aggregation were induced. The FRET signal is detected in the right gate (Q2, shaded in green). ex, excitation. E, quantification of the percentage of FRET events detected with the different treatments, revealing a dose-dependent response to Lipofectamine concentrations. Error bars represent S.E. (n = 3). ****, p < 0.0001. F, concept of the action of Lipofectamine on treatments of tau biosensor cells. Our study supports the notion that Lipofectamine increases the uptake of exogenous tau seeds, which has a profound effect on the cellular decision of forming tau inclusions. High levels of uptake of misfolded tau seeds are required to trigger endogenous tau seeding inside the cell. This is compatible with the operation of a seeding threshold involved in this cellular decision. In the absence of Lipofectamine, the seeding process is slow and inefficient, which might be one of the reasons why tau pathology progresses very slowly in human patients with tauopathy.
FIGURE 12.
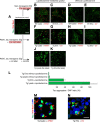
Only cells harboring tau inclusions secrete exosome-like EVs carrying tau seeds. Tau biosensor cells were used as an in vitro cellular model to isolate exosomes from a cell line in which tau aggregation was induced. Scale bar = 50 μm (A, B, F, and G) and 100 nm (C and D). A, fluorescent live-cell imagining of tau biosensor cells treated with WT mouse brain cell lysates to generate cultures without tau aggregation. B, cultures of cells forming tau inclusions (bright green aggregates) were obtained by treating the tau biosensor cells with rTg4510 brain lysates. C and D, electron microscopy of exosome-like EVs isolated from CCM of WT (C, Wt-EVs) or Tg cell cultures (D, Tg-EVs), showing that both types of cultures generate mostly EVs of less than 100 nm in diameter. E, Western blotting analysis of isolated EVs. 5 μg of protein equivalents of sucrose-purified EVs (F3, 0.95
m
sucrose) were blotted. 5 and 20 μg of protein of corresponding cell lysates are included for comparison. Using equivalent protein quantities, both EVs and cell lysates show strong up-regulation of the exosome markers ALIX and FLOT-1. The endoplasmic reticulum marker calnexin (CANX) was undetectable. Total tau was detected with the Tau-RD4 antibody, showing that tau is present at similar levels in both WT and Tg EVs. SDS-stable high molecular weight (MW, asterisks) tau species were only detected with 20 μg of transgenic cell lysates. Increased tau phosphorylation (Ser(P)-262) was detected in cells undergoing cellular tau aggregation. However, Ser(P)-262 was undetectable with the amount of EV protein analyzed. C.E, cell extract. F, exosome-like EVs from WT cultures (WT EVs + Lipofectamine) are unable to induce tau aggregation in naïve tau biosensor cells. G, fluorescent live-cell imagining of tau biosensor cells treated with Tg EVs + Lipofectamine, showing the robust presence of induced tau aggregates. H and I, FRET flow cytometry of treatments with 5 μg of protein equivalents of WT EVs (H) and Tg EVs (I) showing that only Tg EVs are able to generate FRET signals indicative of tau aggregation (n = 3, average ± S.D., 40,000 cells analyzed per experiment). ex, excitation. J, ThT fluorescence assay of HEK293-derived EVs (n = 3, average fluorescence ± S.E.; a.u., arbitrary units). A comparatively stronger increase of ThT fluorescence in Tg EVs indicates a higher presence of misfolded and aggregated tau.
Similar articles
- Tau Ser208 phosphorylation promotes aggregation and reveals neuropathologic diversity in Alzheimer's disease and other tauopathies.
Xia Y, Prokop S, Gorion KM, Kim JD, Sorrentino ZA, Bell BM, Manaois AN, Chakrabarty P, Davies P, Giasson BI. Xia Y, et al. Acta Neuropathol Commun. 2020 Jun 22;8(1):88. doi: 10.1186/s40478-020-00967-w. Acta Neuropathol Commun. 2020. PMID: 32571418 Free PMC article. - Proteopathic tau seeding predicts tauopathy in vivo.
Holmes BB, Furman JL, Mahan TE, Yamasaki TR, Mirbaha H, Eades WC, Belaygorod L, Cairns NJ, Holtzman DM, Diamond MI. Holmes BB, et al. Proc Natl Acad Sci U S A. 2014 Oct 14;111(41):E4376-85. doi: 10.1073/pnas.1411649111. Epub 2014 Sep 26. Proc Natl Acad Sci U S A. 2014. PMID: 25261551 Free PMC article. - Tau secretion and propagation: Perspectives for potential preventive interventions in Alzheimer's disease and other tauopathies.
Annadurai N, De Sanctis JB, Hajdúch M, Das V. Annadurai N, et al. Exp Neurol. 2021 Sep;343:113756. doi: 10.1016/j.expneurol.2021.113756. Epub 2021 May 12. Exp Neurol. 2021. PMID: 33989658 Review. - Tau Seeding Mouse Models with Patient Brain-Derived Aggregates.
Robert A, Schöll M, Vogels T. Robert A, et al. Int J Mol Sci. 2021 Jun 7;22(11):6132. doi: 10.3390/ijms22116132. Int J Mol Sci. 2021. PMID: 34200180 Free PMC article. Review.
Cited by
- The efficacy and functional consequences of interactions between human spermatozoa and seminal fluid extracellular vesicles.
Tamessar CT, Anderson AL, Bromfield EG, Trigg NA, Parameswaran S, Stanger SJ, Weidenhofer J, Zhang HM, Robertson SA, Sharkey DJ, Nixon B, Schjenken JE. Tamessar CT, et al. Reprod Fertil. 2024 Oct 4;5(4):e230088. doi: 10.1530/RAF-23-0088. Print 2024 Oct 1. Reprod Fertil. 2024. PMID: 39230058 Free PMC article. - Neuronal and Astrocytic Extracellular Vesicle Biomarkers in Blood Reflect Brain Pathology in Mouse Models of Alzheimer's Disease.
Delgado-Peraza F, Nogueras-Ortiz CJ, Volpert O, Liu D, Goetzl EJ, Mattson MP, Greig NH, Eitan E, Kapogiannis D. Delgado-Peraza F, et al. Cells. 2021 Apr 23;10(5):993. doi: 10.3390/cells10050993. Cells. 2021. PMID: 33922642 Free PMC article. - Re-thinking the Etiological Framework of Neurodegeneration.
Castillo X, Castro-Obregón S, Gutiérrez-Becker B, Gutiérrez-Ospina G, Karalis N, Khalil AA, Lopez-Noguerola JS, Rodríguez LL, Martínez-Martínez E, Perez-Cruz C, Pérez-Velázquez J, Piña AL, Rubio K, García HPS, Syeda T, Vanoye-Carlo A, Villringer A, Winek K, Zille M. Castillo X, et al. Front Neurosci. 2019 Jul 24;13:728. doi: 10.3389/fnins.2019.00728. eCollection 2019. Front Neurosci. 2019. PMID: 31396030 Free PMC article. Review. - Contribution of Extracellular Vesicles and Molecular Chaperones in Age-Related Neurodegenerative Disorders of the CNS.
Noori L, Filip K, Nazmara Z, Mahakizadeh S, Hassanzadeh G, Caruso Bavisotto C, Bucchieri F, Marino Gammazza A, Cappello F, Wnuk M, Scalia F. Noori L, et al. Int J Mol Sci. 2023 Jan 4;24(2):927. doi: 10.3390/ijms24020927. Int J Mol Sci. 2023. PMID: 36674442 Free PMC article. Review. - Exosomes Derived from M2 Microglial Cells Modulated by 1070-nm Light Improve Cognition in an Alzheimer's Disease Mouse Model.
Chen C, Bao Y, Xing L, Jiang C, Guo Y, Tong S, Zhang J, Chen L, Mao Y. Chen C, et al. Adv Sci (Weinh). 2023 Nov;10(32):e2304025. doi: 10.1002/advs.202304025. Epub 2023 Sep 13. Adv Sci (Weinh). 2023. PMID: 37702115 Free PMC article.
References
- Braak H., and Braak E. (1995) Staging of Alzheimer's disease-related neurofibrillary changes. Neurobiol. Aging 16, 271–278; discussion 278–284 - PubMed
- Attems J., Thal D. R., and Jellinger K. A. (2012) The relationship between subcortical tau pathology and Alzheimer's disease. Biochem. Soc. Trans. 40, 711–715 - PubMed
Publication types
MeSH terms
Substances
LinkOut - more resources
Full Text Sources
Other Literature Sources
Medical
Molecular Biology Databases
Research Materials
Miscellaneous

