Spatial memory impairment by TRPC1 depletion is ameliorated by environmental enrichment - PubMed (original) (raw)
Spatial memory impairment by TRPC1 depletion is ameliorated by environmental enrichment
Renzhong Xing et al. Oncotarget. 2016.
Abstract
Canonical transient receptor potential (TRPC) channels are widely expressed throughout the nervous system whereas their functions remain largely unclear. Here we investigated the effects of TRPC1 deletion on spatial memory ability of mice and the potential intervention by environmental enrichment (EE). Significant spatial memory impairment assessed by conditional fearing test, Y maze test and step-down test in TRPC1 knockout mice was revealed. The behavioral abnormality were attenuated by the treatment of EE. Proteomic analysis by two-dimensional fluorescence difference gel electrophoresis (2D-DIGE) coupled with a matrix-assisted laser desorption/ionisation-time of flight (MALDI-TOF) and tandem mass spectrometry (MS) revealed that TRPC1 deletion caused differential expression of a total of 10 proteins (8 up-regulated and 2 down-regulated) in hippocampus. EE treatment resulted in differential expression of a total of 22 proteins (2 up-regulated and 20 down-regulated) in hippocampus of TRPC1 knockout mice. Among these differentially expressed proteins, the expression of α-internexin and glia maturation factor β (GMF-β), two proteins shown to impair memory, were significantly down-regulated in hippocampus of TRPC1 knockout mice by EE treatment. Taken together, these data suggested that TRPC1 regulated directly or indirectly the expression of multiple proteins, which may be crucial for the maintenance of memory ability, and that EE treatment modulated spatial memory impairment caused by TRPC1 depletion and the mechanisms may involve the modulation of EE on the expression of those dys-regulated proteins such as α-internexin and GMF-β in hippocampus.
Keywords: GMF-β; TRPC1; environment enrichment; memory; α-internexin.
Conflict of interest statement
All the authors have no conflicts of interest to disclose.
Figures
Figure 1. Spatial memory ability was measured by trace cued and contextual fear conditioning
a. Proportion time freezing during the first 3 min of training before CS-US presentation (Pre-US), and the final 2 min of the training session after CS-US presentations (Post-US). b. Freezing behavior in the novel context, 24 h after training during the first 2 min of no CS presentation (Pre-Cue) and 1 min of CS presentation (Auditory Cue). c. Freezing behavior 48 h after training, in the same context in which training was carried out on day 1. Values were expressed as mean +/− SEM.*, ** P < 0.05 and P < 0.01, vs. WT, respectively; #, ##P < 0.05 and P < 0.01, vs. TRPC1−/−, respectively. _n_=8-13 for each group.
Figure 2. Spatial memory performance in the Y maze
a. Ratio of entry, b. Ratio of distance and c. Ratio of time. Values were expressed as mean +/− SEM. *, ** P < 0.05 and P < 0.01 vs. WT mice, respectively; # P < 0.05 vs. TRPC1−/− mice. n = 8-10 for each group.
Figure 3. Spatial memory ability was measured by step-down test
a. Latencies on Day 1, b. The number of errors on Day 1, c. Latencies on Day 2, d. The number of errors on Day 2. Values were represented as mean +/− SEM. * and ***P < 0.05 and P < 0.001 vs. WT mice, respectively; # and ### P < 0.05 and P < 0.001 vs. TRPC1−/− mice, respectively. _n_=8-10 for each group.
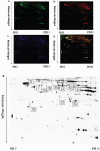
Figure 4. A representative 2D-DIGE gel image of hippocampal proteins from WT mice and TRPC1−/− mice
Hippocampal proteins from WT mice and TRPC1−/− mice were labeled with Cy3 or Cy5 dye, respectively (n =6 for each group). An internal standard protein sample (a mixture of all hippocampus samples) was labeled with the Cy2 dye. The CyDye-labeled samples were combined, and the proteins were co-separated in the first dimension via IEF in 24 cm pH 3–11 nonlinear IPG strips, followed by separation in the second dimension via SDS-PAGE. Spots of interest were manually excised, digested and subjected to identification by MALDI-TOF-MS/MS. a. A representative image of hippocampus proteins from TRPC1−/− mice labeled with Cy5 dye. b. A representative image of a 2D-DIGE gel showing Cy3-labeled hippocampus proteins from WT mice. c. A representative image of a 2D-DIGE gel showing Cy2-labeled proteins as internal standards. d. A merged image of the 2D-DIGE gel displaying Cy2-, Cy3- and Cy5-labeled proteins. e. Greyscale 2D-DIGE gel image showing 10 differentially expressed protein spots identified by MALDI-TOF-MS/MS (black numbers with white square) in hippocampus of TRPC1−/− mice relative to WT mice.
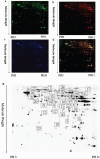
Figure 5. A representative 2D-DIGE gel image of hippocampal proteins from TRPC1−/− mice treated with or without EE
Hippocampal proteins from TRPC1−/− treated with or without EE were labeled with Cy3 or Cy5 dye, respectively (n =6 for each group). An internal standard protein sample (a mixture of all hippocampus samples) was labeled with the Cy2 dye. The CyDye-labeled samples were combined, and the proteins were co-separated in the first dimension via IEF in 24 cm pH 3–11 nonlinear IPG strips, followed by separation in the second dimension via SDS-PAGE. Spots of interest were manually excised, digested and subjected to identification by MALDI-TOF-MS/MS. a. A representative image of hippocampus proteins from EE-treated TRPC1−/− mice labeled with Cy5 dye. b. A representative image of a 2D-DIGE gel showing Cy3-labeled hippocampus proteins from TRPC1−/− mice. c. A representative image of a 2D-DIGE gel showing Cy2-labeled proteins as internal standards. d. A merged image of the 2D-DIGE gel displaying Cy2-, Cy3- and Cy5-labeled proteins. e. Greyscale 2D-DIGE gel image showing 22 differentially expressed protein spots identified by MALDI-TOF-MS/MS (black numbers with white square) in hippocampus of EE-treated TRPC1−/− mice relative to non-treated TRPC1−/− mice.
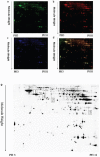
Figure 6. A representative 2D-DIGE gel image of hippocampal proteins of EE-treated WT mice and WT mice
The hippocampal samples from EE-treated WT mice and WT mice (n = 6 for each group) were labeled with Cy-Dye, multiplexed, and underwent isoelectric focusing on 24 cm pH 3-11 nonlinear IPG strips. The proteins were subsequently separated on large-format 12.5% gels. Spots of interest were manually excised, digested and subjected to identification by MALDI-TOF-MS/MS. a. Cy3-labled hippocampus proteins of EE-treated WT mice. b. Cy5-labeled hippocampus proteins of WT mice. c. Cy2-labeled proteins as internal standards. d. The merged image showing Cy2-, Cy3-, and Cy5-labeled proteins. e. Greyscale 2D-DIGE gel image showing 3 differentially expressed protein spots identified by MALDI-TOF-MS/MS (black numbers with white square) in hippocampus of EE-treated WT mice relative to WT mice.
Figure 7. Verification of α-internexin and GMF-β by Western-blot analysis
a and b. The relative levels of α-internexin in hippocampus in WT mice and TRPC1−/− mice treated with or without EE. a and c. The relative levels of GMF-β in WT mice and TRPC1−/− mice treated with or without EE. *P < 0.05 versus WT mice, #P < 0.05 versus TRPC1−/− mice. n = 3 for each group. Values were expressed as mean +/− SEM.
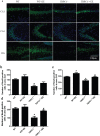
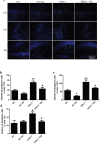
Figure 8. TRPC1 depletion caused neuronal loss
a. Immunofluorescent images depicting the number of neurons as evidenced by NeuN-staining. b. The number of NeuN-positive cells in CA1. c. The number of NeuN-positive cells in CA3. d. The number of NeuN-positive cells in DG.* and **P < 0.05 and P < 0.01 vs WT mice, respectively; # and ## P < 0.05 and P < 0.01 vs TRPC1−/− mice, respectively. All the values were expressed as mean +/− SEM. _n_=3 for each group. Scale bar = 100 μm.
Figure 9. TRPC1 depletion caused hippocampal neuronal apoptosis
a. A representative image of hippocampal neuronal apoptosis. b. The number of apoptotic cells in CA1. c. The number of apoptotic cells in CA3. d. The number of apoptotic cells in DG.* and **P < 0.05 and P < 0.01 vs WT mice, respectively; # and ##P < 0.05 and P < 0.01 vs TRPC1−/− mice, respectively. All the values were expressed as mean +/− SEM. _n_=3 for each group. Scale bar = 100 μm.
Similar articles
- Transient Receptor Potential-canonical 1 is Essential for Environmental Enrichment-Induced Cognitive Enhancement and Neurogenesis.
Du LL, Wang L, Yang XF, Wang P, Li XH, Chai DM, Liu BJ, Cao Y, Xu WQ, Liu R, Tian Q, Wang JZ, Zhou XW. Du LL, et al. Mol Neurobiol. 2017 Apr;54(3):1992-2002. doi: 10.1007/s12035-016-9758-9. Epub 2016 Feb 24. Mol Neurobiol. 2017. PMID: 26910815 - Identification of the key molecules involved in chronic copper exposure-aggravated memory impairment in transgenic mice of Alzheimer's disease using proteomic analysis.
Yu J, Luo X, Xu H, Ma Q, Yuan J, Li X, Chang RC, Qu Z, Huang X, Zhuang Z, Liu J, Yang X. Yu J, et al. J Alzheimers Dis. 2015;44(2):455-69. doi: 10.3233/JAD-141776. J Alzheimers Dis. 2015. PMID: 25352456 - Identification of Novel Key Molecules Involved in Spatial Memory Impairment in Triple Transgenic Mice of Alzheimer's Disease.
Ying M, Sui X, Zhang Y, Sun Q, Qu Z, Luo X, Chang RC, Ni J, Liu J, Yang X. Ying M, et al. Mol Neurobiol. 2017 Jul;54(5):3843-3858. doi: 10.1007/s12035-016-9959-2. Epub 2016 Jun 22. Mol Neurobiol. 2017. PMID: 27335030 - TRPC1 Null Exacerbates Memory Deficit and Apoptosis Induced by Amyloid-β.
Li M, Liu E, Zhou Q, Li S, Wang X, Liu Y, Wang L, Sun D, Ye J, Gao Y, Yang X, Liu J, Yang Y, Wang JZ. Li M, et al. J Alzheimers Dis. 2018;63(2):761-772. doi: 10.3233/JAD-180077. J Alzheimers Dis. 2018. PMID: 29660945 - TRPC1: The housekeeper of the hippocampus.
Skerjanz J, Bauernhofer L, Lenk K, Emmerstorfer-Augustin A, Leitinger G, Reichmann F, Stockner T, Groschner K, Tiapko O. Skerjanz J, et al. Cell Calcium. 2024 Nov;123:102933. doi: 10.1016/j.ceca.2024.102933. Epub 2024 Jul 27. Cell Calcium. 2024. PMID: 39116710 Review.
Cited by
- Late Effects of 1H + 16O on Short-Term and Object Memory, Hippocampal Dendritic Morphology and Mutagenesis.
Kiffer F, Alexander T, Anderson J, Groves T, McElroy T, Wang J, Sridharan V, Bauer M, Boerma M, Allen A. Kiffer F, et al. Front Behav Neurosci. 2020 Jun 26;14:96. doi: 10.3389/fnbeh.2020.00096. eCollection 2020. Front Behav Neurosci. 2020. PMID: 32670032 Free PMC article. - Movement deficits and neuronal loss in basal ganglia in TRPC1 deficient mice.
He K, Qi F, Guo C, Zhan S, Xu H, Liu J, Yang X. He K, et al. Oncotarget. 2016 Oct 25;7(43):69337-69346. doi: 10.18632/oncotarget.12567. Oncotarget. 2016. PMID: 27738307 Free PMC article. - Inhibition of TRPC1-Dependent Store-Operated Calcium Entry Improves Synaptic Stability and Motor Performance in a Mouse Model of Huntington's Disease.
Wu J, Ryskamp D, Birnbaumer L, Bezprozvanny I. Wu J, et al. J Huntingtons Dis. 2018;7(1):35-50. doi: 10.3233/JHD-170266. J Huntingtons Dis. 2018. PMID: 29480205 Free PMC article. - Role of STIM2 in cell function and physiopathology.
Berna-Erro A, Jardin I, Salido GM, Rosado JA. Berna-Erro A, et al. J Physiol. 2017 May 15;595(10):3111-3128. doi: 10.1113/JP273889. Epub 2017 Feb 19. J Physiol. 2017. PMID: 28087881 Free PMC article. Review.
References
- Nilius B, Owsianik G, Voets T, Peters JA. Transient receptor potential cation channels in disease. Physiological reviews. 2007;87:165–217. - PubMed
- Putney JW. Physiological mechanisms of TRPC activation. Pflugers Archiv: European journal of physiology. 2005;451:29–34. - PubMed
- Fasolato C, Innocenti B, Pozzan T. Receptor-activated Ca2+ influx: how many mechanisms for how many channels? Trends in pharmacological sciences. 1994;15:77–83. - PubMed
- Putney JW, Jr, McKay RR. Capacitative calcium entry channels. BioEssays. 1999;21:38–46. - PubMed
MeSH terms
Substances
LinkOut - more resources
Full Text Sources
Other Literature Sources
Medical
Molecular Biology Databases


