Defects in lysosomal maturation facilitate the activation of innate sensors in systemic lupus erythematosus - PubMed (original) (raw)
Defects in lysosomal maturation facilitate the activation of innate sensors in systemic lupus erythematosus
Andrew J Monteith et al. Proc Natl Acad Sci U S A. 2016.
Abstract
Defects in clearing apoptotic debris disrupt tissue and immunological homeostasis, leading to autoimmune and inflammatory diseases. Herein, we report that macrophages from lupus-prone MRL/lpr mice have impaired lysosomal maturation, resulting in heightened ROS production and attenuated lysosomal acidification. Impaired lysosomal maturation diminishes the ability of lysosomes to degrade apoptotic debris contained within IgG-immune complexes (IgG-ICs) and promotes recycling and the accumulation of nuclear self-antigens at the membrane 72 h after internalization. Diminished degradation of IgG-ICs prolongs the intracellular residency of nucleic acids, leading to the activation of Toll-like receptors. It also promotes phagosomal membrane permeabilization, allowing dsDNA and IgG to leak into the cytosol and activate AIM2 and TRIM21. Collectively, these events promote the accumulation of nuclear antigens and activate innate sensors that drive IFNα production and heightened cell death. These data identify a previously unidentified defect in lysosomal maturation that provides a mechanism for the chronic activation of intracellular innate sensors in systemic lupus erythematosus.
Keywords: AIM2; Fc gamma receptors; TRIM21; lysosomal acidification; systemic lupus erythematosus.
Conflict of interest statement
The authors declare no conflict of interest.
Figures
Fig. 1.
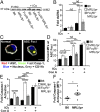
Autoimmune-prone MFs accumulate IgG-ICs on the cell membrane. (A and B) CD11b+ cells were purified from spleen and analyzed for surface Sm and IgG by confocal imaging. (Scale bars: 2.5 μm.) Data represent two experiments, two mice, 8–10 cells. A representative image of a MF from the indicated mice (A) and quantification of IgG colocalization with Sm for all cells imaged (B) is presented. (C) Flow cytometry analysis of surface IgG and Sm on splenic MFs (CD11b+, CD11c−) relative to B6 IgG [mean fluorescence intensity (MFI) range = 1.81–7.64] or B6 Sm (MFI range = 1.02–7.55); four experiments, 4–8 mice (B6 ≥ 12 wk, MRL/lpr ≥ 12 wk, NZM2410 = 12–22 wk, NOD ≥ 26 wk; blood glucose levels > 500 mg/dL, K/BxN ≥ 13 wk; clinical score = 10). Error bars indicate SEM. Student t test or ANOVA, *P ≤ 0.05, **P ≤ 0.01, ***P ≤ 0.001.
Fig. S1.
On the surface of NOD myeloid cells, IgG and Sm show punctate staining. Splenic myeloid cells (CD11b+) were purified from NOD mice and analyzed for surface levels of Sm and IgG by confocal microscopy; two experiments, two mice, 15–20 cells. Approximately 85% of CD11b+ splenocytes showed IgG and Sm staining. Of these double-positive cells, 100% showed a punctate staining pattern. (Scale bars: 5 μm.)
Fig. 2.
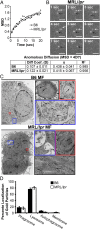
MRL/lpr MFs phagocytose and traffic IgG-ICs to lysosomal structures. (A and B) Bone marrow-derived macrophages (BMMFs) were cultured with Alexa488-labeled IgG-ICs and examined over time by TIRF microscopy; four experiments, four mice, cells = 9–12, n = 47–48. The mean squared displacement (MSD) was calculated by tracking the displacement of IgG-ICs on the surface of the cell until the IgG-IC left the imaging plane (phagocytosis). (A) Each point is the average MSD of 4–7 IgG-ICs from two to four cells in the imaging plane. (B) A representative time series of IgG-ICs on the surface of a MRL/lpr MF (arrows) is presented. (C and D) BMMFs were cultured with gold-labeled IgG-ICs for 2 h and examined by cryo-electron microscopy; two experiments, two mice, 12–15 cells. A representative image of a MF from the indicated mice (C) and the subcellular localization of IgG-ICs in each cell and quantified for all cells imaged (D) is presented. IgG-ICs were found in phagosomes (single membrane, electron light), lysosomes (single membrane, electron dense), autophagosomes (double membrane), and on the cell membrane. Error bars = SEM. Student t test, *P ≤ 0.05, **P ≤ 0.01, ***P ≤ 0.001. (Scale bars: 1 μm.)
Fig. 3.
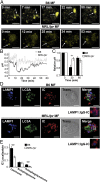
MRL/lpr MFs fail to mature the lysosome. (A and B) BMMFs were stimulated with IgG-ICs, and the pH of the maturing phagosomes were assessed by ratiometric two-photon microscopy; three experiments, three mice, 10–25 cells. A representative time series of a MF from the indicated mice (A) with the quantified pH of a single phagosomal acidification event (arrow) (B) is presented. Ratiometric flow cytometry was used to quantify the relative phagosomal pH across the entire population of MFs; six experiments, 6–8 mice (C). (D and E) Colocalization of IgG-ICs with LAMP-1 and/or LC3A was assessed by confocal imaging; three experiments, three mice, 36–39 cells. A representative image of a MF from the indicated mice (D) and quantification of IgG-IC colocalization with indicated compartments for all cells imaged (E) is presented. Error bars = SEM. Student t test, *P ≤ 0.05, **P ≤ 0.01, ***P ≤ 0.001. (Scale bars: 5 μm.)
Fig. S2.
MRL/lpr MFs have heightened and prolonged ROS production. Relative (to B6 control) phagosomal ROS levels were quantified in real time on a fluorescence plate reader following phagocytosis of IgG-ICs; six experiments, six mice.
Fig. 4.
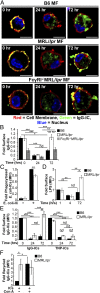
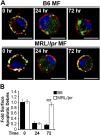
IgG-ICs recycle and accumulate on the cell membrane of MRL/lpr MFs. (A and B) BMMFs from the indicated mice were cultured with IgG-ICs and examined over time by confocal imaging; four experiments, 3–4 mice, 17–23 cells. A representative image of a MF from the indicated mice (A) and quantification of IgG-IC colocalization with the cell membrane for all cells imaged (B) is presented. BMMFs were cultured with GFP-expressing _E. coli_-ICs for 1 h. At indicated time points relative levels (to B6+_E. coli_-IC) of phagocytosed _E. coli_-ICs (C) and extracellular LPS (relative to B6 1 h; MFI = 6.79–9.32) were quantified by flow cytometry; three experiments, three mice (D). BMMFs were cultured with fluorescent IgG-ICs or TNP-ICs for the indicated time. (E) Relative levels (to B6 0 h) of surface ICs were quantified by flow cytometry at indicated time points; Left, five experiments, five mice; Right, two experiments, two mice. (F) BMMFs cultured ± concanamycin A (20 ng/mL) were exposed to fluorescently tagged IgG-ICs for 72 h and assessed for relative levels (to B6+ICs-Con A) of recycled IgG-ICs by flow cytometry; 5–6 experiments, 5–6 mice. Error bars = SEM. Student t test or ANOVA, nd > 0.05, *P ≤ 0.05, **P ≤ 0.01, ***P ≤ 0.001. (Scale bars: 5 μm.)
Fig. S3.
Gating scheme for IgG-IC recycling. BMMFs from the indicated mice were cultured with fluorescently labeled IgG-ICs and examined over time by flow cytometry. Following gating for the BMMF population, surface-bound IgG-ICs were calculated by subtracting the MFI of the quenched sample (intracellular IgG-ICs) from the MFI of the unquenched sample (total IgG-ICs).
Fig. S4.
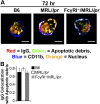
IgG and apoptotic debris remain colocalized upon recycling of IgG-ICs. BMMFs from the indicated mice were cultured with fluorescently labeled IgG-ICs and examined over time by confocal microscopy; two experiments, two mice, 10–15 cells. A representative image of a MF from the indicated mice (A), and quantification of all cells imaged by using Mander’s coefficient for the colocalization for IgG with Sm (B). IgG-ICs were formed by using Alexa 647-labeled IgG and GFP-expressing apoptotic thymocytes. (Scale bars: 5 μm.)
Fig. 5.
Impaired lysosomal maturation allows dsDNA to leak into the cytosol and activate AIM2. BMMFs were stimulated for 4 h with Hoechst-labeled IgG-ICs (A and B). (A) A representative blot of immunoprecipitated AIM2 (5–8 × 10⁶ cells) is shown. (B) Relative levels (to B6 untreated) of fluorescent DNA isolated from the AIM2 immunoprecipitation were quantified by using a fluorescent plate reader; four experiments, four mice. (C_–_E) BMMFs were stimulated for 4 h with IgG-ICs ± concanamycin A (20 ng/mL) and then examined for the formation of ASC foci and caspase-1 activation by confocal imaging. A representative image of a MF, with and without ASC foci is presented (C). (Scale bars: 5 μm.) The percentage of cells with ASC foci for each experiment (D) and relative levels (to B6 untreated) of caspase-1 activation (E) was quantified for all cells imaged; 10 experiments, 2–10 mice, 63–364 cells. (F) Relative levels (to B6) of caspase-1 activation was measured in splenic myeloid cells (CD11b+) by flow cytometry; four experiments, 5–9 mice (≥17 wk; active disease confirmed with kidney H&E). Error bars = SEM. Student t test or ANOVA, nd > 0.05, *P ≤ 0.05, **P ≤ 0.01, ***P ≤ 0.001.
Fig. 6.
Impaired lysosomal maturation allows IgG to leak into the cytosol and activate TRIM21. BMMFs were stimulated with fluorescently tagged IgG-ICs (4 h), and TRIM21 was immunoprecipitated (5–8 × 10⁶ cells) (A_–_C). (A) Representative blots of TRIM21 and IgH/IgL chains is shown. (B) Relative levels (to B6 untreated) of fluorescent IgG isolated from TRIM21 immunoprecipitates; seven experiments, seven mice. (C) Relative levels (to B6 untreated) of immunoprecipitated TRIM21 was quantified by densitometry; three experiments, three mice. (D and E) Nuclear translocation of p65 subunit of NF-κB was quantified in BMMFs stimulated for 4 h with IgG-ICs or apoptotic debris (lacking IgG), ± concanamycin A (20 ng/mL); six experiments, 3–6 mice, 16–57 cells. Representative image of p65 nuclear localization in MFs from the indicated mice (D) and quantification of p65 colocalization with the nucleus of all cells imaged (E) is presented. (F–H) BMMFs were transduced with lentivirus expressing indicated shRNA. Relative levels of TRIM21 (to B6+nontargeting; MFI = 2.57–7.25) in transduced cells (GFP+) were quantified by flow cytometry; three experiments, three mice (F), and nuclear translocation of the p65 subunit of NF-κB was quantified in transduced cells (GFP+) stimulated for 4 h with IgG-ICs; two experiments, two mice, 20–22 cells (G and H). Localization of p65 in MFs from the indicated mice (G) and quantification of p65 colocalization with the nucleus (H) is presented. (I and J) Ubiquitin was immunoprecipitated from splenic myeloid cells (CD11b+; 35 × 106 cells) and immunoblotted for TRIM21; two experiments, 4–5 mice (≥17 wk). A representative blot of TRIM21 following immunoprecipitation of ubiquitin (I) and relative levels (to B6) of ubiquitinated TRIM21 was quantified by densitometry (J) is presented. Splenic myeloid cells (CD11b+) were analyzed for relative levels (to B6) of IRF7 and IRF3 by confocal microscopy; two experiments, two mice, 10–28 cells (K). Error bars = SEM. Student t test or ANOVA, nd > 0.05, *P ≤ 0.05, **P ≤ 0.01, ***P ≤ 0.001. (Scale bars: 5 μm.)
Fig. S5.
MRL/lpr MFs recycle apoptotic blebs. BMMFs from the indicated mice were cultured with apoptotic blebs (no IgG) and examined over time by confocal imaging; three experiments, three mice, 19–31 cells. A representative image of a MF from the indicated mice (A), and quantification of all cells imaged using Mander’s coefficient for the colocalization for apoptotic debris with the membrane (B). Apoptotic blebs were formed from GFP-expressing thymocytes.
Fig. 7.
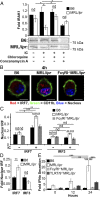
Impaired lysosomal maturation promotes intracellular TLR activation and IFNα secretion. (A) BMMFs (1–1.5 × 10⁶ cells) were stimulated for 24 h with IgG-ICs ± hydroxychloroquine (50 μg/mL) or ± concanamycin A (20 ng/mL); five experiments, 3–5 mice. IRAK1 was immunoblotted from whole cell lysates and relative levels (to B6 untreated) of IRAK1 were quantified by densitometry. A representative IRAK1 blot is shown. (B and C) BMMFs were stimulated with IgG-ICs (4 h), and the nuclear translocation of IRF7 or IRF3 was quantified by confocal microscopy; four experiments, 3–4 mice, 20–42 cells. (Scale bars: 5 μm.) A representative image of a MF from the indicated mice (B) and quantification of IRF colocalization with the nucleus of all cells imaged (C) is presented. (D) Splenic myeloid cells (CD11b+) were analyzed for nuclear IRF7 and IRF3 by confocal microscopy; two experiments, two mice (≥17 wk; active disease confirmed with kidney H&E), 10–28 cells. Supernatants from IgG-IC stimulated BMMFs were collected at the indicated time points and cocultured with WISH cells. Relative levels (to B6 0 h) of IFIT message as an indirect measure of IFNα were quantified by RT-PCR (E); three experiments, three mice. Error bars = SEM. Student t test or ANOVA, nd > 0.05, *P ≤ 0.05, **P ≤ 0.01, ***P ≤ 0.001.
Similar articles
- Apoptotic Debris Accumulates on Hematopoietic Cells and Promotes Disease in Murine and Human Systemic Lupus Erythematosus.
Kang S, Rogers JL, Monteith AJ, Jiang C, Schmitz J, Clarke SH, Tarrant TK, Truong YK, Diaz M, Fedoriw Y, Vilen BJ. Kang S, et al. J Immunol. 2016 May 15;196(10):4030-9. doi: 10.4049/jimmunol.1500418. Epub 2016 Apr 8. J Immunol. 2016. PMID: 27059595 Free PMC article. - Inhibition of Toll-like receptor-7 (TLR-7) or TLR-7 plus TLR-9 attenuates glomerulonephritis and lung injury in experimental lupus.
Pawar RD, Ramanjaneyulu A, Kulkarni OP, Lech M, Segerer S, Anders HJ. Pawar RD, et al. J Am Soc Nephrol. 2007 Jun;18(6):1721-31. doi: 10.1681/ASN.2006101162. Epub 2007 Apr 25. J Am Soc Nephrol. 2007. PMID: 17460144 - Lupus-Associated Immune Complexes Activate Human Neutrophils in an FcγRIIA-Dependent but TLR-Independent Response.
Bonegio RG, Lin JD, Beaudette-Zlatanova B, York MR, Menn-Josephy H, Yasuda K. Bonegio RG, et al. J Immunol. 2019 Feb 1;202(3):675-683. doi: 10.4049/jimmunol.1800300. Epub 2019 Jan 4. J Immunol. 2019. PMID: 30610165 Free PMC article. - Toll-like receptors in systemic lupus erythematosus; prospects for therapeutic intervention.
Kim WU, Sreih A, Bucala R. Kim WU, et al. Autoimmun Rev. 2009 Jan;8(3):204-8. doi: 10.1016/j.autrev.2008.07.046. Epub 2008 Aug 21. Autoimmun Rev. 2009. PMID: 18722558 Free PMC article. Review. - Toll-like receptors and activation of autoreactive B cells.
Leadbetter EA, Rifkin IR, Marshak-Rothstein A. Leadbetter EA, et al. Curr Dir Autoimmun. 2003;6:105-22. doi: 10.1159/000066858. Curr Dir Autoimmun. 2003. PMID: 12408049 Review. No abstract available.
Cited by
- Cytoplasmic DNA and AIM2 inflammasome in RA: where they come from and where they go?
Xu C, Jing W, Liu C, Yuan B, Zhang X, Liu L, Zhang F, Chen P, Liu Q, Wang H, Du X. Xu C, et al. Front Immunol. 2024 Oct 10;15:1343325. doi: 10.3389/fimmu.2024.1343325. eCollection 2024. Front Immunol. 2024. PMID: 39450183 Free PMC article. Review. - The role of cytokines from salivary gland epithelial cells in the immunopathology of Sjögren's syndrome.
Dong Y, Wang T, Wu H. Dong Y, et al. Front Immunol. 2024 Sep 13;15:1443455. doi: 10.3389/fimmu.2024.1443455. eCollection 2024. Front Immunol. 2024. PMID: 39346911 Free PMC article. Review. - Genetic and epigenetic regulation of inflammasomes: Role in atherosclerosis.
Yalcinkaya M, Tall AR. Yalcinkaya M, et al. Atherosclerosis. 2024 Sep;396:118541. doi: 10.1016/j.atherosclerosis.2024.118541. Epub 2024 Jul 14. Atherosclerosis. 2024. PMID: 39111028 Review. - Advances in non-viral mRNA delivery to the spleen.
Narasipura EA, Fenton OS. Narasipura EA, et al. Biomater Sci. 2024 Jun 11;12(12):3027-3044. doi: 10.1039/d4bm00038b. Biomater Sci. 2024. PMID: 38712531 Review. - Defective Lamtor5 Leads to Autoimmunity by Deregulating v-ATPase and Lysosomal Acidification.
Zhang W, Sha Z, Tang Y, Jin C, Gao W, Chen C, Yu L, Lv N, Liu S, Xu F, Wang D, Shi L. Zhang W, et al. Adv Sci (Weinh). 2024 Jun;11(22):e2400446. doi: 10.1002/advs.202400446. Epub 2024 Apr 19. Adv Sci (Weinh). 2024. PMID: 38639386 Free PMC article.
References
- Klemperer P. The pathogenesis of lupus erythematosus and allied conditions. Ann Intern Med. 1948;28(1):1–11. - PubMed
- Kuhn A, et al. Accumulation of apoptotic cells in the epidermis of patients with cutaneous lupus erythematosus after ultraviolet irradiation. Arthritis Rheum. 2006;54(3):939–950. - PubMed
Publication types
MeSH terms
Substances
Grants and funding
- R21 AI105613/AI/NIAID NIH HHS/United States
- T32 AI007273/AI/NIAID NIH HHS/United States
- R01 AI070984/AI/NIAID NIH HHS/United States
- R21 AR064951/AR/NIAMS NIH HHS/United States
- P30 CA016086/CA/NCI NIH HHS/United States
LinkOut - more resources
Full Text Sources
Other Literature Sources
Medical
Molecular Biology Databases


