Weak Broadband Electromagnetic Fields are More Disruptive to Magnetic Compass Orientation in a Night-Migratory Songbird (Erithacus rubecula) than Strong Narrow-Band Fields - PubMed (original) (raw)
Weak Broadband Electromagnetic Fields are More Disruptive to Magnetic Compass Orientation in a Night-Migratory Songbird (Erithacus rubecula) than Strong Narrow-Band Fields
Susanne Schwarze et al. Front Behav Neurosci. 2016.
Abstract
Magnetic compass orientation in night-migratory songbirds is embedded in the visual system and seems to be based on a light-dependent radical pair mechanism. Recent findings suggest that both broadband electromagnetic fields ranging from ~2 kHz to ~9 MHz and narrow-band fields at the so-called Larmor frequency for a free electron in the Earth's magnetic field can disrupt this mechanism. However, due to local magnetic fields generated by nuclear spins, effects specific to the Larmor frequency are difficult to understand considering that the primary sensory molecule should be organic and probably a protein. We therefore constructed a purpose-built laboratory and tested the orientation capabilities of European robins in an electromagnetically silent environment, under the specific influence of four different oscillating narrow-band electromagnetic fields, at the Larmor frequency, double the Larmor frequency, 1.315 MHz or 50 Hz, and in the presence of broadband electromagnetic noise covering the range from ~2 kHz to ~9 MHz. Our results indicated that the magnetic compass orientation of European robins could not be disrupted by any of the relatively strong narrow-band electromagnetic fields employed here, but that the weak broadband field very efficiently disrupted their orientation.
Keywords: bird orientation; magnetic compass; magnetoreception; narrow-band electromagnetic field; radical pair mechanism; time-dependent electromagnetic fields.
Figures
Figure 1
Ground plan of the new wooden laboratory. The materials used to build the laboratory were strictly non-magnetic. Four experimental chambers, which very efficiently screen time-dependent electromagnetic fields, are placed within the building. One double-wrapped, three-dimensional Merritt four-coil system with average coil diameters of ~2 m (Zapka et al., ; Hein et al., ; Engels et al., 2014) and a pair of 2.2 m _z_-axis RF-coils in Helmholtz-configuration was placed within three of these four chambers. (A) Cross-section. (B) Floor plan. (C) Photo of the new wooden laboratory from the outside. (D) Photo of one of the coil setups placed inside each of the three chambers. The photo also shows the nine Emlen funnels in their holders, which were placed on top of the wooden table in the center of the coil system.
Figure 2
Shielding effectiveness measurements in experimental chambers at different frequencies in accordance to the IEEE-299 standard (IEEE, 1997). *indicates that the shielding effectiveness was higher than the largest measurable value of 120 dB.
Figure 3
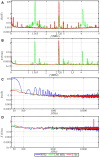
Magnetic and electric field measurements of test conditions in spring 2012, autumn 2013 and spring 2014. Traces in (A,B) show, respectively, the magnetic (B) and electric (E) components of the narrow-band electromagnetic fields and the artificial broadband noise as a function of frequency (f). The narrow-band magnetic fields had a peak intensity of 48 nT. The intensity of the broadband noise is shown twice: the purple line is the average (root mean square) intensity and the yellow line is the 40 min max-hold intensity and is directly comparable to the spectra shown in Engels et al. (2014).
Figure 4
Magnetic and electric field measurements of test conditions in spring 2013. Traces in (A–D) show, respectively, the magnetic (B) and electric (E) component of the narrow-band electromagnetic fields in the range from 10 kHz to 5 MHz (A,B) and in the range from 40 Hz to 32 kHz (C,D). The peak intensity in each condition was ~400 nT.
Figure 5
European robins can orient in their appropriate migratory directions when they are exposed to narrow-band time-dependent magnetic fields. (A–F): The results of orientation cage experiments on European robins. (A) Dummy condition in which the birds were not exposed to time-dependent magnetic fields (spring 2012, mean direction 17° ± 30° (95% confidence interval), r = 0.43, p < 0.01, N = 31). (B) Birds exposed to 1.363 MHz with a peak intensity of 48 nT (spring 2012, mean direction 358°, r = 0.25, p = 0.138, N = 31). (C) Birds exposed to 2.726 MHz with a peak intensity of 48 nT (spring 2012, mean direction 356°, r = 0.24, p = 0.179, N = 30). (D) Birds exposed to 50 Hz with a peak intensity of ~400 nT (spring 2013, 46° ± 50°, r = 0.45, p < 0.05, N = 19). (E) Birds exposed to 1.363 MHz with a peak intensity of ~400 nT (spring 2013, 38° ± 37°, r = 0.48, p < 0.01, N = 20). (F) Birds exposed to 2.726 MHz with a peak intensity of ~400 nT (spring 2013, 23° ± 35°, r = 0.49, p < 0.01, N = 20). Each dot represents the mean heading of an individual bird, the arrows indicate the group mean vector, the radial lines flanking the group mean vector indicate the 95% confidence interval for the group mean direction and the dashed circles represent the significance levels (p < 0.05 and p < 0.01) according to the Rayleigh test. mN, magnetic North.
Figure 6
Broadband electromagnetic noise disrupts the birds’ magnetic orientation capabilities whereas a narrow-band field at 1.315 MHz does not. The birds were able to orient in the dummy condition in the natural geomagnetic field (NMF), (A), mean direction 313° ± 34°, r = 0.54, p < 0.01, N = 16 and the changed magnetic field (CMF), (D), mean direction 96° ± 44°, r = 0.49, p < 0.05, N = 16 and when exposed to 1.315 MHz (NMF, (B), mean direction 281° ± 34°, r = 0.56, p < 0.01, N = 16; CMF, (E), 1.315 MHz: mean direction 20° ± 25°, r = 0.62, p < 0.001, N = 16). In contrast, the same birds were disoriented when exposed to artificial broadband noise (~2 kHz to ~9 MHz), NMF: (C), mean direction 265°, r = 0.17, p = 0.603, N = 16; CMF: (F), 21°, r = 0.19, p = 0.557, N = 16. All experiments were done in autumn 2013. For a description of the circular diagrams, see the legend to Figure 5. gN, geographic North.
Figure 7
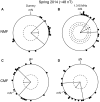
Replication of the experiments from autumn 2013. (A,C) The birds’ orientation under the dummy condition in spring 2014. (B,D) The orientation of the birds during exposure to 1.315 MHz in spring 2014. The data in (A,B) were collected in an unchanged magnetic field (NMF, dummy: mean direction 89° ± 41°, r = 0.44, p < 0.05, N = 16; 1.315 MHz: mean direction 61° ± 26°, r = 0.64, p < 0.001, N = 18). The data in (C,D) were collected in a magnetic field turned 120° counterclockwise (CMF, dummy: mean direction 268° ± 46°, r = 0.42, p < 0.05, N = 18; 1.315 MHz: mean direction 218° ± 48°, r = 0.42, p < 0.05, N = 20). For a description of the circular diagrams, see the legend to Figure 5.
Similar articles
- Broadband 75-85 MHz radiofrequency fields disrupt magnetic compass orientation in night-migratory songbirds consistent with a flavin-based radical pair magnetoreceptor.
Leberecht B, Kobylkov D, Karwinkel T, Döge S, Burnus L, Wong SY, Apte S, Haase K, Musielak I, Chetverikova R, Dautaj G, Bassetto M, Winklhofer M, Hore PJ, Mouritsen H. Leberecht B, et al. J Comp Physiol A Neuroethol Sens Neural Behav Physiol. 2022 Jan;208(1):97-106. doi: 10.1007/s00359-021-01537-8. Epub 2022 Jan 12. J Comp Physiol A Neuroethol Sens Neural Behav Physiol. 2022. PMID: 35019998 Free PMC article. - Anthropogenic electromagnetic noise disrupts magnetic compass orientation in a migratory bird.
Engels S, Schneider NL, Lefeldt N, Hein CM, Zapka M, Michalik A, Elbers D, Kittel A, Hore PJ, Mouritsen H. Engels S, et al. Nature. 2014 May 15;509(7500):353-6. doi: 10.1038/nature13290. Epub 2014 May 7. Nature. 2014. PMID: 24805233 - Electromagnetic 0.1-100 kHz noise does not disrupt orientation in a night-migrating songbird implying a spin coherence lifetime of less than 10 µs.
Kobylkov D, Wynn J, Winklhofer M, Chetverikova R, Xu J, Hiscock H, Hore PJ, Mouritsen H. Kobylkov D, et al. J R Soc Interface. 2019 Dec;16(161):20190716. doi: 10.1098/rsif.2019.0716. Epub 2019 Dec 18. J R Soc Interface. 2019. PMID: 31847760 Free PMC article. - Sensing magnetic directions in birds: radical pair processes involving cryptochrome.
Wiltschko R, Wiltschko W. Wiltschko R, et al. Biosensors (Basel). 2014 Jul 24;4(3):221-42. doi: 10.3390/bios4030221. eCollection 2014 Sep. Biosensors (Basel). 2014. PMID: 25587420 Free PMC article. Review. - The development of migratory orientation mechanisms.
Able KP. Able KP. EXS. 1991;60:166-79. doi: 10.1007/978-3-0348-7208-9_8. EXS. 1991. PMID: 1838514 Review.
Cited by
- Biological Effects of Electric, Magnetic, and Electromagnetic Fields from 0 to 100 MHz on Fauna and Flora: Workshop Report.
Pophof B, Henschenmacher B, Kattnig DR, Kuhne J, Vian A, Ziegelberger G. Pophof B, et al. Health Phys. 2023 Jan 1;124(1):39-52. doi: 10.1097/HP.0000000000001624. Epub 2022 Nov 3. Health Phys. 2023. PMID: 36480584 Free PMC article. - Scientific evidence invalidates health assumptions underlying the FCC and ICNIRP exposure limit determinations for radiofrequency radiation: implications for 5G.
International Commission on the Biological Effects of Electromagnetic Fields (ICBE-EMF). International Commission on the Biological Effects of Electromagnetic Fields (ICBE-EMF). Environ Health. 2022 Oct 18;21(1):92. doi: 10.1186/s12940-022-00900-9. Environ Health. 2022. PMID: 36253855 Free PMC article. - Low-level EMF effects on wildlife and plants: What research tells us about an ecosystem approach.
Levitt BB, Lai HC, Manville AM 2nd. Levitt BB, et al. Front Public Health. 2022 Nov 25;10:1000840. doi: 10.3389/fpubh.2022.1000840. eCollection 2022. Front Public Health. 2022. PMID: 36505009 Free PMC article. - Prussian blue technique is prone to yield false negative results in magnetoreception research.
Curdt F, Haase K, Ziegenbalg L, Greb H, Heyers D, Winklhofer M. Curdt F, et al. Sci Rep. 2022 May 25;12(1):8803. doi: 10.1038/s41598-022-12398-9. Sci Rep. 2022. PMID: 35614116 Free PMC article. - Low-Light Dependence of the Magnetic Field Effect on Cryptochromes: Possible Relevance to Plant Ecology.
Vanderstraeten J, Gailly P, Malkemper EP. Vanderstraeten J, et al. Front Plant Sci. 2018 Feb 14;9:121. doi: 10.3389/fpls.2018.00121. eCollection 2018. Front Plant Sci. 2018. PMID: 29491873 Free PMC article.
References
- Batschelet E. (1981). “Circular statistics in biology,” in Mathematics in Biology, eds Sibson R., Cohen J. E. (London: Academic Press; ), 3–362.
- Cintolesi F., Ritz T., Kay C. W. M., Timmel C. R., Hore P. J. (2003). Anisotropic recombination of an immobilized photoinduced radical pair in a 50-μT magnetic field: a model avian photomagnetoreceptor. Chem. Phys. 294, 385–399. 10.1016/s0301-0104(03)00320-3 - DOI
LinkOut - more resources
Full Text Sources
Other Literature Sources


