Lung Structure and the Intrinsic Challenges of Gas Exchange - PubMed (original) (raw)
Review
Lung Structure and the Intrinsic Challenges of Gas Exchange
Connie C W Hsia et al. Compr Physiol. 2016.
Abstract
Structural and functional complexities of the mammalian lung evolved to meet a unique set of challenges, namely, the provision of efficient delivery of inspired air to all lung units within a confined thoracic space, to build a large gas exchange surface associated with minimal barrier thickness and a microvascular network to accommodate the entire right ventricular cardiac output while withstanding cyclic mechanical stresses that increase several folds from rest to exercise. Intricate regulatory mechanisms at every level ensure that the dynamic capacities of ventilation, perfusion, diffusion, and chemical binding to hemoglobin are commensurate with usual metabolic demands and periodic extreme needs for activity and survival. This article reviews the structural design of mammalian and human lung, its functional challenges, limitations, and potential for adaptation. We discuss (i) the evolutionary origin of alveolar lungs and its advantages and compromises, (ii) structural determinants of alveolar gas exchange, including architecture of conducting bronchovascular trees that converge in gas exchange units, (iii) the challenges of matching ventilation, perfusion, and diffusion and tissue-erythrocyte and thoracopulmonary interactions. The notion of erythrocytes as an integral component of the gas exchanger is emphasized. We further discuss the signals, sources, and limits of structural plasticity of the lung in alveolar hypoxia and following a loss of lung units, and the promise and caveats of interventions aimed at augmenting endogenous adaptive responses. Our objective is to understand how individual components are matched at multiple levels to optimize organ function in the face of physiological demands or pathological constraints.
Copyright © 2016 John Wiley & Sons, Inc.
Figures
Figure 1
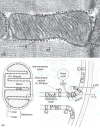
(A) Electron micrograph of muscle mitochondrion shows the packing of inner membrane cristae where oxidative phosphorylation takes place, separated by matrix where the Krebs cycle is located. Note glycogen granules as fuel reserves on the surface. (B) Scheme of functional organization of mitochondria. A from (390) with permission; B from (376) with permission.
Figure 2
Model of the mammalian pathway for oxygen in form of a cascade from the lung through the circulation of blood to the mitochondria. The oxygen flow rate through each step is the product of a conductance with a pressure difference, which decreases stepwise from inspired PO2 (PI) to near 0 at the level of mitochondria that serve as oxygen sink. Subscripts for partial pressures P: I inspired and E expired air, A alveolar air, b capillary blood, a arterial and v mixed venous blood, c cytoplasm. Taken, with permission, from (376).
Figure 3
Variation in vertebrate lung structure and function. In alveolar lungs as occur in mammals, gas exchange occurs by air flowing in through the airways and mixing with air contained in the alveolar pool and blood flowing by in the pulmonary capillaries. In bird lungs, air flows through parabronchi in a caudal to cranial direction using the air sacs as bellows. Gas exchange occurs in a cross-current fashion between air capillaries of the parabronchi and the blood capillaries. With this type of arrangement, arterial PO2 may be higher than expired air PO2. Modified, with permission, from Weibel, 1984 (376).
Figure 4
Allometric plot of the alveolar surface area and the harmonic mean thickness of the air-blood barrier in mammals from the smallest species (Suncus Etruscus) to horse and cow. Taken from (111) by permission.
Figure 5
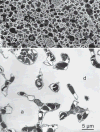
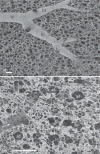
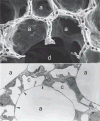
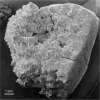
Structure of the gas exchanger in the smallest mammal, an Etruscan shrew (2 g), (A) in a scanning electron micrograph that reveals the small size of alveoli (a) and alveolar ducts (d) as well as erythrocytes in a small vessel (v), resulting in a six times higher density of alveolar surface compared with a human lung (compare Fig. 13). (B) On thin sections, the alveolar capillaries are seen to form an exceptionally dense network that occupies about 20% of the parenchymal volume.
Figure 6
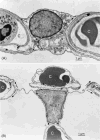
Comparing fine structure of the alveolar-capillary tissue barrier in the lung of a monkey (A) and of an Etruscan shrew (B) reveals extreme attenuation of the air-blood barrier in the shrew (circle). In the monkey lung, the type-1 epithelial cell (AEp1) forms cytoplasmic leaflets on both sides of the septum (arrows). In the shrew lung, the thinning of the barrier is achieved by minimization of the epithelial cytoplasmic leaflets by highly complex branching of the type-1 epithelial cell extensions (multiple arrows), combined with similar thinning of the endothelial cell extensions of capillaries (C).
Figure 7
Histological section of the subpleural region of human fetal lung (about 12th week of gestation, pseudoglandular stage) shows the branching pattern by dichotomy in the terminal branches ending in spherical buds (*) from where branching will continue. These terminal buds are enwrapped by loose, cell-rich mesenchyme. More central branches (b) that do not further divide have a thicker epithelium and are enwrapped by dense mesenchyme and develop smooth muscle sleeves characteristic of bronchi. Pulmonary artery branches (pa), provided by a sheath of smooth muscle, are close to the bronchi and follow their course peripherally whereas pulmonary veins (pv) are located in the wider mesenchymal septa.
Figure 8
Fractal tree model of Benoit Mandelbrot simulates a space-filling airway tree. Taken from (235) by permission.
Figure 9
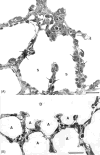
(A) Rat lung at birth is made of wide saccules (S) separated by septa containing two capillary networks (paired arrows). (B) Thin section of rat lung on day 13 of postnatal development. Alveoli have formed by pulling up septa into the alveolar duct (D) corresponding to the saccule in (A); the septa contain a single capillary network. Panel A, with permission, from (39); panel B, with permission, from (376).
Figure 10
As lung volume increases in the rat lung during early postnatal growth the alveolar surface is enlarged in three stages, with a prominent increase by a factor of 3 between days 4 and 21 due to the formation of alveoli. Taken, with permission, from (376).
Figure 11
Scanning electron micrographs of dog lung. (A) Longitudinal cut of a branching distal bronchiolus (bl) giving rise to transitional bronchioles (arrows) as origin of acini; the tip of the arrows points to the first alveoli occurring in the airway wall. (B) Origin of acinar airways (arrow) at transitional bronchiole (tbl) leading to a respiratory bronchiole (rbl) and several alveolar ducts (ad); the latter change very little in diameter with each generation so that total airway cross-section nearly doubles with each generation. Scale bars = 500 μm.
Figure 12
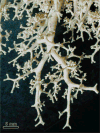
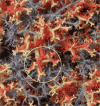
Cast of human bronchial tree with airways (yellow), pulmonary arteries (red), and pulmonary veins (blue).
Figure 13
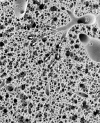
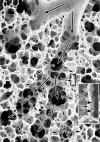
Scanning electron micrograph of human lung parenchyma. Alveolar ducts (d) are surrounded by alveoli (a), which are separated by thin septa.
Figure 14
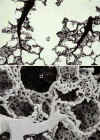
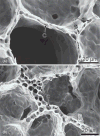
Microvascular network of the lung shown in (A) by colloidal gold labeling of the plasma in a rabbit lung (212), and in (B) in a Mercox cast of a rat lung. Note relations to alveolar ducts (d) and alveoli (a). B courtesy of P.H. Burri.
Figure 15
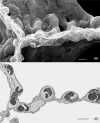
Architecture of interalveolar septa in the human lung reveals that each wall contains a single capillary network with a thin tissue barrier separating the blood from the alveolar air. (A) This panel is a scanning electron micrograph from a human lung that shows the capillary network in 3D and (B) this panel is an electron micrograph of a thin section showing the capillary blood and the thin tissue barrier. Scale markers 10 μm.
Figure 16
The alveolar capillary is lined by endothelial cells (End) that form thin cytoplasmic leaflets in the thin barrier portions. The alveoli are lined by epithelial cells, here a type-1 cell (Ep1) is shown to also form thin cytoplasmic leaflets, which are separated from the endothelial cell by a single fused basement membrane in the upper part (circle), whereas in the lower part the two basement membranes are separated to allow the formation of a slim interstitial space with processes of a fibroblast (f) and some connective tissue fibers for mechanical support (arrow).
Figure 17
Capillaries (c) in alveolar septum of perfusion-fixed rabbit lung shows preserved alveolar surface lining layer (sl) with surfactant film (arrowheads) smoothing the epithelial surface. Fibroblast (f) occurs in the thicker part of the barrier.
Figure 18
Surface of the alveolar wall in the human lung seen by scanning electron microscopy reveals a mosaic of alveolar epithelium made of type-1 (Ep1) and type-2 (EP2) cells. Arrows indicate boundary of the cytoplasmic leaflet of the type-1 cell which extends over many capillaries.
Figure 19
A type-2 epithelial cell from a dog lung forms junctions (J) with type-1 epithelial cells (EP1). Its cytoplasm contains osmiophilic lamellar bodies (LB) as storage granules for surfactant phospholipids, and a rich complement of organelles, such as mitochondria and endoplasmic reticulum surrounding the nucleus (N). Arrowhead marks point at which a lamellar body is in the process of secretion onto the alveolar surface.
Figure 20
Model of alveolar septum shows capillary network (red) interlaced with the network of connective tissue fibers (green) that extends from the free edge of the septum (alveolar entrance ring) at the right to the triple line on the left where three septa are joined (compare Fig. 13).
Figure 21
Electron micrographs of alveolar septa in human lung show the relative arrangement of capillaries (C), type-1 alveolar epithelium (Ep1) and elements of the interstitium such as collagen (cf) and elastic (ef) fibers and fibroblast (fb) that focally can form myofibrils (myo) and serve as myofibroblasts bracing the interstitial space. The top panel (A) is from the mid-part of a septum, the bottom panel (B) shows the strong fibers at the free edge of the septum forming the alveolar entrance ring that may contain some smooth muscle cells (sm). A pericyte (pc) is associated with the capillary.
Figure 22
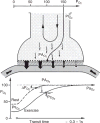
Model of gas exchange showing gradual rise of capillary PO2 (PcO2) as blood flows through capillary until it approaches alveolar PO2 (PAO2). Taken from Weibel (376) with permission.
Figure 23
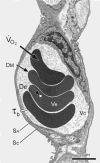
Morphometric model for calculating diffusion capacity, DL. Its two components are (A) the membrane conductance DM, which extends from the alveolar surface (SA) to the nearest erythrocyte membrane traversing the tissue barrier, the capillary surface Sc, and the plasma layer over the distance _τ_b; and (B) the conductance of the erythrocyte interior, De, that depends on the capillary and the erythrocyte volume, Vc and Ve, respectively. (See text.) Taken, with permission, from Ochs and Weibel (266).
Figure 24
Electron micrograph of human lung showing the method for measuring total barrier thickness from the intercept length lb with random line probes. A set of test lines made of a sampling test line (solid line) followed by a guard extension (broken line) is randomly placed, when the sampling line hits the alveolar surface the distance to the nearest erythrocyte membrane is measured as the barrier intercept length lb, preferably using a logarithmic scale. Taken, with permission, from (388).
Figure 25
The CO flux across tissue-erythrocyte barrier to binding with hemoglobin is simulated by placing different distributions of the same number of erythrocytes inside a hypothetical capillary segment. Compared to uniform erythrocyte distribution, the nonuniform clustered and random distributions show more heterogeneity in CO flux with respect to the tissue-erythrocyte membrane. Total CO flux progressively increases from clustered to random and to uniform erythrocyte distributions. Taken, with permission, from (178).
Figure 26
Lung diffusing capacity (DLCO) measured by physiological and morphometric methods. Left: DLCO and pulmonary blood flow were measured by a rebreathing technique at rest and during exercise in dogs following right pneumonectomy (R-PNX) or in control (Sham) animals. Middle: DLCO estimated by a morphometric model in the remaining left lung of animals after R-PNX compared with that in left lung and both lungs of control (Sham) animals. Symbols represent individual animals; bars represent group means. *P < 0.0001 vs. Sham left lung. Right: Correlation between DLCO measured by a rebreathing method at peak exercise and by morphometry in different groups subjected to PNX or Sham PNX either as puppies (Sham, open circles; right PNX, closed circles) or as adults (Sham, open squares; right PNX, closed squares; left PNX, asterisks). Solid line, regression line through all data points. DLCO(morphometry) = 0.90 DLCO(rebreathing) + 1.62, r = 0.803. Dashed line = identity. Taken, with permission, from (338).
Figure 27
Integral connectivity throughout the lung is established by (A) a fiber continuum made of axial (a, red), septal (s, green), and peripheral (p, black) fibers. (B) Scanning electron micrograph of an alveolar duct outlined by a network of axial fibers (arrow) that are seen in section (C) to be reinforced by strong fiber bundles (arrows) (compare Fig. 21). Modified, with permission, from (384).
Figure 28
Model of the disposition of axial, septal, and peripheral fibers in the acinar airway, with the effect of surface forces indicated by arrows: negative in alveoli and strongly positive on the free edge of the alveolar septum. Reprinted by permission from (376).
Figure 29
(A) Scanning electron micrograph of alveoli (a) related to alveolar duct (d) in rabbit lung perfusion-fixed at an inflation level of 60% TLC. Note smooth alveolar surface. (B) Thin section of similarly prepared rat lung with empty capillaries (c) shows the pleating of the tissue barrier beneath the surface lining layer with surfactant (arrows) with the result that thick barrier portions, such as type-2 cells (Ep2) are shifted away from the surface so that thin barrier portions predominate at the free surface, resulting in a thinner diffusion barrier (398).
Figure 30
Variation of alveolar surface area in perfusion-fixed rabbit lungs. Steep increase when starting from deflated lung up to TLC (broken green lines) but reduced reduction when the lung is deflated to 80% and 40% TLC (80D and 40D); reinflation (RI) from 40% to 80% TLC occurs on the deflation slope. Data taken, with permission, from (7).
Figure 31
Representative micrographs from the rabbit lungs deflated to 40% TLC (D40) or to 80% TLC (D80). At 80% TLC, a more or less homogeneous enlargement of air spaces was found, but predominantly involving the alveolar ducts (d) (arrows). Modified, with permission, from (210).
Figure 32
Model showing the micromechanical forces of surface tension, tissue tension, and capillary distending pressure that shape the alveolar septum. Taken, with permission, from (376).
Figure 33
Scanning electron micrographs of alveolar walls of rabbit lungs fixed under (A) zone 2 and (B) zone 3 conditions of perfusion. Note that capillaries are wide in zone 3 and slit-like in zone 2, except for “corner capillaries” at the junction of three septa, which are wide in either case. Taken, with permission, from (9).
Figure 34
Flat view of alveolar septum of rabbit lung showing the perfused capillary network with plasma marked by colloidal gold (black) and erythrocytes (EC) appearing as unstained “rings” or “bars” depending on orientation. Note that all segments have been perfused in the 2 min prior to stop of blood flow and fixation. At the bottom a strong alveolar entrance ring (AE) marks the free edge of the septum.
Figure 35
Distribution of center-to-center distance between erythrocytes along the capillary path (inset) in flat views of alveolar septa in rabbit lungs fixed under controlled blood flow conditions (compare Fig. 34). Taken, with permission, from (388).
Figure 36
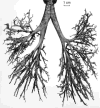
Anterior view of the original plastic cast of an adult human bronchial tree used for measurements of airway dimensions in the first 10 to 15 generations. Taken, with permission, from (369,389).
Figure 37
Peripheral branches of airways in a contemporary human cast show a similar branching pattern as that of the more central branches shown in Figures 36 or 12.
Figure 38
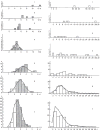
Frequency distribution of the diameters (left column) and lengths (right column) of airways of the first seven generations of branching in the human lung shown in Figure 36. Taken, with permission, from (369).
Figure 39
Average diameter of conducting airways, respiratory bronchioles and precapillary blood vessels in the adult human lung plotted semilogarithmically as a function of the order of generation of dichotomous branching. Taken, with permission, from (389).
Figure 40
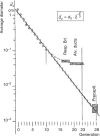
Semilogarithmic plot of airway dimensions in human lung with improved dimensions of the peripheral acinar airways with transitional bronchiole in generation 14. This shows that the diameter of conducting airways is reduced by the cube root of ½ with each generation, whereas the intra-acinar airways are reduced to a lesser degree. Taken, with permission, from (126).
Figure 41
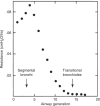
Airway resistance to mass air flow is located mostly in the conducting airways and falls rapidly toward the periphery. Redrawn, with permission, after (278).
Figure 42
Model of human airway tree derived from finite element analysis of computer-tomographic reconstructions of airways compares well with anatomical lung casts such as in Figures 12 and 37. Taken, with permission, from (342).
Figure 43
Patterns of airway branching by (A) regular (symmetric) dichotomy, (B) irregular dichotomy numbered by “generations down,” (C) irregular dichotomy numbered by “orders up.”
Figure 44
Scanning electron micrograph of vascular perfusion-fixed rabbit lung shows branching of small peripheral bronchiole (B) into transitional bronchioles (T), from where the airways continue into respiratory bronchioles and alveolar ducts (arrows). Note the location of the pulmonary artery (a) and vein (v). Modified, with permission, after (376).
Figure 45
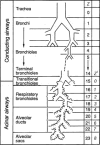
Hierarchical model of the human airway tree from conducting to acinar airways. The transition from conducting to acinar airways occurs at generation Z = 15, on average, with the occurrence of the first alveoli. Z′ is the generation of acinar airways.
Figure 46
Gradual transition of mass air flow to oxygen diffusion in the peripheral airways.
Figure 47
Total cross-sectional area of all airways in each generation of the human lung is plotted against path length from trachea to acinar airways, showing the progressive increase of total airway cross-sectional area per generation and the resulting airflow velocity at rest and in exercise.
Figure 48
Dispersion diagram of diameter and length of airway segments in the generations 5 to 10 in the human lung. Slope of diagonal corresponds to average diameter-to-length ratio in each generation which is similar in all generations. Taken, with permission, from (369).
Figure 49
Distribution of airways of diameter d* per generations (left column) and at distance Δ from the origin of the trachea (right column). Curves for 2 mm airways are a binomial distribution with respect to generations and a normal distribution with respect to distance. Taken, with permission, from (369).
Figure 50
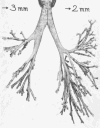
View of the cast in Figure 36 showing termination at branches with diameters 3 and 2 mm, respectively. Taken, with permission, from (369).
Figure 51
Distribution of distances _D_′ of branches of diameter d* = 2 mm from their parent branches of diameter d* = 4 mm. Taken, with permission, from (369).
Figure 52
Frequency distribution of airways of diameters (_d_μ) 0.2 and 0.05 cm with respect to bronchial path length from the tracheal origin. Open circles mark the position of the terminal airways, the alveolar sacs of the acinar airways. Modified, with permission, after (376).
Figure 53
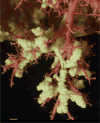
Detail view of the spatial relations of airways (yellow), pulmonary arteries (red), and pulmonary veins (blue) in a cast of a human lung similar to that in Figure 12. The main tract of the arteries follow closely the airway both in terms of branching pattern and diameter; they thus determine the lung architecture in terms of bronchoarterial units. In contrast, the pulmonary veins take an intermediary position between the bronchoarterial units thus collecting blood from several adjacent units. Toward the periphery pulmonary arteries branch more frequently than the airways and thus form “supernumerary” branches (arrows) that lead blood into gas-exchange units. Scale bar 5 mm.
Figure 54
Periphery of plastic cast of human airways and arteries where the airway cast extends into the first few generations of the acinus also filling alveoli. The green arrow marks the transitional bronchiole. Note that the pulmonary artery branches (red) branch along with the airways even into the acinus with many “supernumerary” to feed alveolar capillary networks (compare Fig. 14). Scale bar 1 mm.
Figure 55
Plastic cast of human lung airways and vasculature seen from the pleura with bronchoarterial units (circle) surrounded by tufts of pulmonary veins showing the mosaic architecture of peripheral respiratory units. Scale bar 5 mm.
Figure 56
Silicon rubber cast of human acinus beginning with the transitional bronchiole (tb) where the first alveoli appear (arrows). Taken, with permission, from (126).
Figure 57
Scanning electron micrograph of an acinus of a human lung where some of the alveolar ducts and sacs were trimmed off to show the internal organization with respiratory bronchioles (R) following on the transitional bronchiole (T) leading to alveolar ducts (AD) and sacs (AS). The two straight lines delimit a 1/8 subacinus. Modified taken, with permission, from (126).
Figure 58
Frequency distribution of acinar volume in human lungs. Taken, with permission, from (126).
Figure 59
Branching pattern of acinar airways in average size human acinus. The first three generations are respiratory bronchioles with incomplete alveolar sleeve. The 1/8 subacini that follow on these respiratory bronchioles represent parts of the acinus where the entire airway surface is occupied by alveoli. Taken, with permission, from (126).
Figure 60
Change of length and diameters of airway segments with progressive generations of branching. Taken, with permission, from (126).
Figure 61
Distribution of longitudinal path length from transitional bronchiole to terminal sacs. Taken, with permission, from (126).
Figure 62
Alveolar capillary network unit corresponding to an alveolar wall segment with connecting arteriole (PA) and venule (PV) extending to alveolar entrance ring (AER).
Figure 63
Models of ventilation-perfusion relationship in the mammalian pulmonary gas exchanger. (A) Parallel ventilation-parallel perfusion. (B) Serial ventilation-parallel perfusion. Taken, with permission, from (310).
Figure 64
Central part of the acinar airways beginning with transitional bronchiole (T) and leading into the branched alveolar ducts. On inspiration air flows in by convection (straight arrows), but as flow velocity falls diffusion of O2 (wiggly arrows) becomes the dominant mechanism for bringing O2 to the gas-exchange surface. All along acinar airways O2 is absorbed by the capillary blood in the septa (inset, arrowheads). Taken, with permission, from (266).
Figure 65
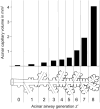
Typical path model of human pulmonary acinus showing the distribution of capillary volume per acinar airway generations of a symmetric branching pattern. Gas-exchange surface shows the same distribution pattern due to doubling the number of segments with each generation.
Figure 66
Variation of the human acinus Peclet number at exercise and at rest as a function of the depth in the acinar pathway. One observes a large shift between rest and exercise. The transition from convection to diffusion is moved from generation 18 to 21. Taken, with permission, from (310).
Figure 67
Spatiotemporal distribution of the local partial pressure of oxygen P(x,t), as a function of the generation (the integrative permeability is taken equal to 3.5 m/s). The time t = 0 corresponds to the beginning of inspiration. Note that the pressure increases to reach the value PIO2 only after a delay corresponding to the time of flight of air from the mouth to the acinus entrance (located at the rear of the figure). Taken, with permission, from (98).
Figure 68
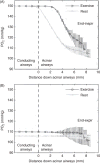
Spatial variation in alveolar PO2 down the acinar airway tree at end inspiration (A) and end expiration (B) for rest and moderate exercise conditions. Error bars show maximum and minimum values at different acinar path lengths. Taken, with permission, from (336).
Figure 69
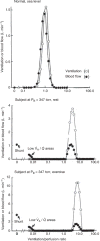
Normal ventilation/perfusion (V⋅A/Q⋅) ratio distribution in a healthy subject at sea level (upper), and abnormal distribution in a subject who developed pulmonary edema at simulated high altitude (middle and lower). In the latter subject at rest, there is a 15% shunt and an additional 10% of cardiac output perfusing areas of low V⋅A/Q⋅ (middle). Upon exercise, shunt increased to 29%, with 17% of the cardiac output perfusing low V⋅A/Q⋅ areas (lower). Taken, with permission, from (170,195).
Figure 70
Ventilation/perfusion (V⋅A/Q⋅) maps and distribution of ventilation and perfusion to different V⋅A/Q⋅ compartments as derived from electrical impedance tomography. On the color scale red indicates shunt, green indicates V⋅A/Q⋅=1.0, and white indicate dead space ventilation. (A–C) From a mechanically ventilated pig with normal lungs; (D–F) from the same animal after induction of atelectasis of the left lung. Taken, with permission, from Peterssen and Glenny (280) based on data of Costa et al. (56).
Figure 71
Anatomical and functional microvascular recruitment of subpleural alveolar capillaries. Upper: Anatomical recruitment in canine lung is observed by in vivo videomicroscopy. The number of subpleural alveolar capillaries perfused by erythrocytes increases progressively with increasing pulmonary perfusion or vascular pressure (267). Lower: Functional recruitment of DLCO with respect to cardiac output in healthy human subjects from rest to peak exercise indicates the utilization of microvascular reserves for gas exchange. Adapted, with permission, from (170).
Figure 72
Diffusion-perfusion (DL/Q⋅) ratio. Left: The DL/Q⋅ ratio normally declines as cardiac output increases from rest to exercise. Middle: Relationship between end-capillary blood O2 saturation (Sc′O2) and DL/Q⋅. The exercise-related decline in DL/Q⋅ does not alter Sc′O2 in average subjects but may fall below a critical threshold in athletes who reach a higher maximal cardiac output, causing end Sc′O2 to fall. Right: The magnitude and distribution of DL/Q⋅ determine the average alveolar-capillary transit time and Sc′O2, shown for a normal subject and a subject with pulmonary fibrosis. Intersections of the vertical dashed lines with the curves indicate the predicted Sc′O2 at rest and maximal exercise. In pulmonary fibrosis, alveolar capillary obliteration causes Sc′O2 to be lower at any given exercise intensity. In addition, Sc′O2 is lower at a given mean transit time due to uneven distribution of DL/Q⋅ ratio among the remaining capillaries. Adapted, with permission, from (152) and (170).
Figure 73
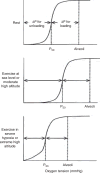
Schematic diagram illustrates active regulation of O2 loading and unloading in the lung and the periphery via the P50 of the ODC. Adapted, with permission, from (168).
Figure 74
Coupled O2 and CO2 exchange by erythrocytes. In peripheral capillaries, CO2 diffuses from tissue into erythrocytes and is converted by carbonic anhydrase (CA) to bicarbonate (HCO3−) and proton (H+). Proton binds to a histidine residue on globin to stabilize the deoxyhemoglobin conformation, thereby facilitating O2 release to tissue. CO2 also binds directly to oxyhemoglobin to form carbaminohemoglobin, which facilitates O2 release. Bicarbonate is shuttled out of the cell via the membrane transporter anion exchanger (AE)-1. Any excess H+ ions are shuttled out of the cell via the NHE. In pulmonary capillaries, these reactions run in reverse.
Figure 75
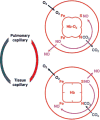
Allosteric O2-CO2-NO interactions with hemoglobin (Hb) inside erythrocytes. CO2 binds to terminal amine groups of the globin chain to form carbamino (NCO2) hemoglobin. NO can bind to sulfhydryl groups at a cysteine residue (Cys_β_93) to form S-nitrosohemoglobin (SNO-Hb) or be scavenged by the ferrous (Fe) binding site. In the pulmonary capillary, inspired O2 reacts with Fe to form oxyhemoglobin (HbO2), causing conformational changes that facilitate unloading of CO2 from NCO2 and NO from Fe-binding sites while facilitating the formation of SNO-Hb. The exact opposite process occurs in peripheral capillaries where O2 is unloaded from HbO2. Conformational changes associated with the formation of deoxyhemoglobin (Hb) facilitates CO2 loading to form NCO2 as well as NO dissociation from SNO-Hb. The released free NO may be scavenged by the Fe binding sites or bind other thiol carriers and exit the erythrocyte to modulate local vasodilation. These coupled interactions optimize gas exchange in the lung and the periphery.
Figure 76
Mechanical interactions between the lung and the thorax during lung growth. Adapted, with permission, from (154).
Figure 77
Allometric scaling of maximal O2 consumption (V⋅O2max), muscle mitochondrial volume [V(mt)], and morphometric pulmonary diffusing capacity (DLO2) in mammals weighing from 20 g to 500 kg. Taken, with permission, from (396).
Figure 78
Effect of the size of acinar pathway on the PO2 profile at the alveolar surface. (A) Micrographs of mouse, rat, and human acini at same magnification; arrows indicate path length. (B) Model acini of different length showing parallel perfusion and serial ventilation with hypothetical PO2 profiles. Taken, with permission, from (376).
Figure 79
Matching the capacities of O2 transport components. Maximal O2 uptake and the capacities of the transport steps are shown in untrained college students at baseline, and after bed rest and physical training, compared to elite Olympic athletes. The capacities of cardiac output and peripheral tissue O2 extraction are much more malleable to physical training than that of ventilation or lung diffusion. In Olympic athletes, all capacities are well matched. Data are from Saltin et al. (306). Adapted, with permission, from (151).
Figure 80
Stimulus-response relationships in canine compensatory lung growth. Average fold changes in air space volume (top) and extravascular alveolar tissue volume (bottom) are shown in individual adult canine lobes that remain following different degrees of lung resection. Data are expressed as ratios with respect to the same lobe in control animals following sham lung resection. Left: 42% resection by left pneumonectomy; middle: 58% resection by right pneumonectomy; right: 70% resection by bilateral removal of four or five of the seven lobes. Mean ± SD. P < 0.05, * versus control (1.0); † versus 42%; a, versus right middle (RM) lobe; b, versus right infracardiac (RI) lobe; c, versus left cranial (LCr) lobe. Other lobes are RCr: right cranial, RCa: right caudal, LM: left middle (also known as inferior segment of LCr lobe), LCa: left caudal. Taken, with permission, from (297).
Figure 81
Relative increases in the volume of septal tissue and blood components in the remaining lung of young canines (~3 months old) 3 weeks (Hsia, original data) or ~43 weeks (338) after undergoing right pneumonectomy. Data are expressed as ratios to that in the corresponding lung of control animals following sham pneumonectomy.
Figure 82
Functional consequences of dysanaptic lung growth. Pulmonary vascular resistance at a given O2 uptake (left) and ventilatory power requirement at a given minute ventilation (middle) increase with increasing lung resection (removing 58% or ~70% of total lung units) and with mediastinal distortion (U: unbalanced resection, removing ~55% and ~15% of total lung units from right and left sides respectively. B: Balanced resection, removing ~35% of total units from each side) while DLO2 per unit of remaining lung continues to increase along a similar relationship with respect to pulmonary blood flow (right), indicating more vigorous compensation in alveolar function compared to that in bronchovascular function. Values are mean ± SD. *P < 0.05 versus Sham. † P < 0.05 versus 58%. § P < 0.05 versus 70% balanced. Adapted, with permission, from (155).
Figure 83
Structural and functional compensation in guinea pig lungs during high altitude (HA, 3800 m) residence compared to control animals raised at a lower altitude (LA, 1200 m) or sea level (SL). (A) Alveolar septal tissue volume. (B) Alveolar surface area. (C) Harmonic mean thickness of the diffusion barrier. Adapted from (180). (D) Lung diffusing capacity for carbon monoxide (DLCO) with respect to pulmonary blood flow measured after 4 months of exposure. *P < 0.05 versus SL, § P < 0.05 versus LA by comparison of regression lines. Adapted, with permission, from (414).
Figure 84
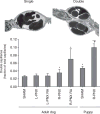
An increased prevalence of “double capillary” profiles reflects an attempt at new alveolar capillary formation but also distorts alveolar septal architecture. Electron micrographs illustrate typical double and single alveolar capillary profiles. Bar graph shows the prevalence of double capillary profiles in the lung of adult dogs and puppies under different experimental conditions. Mean ± SD. Sham: normal; L-PNX: left pneumonectomy; R-PNX: right pneumonectomy; RA: pneumonectomy followed by all-trans-retinoic acid supplementation. *P < 0.05 versus adult Sham; #P < 0.05 versus puppy Sham. Adapted, with permission, from (169).
Similar articles
- Fundamental structural aspects and features in the bioengineering of the gas exchangers: comparative perspectives.
Maina JN. Maina JN. Adv Anat Embryol Cell Biol. 2002;163:III-XII, 1-108. doi: 10.1007/978-3-642-55917-4. Adv Anat Embryol Cell Biol. 2002. PMID: 11892241 Review. - [Phylogeny of gas exchange systems].
Jürgens KD, Gros G. Jürgens KD, et al. Anasthesiol Intensivmed Notfallmed Schmerzther. 2002 Apr;37(4):185-98. doi: 10.1055/s-2002-25080. Anasthesiol Intensivmed Notfallmed Schmerzther. 2002. PMID: 11967744 German. - The matching of ventilation and perfusion in the lung of the Tegu lizard, Tupinambis nigropunctatus.
Hlastala MP, Standaert TA, Pierson DJ, Luchtel DL. Hlastala MP, et al. Respir Physiol. 1985 Jun;60(3):277-94. doi: 10.1016/0034-5687(85)90058-1. Respir Physiol. 1985. PMID: 4035106 - Bioengineering the Blood-gas Barrier.
Leiby KL, Raredon MSB, Niklason LE. Leiby KL, et al. Compr Physiol. 2020 Mar 12;10(2):415-452. doi: 10.1002/cphy.c190026. Compr Physiol. 2020. PMID: 32163210 Free PMC article. Review. - The Evolution of Unidirectional Pulmonary Airflow.
Farmer CG. Farmer CG. Physiology (Bethesda). 2015 Jul;30(4):260-72. doi: 10.1152/physiol.00056.2014. Physiology (Bethesda). 2015. PMID: 26136540 Review.
Cited by
- The Intersection of HIV and Pulmonary Vascular Health: From HIV Evolution to Vascular Cell Types to Disease Mechanisms.
Garcia AK, Almodovar S. Garcia AK, et al. J Vasc Dis. 2024 Jun;3(2):174-200. doi: 10.3390/jvd3020015. Epub 2024 May 6. J Vasc Dis. 2024. PMID: 39464800 Free PMC article. - TGFβ primes alveolar-like macrophages to induce type I IFN following TLR2 activation.
Thomas SM, Ankley LM, Conner KN, Rapp AW, McGee AP, LeSage F, Tanner CD, Vielma TE, Scheeres EC, Obar JJ, Olive AJ. Thomas SM, et al. bioRxiv [Preprint]. 2024 Sep 8:2024.09.04.611226. doi: 10.1101/2024.09.04.611226. bioRxiv. 2024. PMID: 39282428 Free PMC article. Preprint. - Evaluating the impact of type 2 diabetes mellitus on pulmonary vascular function and the development of pulmonary fibrosis.
Mzimela N, Dimba N, Sosibo A, Khathi A. Mzimela N, et al. Front Endocrinol (Lausanne). 2024 Jul 10;15:1431405. doi: 10.3389/fendo.2024.1431405. eCollection 2024. Front Endocrinol (Lausanne). 2024. PMID: 39050565 Free PMC article. Review. - Using a static magnetic field to attenuate the severity in COVID-19-invaded lungs.
Lai HY, Fan KC, Lee YH, Lew WZ, Lai WY, Lee SY, Chang WJ, Huang HM. Lai HY, et al. Sci Rep. 2024 Jul 22;14(1):16830. doi: 10.1038/s41598-024-67806-z. Sci Rep. 2024. PMID: 39039227 Free PMC article. - Assessment of pulmonary physiological changes caused by aging, cigarette smoking, and COPD with hyperpolarized 129Xe magnetic resonance.
Rao Q, Li H, Zhou Q, Zhang M, Zhao X, Shi L, Xie J, Fan L, Han Y, Guo F, Liu S, Zhou X. Rao Q, et al. Eur Radiol. 2024 Nov;34(11):7450-7459. doi: 10.1007/s00330-024-10800-w. Epub 2024 May 15. Eur Radiol. 2024. PMID: 38748243
References
- Alescio T, Cassini A. Induction in vitro of tracheal buds by pulmonary mesenchyme grafted on tracheal epithelium. J Exp Zool. 1962;150:83–94. - PubMed
- Alexander RM. Principles of Animal Locomotion. Princeton, NJ: Princeton University Press; 2003. p. 371.
- Altemeier WA, McKinney S, Glenny RW. Fractal nature of regional ventilation distribution. J Appl Physiol. 2000;88:1551–1557. - PubMed
Publication types
MeSH terms
LinkOut - more resources
Full Text Sources
Other Literature Sources
