Transcription facilitates sister chromatid cohesion on chromosomal arms - PubMed (original) (raw)
. 2016 Aug 19;44(14):6676-92.
doi: 10.1093/nar/gkw252. Epub 2016 Apr 15.
Affiliations
- PMID: 27084937
- PMCID: PMC5001582
- DOI: 10.1093/nar/gkw252
Transcription facilitates sister chromatid cohesion on chromosomal arms
Shweta Bhardwaj et al. Nucleic Acids Res. 2016.
Abstract
Cohesin is a multi-subunit protein complex essential for sister chromatid cohesion, gene expression and DNA damage repair. Although structurally well studied, the underlying determinant of cohesion establishment on chromosomal arms remains enigmatic. Here, we show two populations of functionally distinct cohesin on chromosomal arms using a combination of genomics and single-locus specific DNA-FISH analysis. Chromatin bound cohesin at the loading sites co-localizes with Pds5 and Eso1 resulting in stable cohesion. In contrast, cohesin independent of its loader is unable to maintain cohesion and associates with chromatin in a dynamic manner. Cohesive sites coincide with highly expressed genes and transcription inhibition leads to destabilization of cohesin on chromatin. Furthermore, induction of transcription results in de novo recruitment of cohesive cohesin. Our data suggest that transcription facilitates cohesin loading onto chromosomal arms and is a key determinant of cohesive sites in fission yeast.
© The Author(s) 2016. Published by Oxford University Press on behalf of Nucleic Acids Research.
Figures
Figure 1.
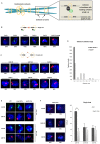
Cohesive and non-cohesive subsets of cohesin on chromosome arms in S. pombe. (A) An illustration of sister chromatids (blue) held together by the ring shaped cohesin complex (yellow) at centromeres and across the arm regions. The inset depicts cohesin enrichment at intergenic regions between convergent genes (grey arrows) on chromosome arms in S. pombe, wherein cohesin localizes with (top panel) or without (bottom panel) its loader Mis4-Ssl3 (black-green). (B) Top: schematic showing cohesed sister chromatids at Mis4+/Rad21+ sites visualized by DNA-FISH (red probes). Bottom: Single locus specific DNA FISH showing single dots at CARs I to VI (Mis4+/Rad21+ sites) in G2 cells (selected by septation index) (n = 200, three biological repeats). Red (Alexa-555) or green (Alexa-488) probes are shown inside DAPI stained nucleus (blue). (C) Top: schematic showing non-cohesed sister chromatids at Rad21+ sites visualized by DNA-FISH (increased separation between red probes). Bottom: Similar amount (±50%) of single-double dots at CAR VI to XII in G2 cells (selected by septation index) (n = 200, three biological repeats). Red (Alexa-555) or green (Alexa-488) probes are shown inside DAPI stained nucleus (blue). (D) Inter-chromatid distance measurement between sister chromatids at Mis4+/Rad21+ and Rad21+ regions. Z-stacks were converted into 2D images and distances between two spots measured using line scan tool of the ImageJ software. (E) DNA-FISH analysis in wild type (WT), mis4-367ts and rad21-K1ts strains after Mis4 and Rad21 inactivation by shift to 37°C. Top: cohesion at the arms, CAR III (green dots) was destabilized but cohesion at centromeres, CAR VI (red dots) was unaffected after 6 h at 37°C. Bottom: defective arm (CAR III) and centromeric cohesion (CAR VI) after 8 h at 37°C. Arm and centromeric cohesion was unaffected in WT throughout (n = 100 cells). (F) DNA-FISH analysis in rad21-K1ts strains after Rad21 inactivation by shift to 37°C. CARs III, VIII and IX were analyzed. Cells showing single or double dots were counted and plotted in a bar graph. * P < 0.05, two-tailed, paired Student's _t_-test, Error bars represent SD, n = 3.
Figure 2.
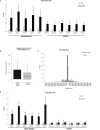
Cohesin and Pds5 co-localize at Mis4+/Rad21+ loci. (A) ChIP-qPCR analysis showing Rad21-Pk9 at selected CARs. No tag strain was used to assess the background levels. * P < 0.05, two-tailed, paired student's t-test for Rad21-Pk9 compared to background levels. Error bars represent SD, n = 3. (B) Cohesin enrichment at Mis4+/Rad21+ versus Rad21+ sites. Boxplots comparing sum of log2 Rad21 ChIP signal at Mis4+/Rad21+ versus Rad21+. P < 0.05, one-sided Wilcoxon Rank Sum test. (C) Pds5 enrichment at Mis4+/Rad21+ versus Rad21+ sites. Bar graph shows distances between Pds5 peak margins at Mis4+/Rad21+ and Rad21+ sites in 5000 nt bins. An overlap between intervals spanned by a Mis4+/Rad21+ and Pds5 peak gives a distance of 0. (D) ChIP-qPCR analysis showing Pds5-GFP at selected CARs. No tag strain was used to assess the background levels. *P < 0.05, two-tailed, paired Student's t_-_test for Pds5-GFP compared to background levels. Error bars represent SD, n = 3.
Figure 3.
Cohesin at Mis4+/Rad21+ loci is stabilized by Eso1. (A) ChIP-qPCR analysis showing Psm3-GFP enrichment at selected CARs in WT and eso1-H17 cells at 25°C. No tag strain was used to assess the background levels. *P < 0.05, two-tailed, paired Student's _t_-test for Psm3-GFP compared to background levels. Error bars represent SD, n = 3. (B) ChIP-qPCR analysis showing Psm3-GFP enrichment at selected CARs in WT and eso1-H17 cells at 37°C. No tag strain was used to assess the background levels. *P < 0.05, two-tailed, paired Student's _t_-test for Psm3-GFP compared to background levels. Error bars represent SD, n = 3. (C) ChIP-qPCR analysis showing Psm3-GFP enrichment at centromeric dg repeat (CAR VI) in WT and eso1-H17 cells at 25 and 37°C. Error bars represent SD, n = 3. (D) Left panel: western blot showing Eso1-GFP protein levels in G2/S phase cells. Whole cell extracts were prepared from cycling cells (G2), cells arrested in early S-phase with Hydroxyurea (HU) and subsequently released into G2 at indicated time points. No tag is a control for anti-GFP antibody specificity and Histone H3 is used as a loading control. Right panel: western blot showing Eso1-GFP protein levels in G1 synchronized cells through to G2 at respective time points. H3 is used as a control. (E) ChIP-qPCR analysis showing Eso1-GFP enrichment at selected CARs in G2 synchronized cells (cdc25-22, 37°C, 4 h). No tag strain was used to assess the background levels. * P < 0.05, two-tailed, paired Student's _t_-test for Eso1-GFP compared to background levels. Error bars represent SD, n = 3.
Figure 4.
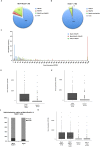
Cohesive sites overlap highly transcribed RNAPII regions. (A) Pie-chart showing overlap between Mis4+/Rad21+ loci and RNAPII genes, with a mere 4% overlap with only RNAPIII genes. (B) Pie-chart showing overlap between Rad21+ loci and RNAPII and RNAPIII genes. (C) Histogram showing the distribution of RNAPII genes versus gene expression in non-cohesin associated genes (blue bars, 1412 genes), cohesive (red bars, 91 genes) and non-cohesive loci (green bars, 187 genes). (D) Boxplots showing expression levels (Reads per Kilobase per Million; RPKM) of genes that overlap with Mis4+/Rad21+ and Rad21+ sites. P < 10−9, Wilcoxon Rank Sum test. (E) Boxplots showing expression level (reads per kilobase per million; RPKM) of genes that overlap with Ssl3+/Rad21+ and Rad21+ sites. P < 10−7, Wilcoxon Rank Sum test. (F) Graph showing Swi6 occupancy at Mis4+/Rad21+ and Rad21+ loci. (G) Boxplots showing Mis4+/Rad21+ sites overlap with highly expressed genes in comparison to Rad21+ sites, including or excluding Swi6 loci. Changes in gene expression of Mis4+/Rad21+/Swi6− loci compared to Mis4+/Rad21+/Swi6+ loci and Rad21+/Swi6− loci compared to Rad21+/Swi6+ loci are not significant. Changes in gene expression of Mis4+/Rad21+/Swi6− loci compared to Rad21+/Swi6− loci and Mis4+/Rad21+/Swi6+ loci compared to Rad21+/Swi6+ loci are significant (P < 10−9, Wilcoxon Rank Sum test).
Figure 5.
Transcription inhibition reduces chromatin association of cohesin proteins. (A) ChIP-qPCR analysis showing RNAPII occupancy after 1,10-phenanthroline treatment (300 μg/ml, 10 and 30 min) at selected promoters. *P < 0.05, two-tailed, paired Student's _t_-test between 0 and 30 min. Error bars represent SD, n = 3. (B) ChIP-qPCR analysis showing Rad21-GFP enrichment at CAR VI after 1,10-phenanthroline treatment (300 μg/ml, 10 and 30 min) in G2 synchronized cells (cdc25-22, 37°C 4 h). No tag strain was used to assess the background levels. *P < 0.05, two-tailed, paired Student's _t_-test for Rad21-GFP compared to background levels. Error bars represent SD, n = 3. (C) ChIP-qPCR analysis as in (B) at selected CARs. (D) ChIP-qPCR analysis as in (C) showing Mis4-GFP enrichment at selected CARs (E) Western blot showing RNAPII, Rad21-GFP, Mis4-GFP, H3 and tubulin protein levels after transcription inhibition using 1,10-phenanthroline (300 μg/ml, 30 min). Total RNAPII was probed with 8WG16 (ab817), Rad21 and Mis4 with anti-GFP (ab290) and histone H3 with anti-H3 (ab1791) antibody. (F) DNA-FISH analysis of CARs I and II after 1,10-phenanthroline treatment (300 μg/ml, 30 min).
Figure 6.
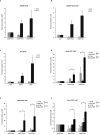
Transcription induction mediates cohesin proteins recruitment to chromatin. (A) ChIP-qPCR analysis showing RNAPII enrichment at selected promoters after heat shock at 42°C, 30 min. Values are normalized to rpl29. Error bars represent SD, n = 3. *P<0.05, one-tailed, paired Student's _t_-test comparing 42 to 32°C values. (B) ChIP-qPCR analysis showing enrichment of RNAPII phosphorylated at Ser5 at selected promoters after heat shock at 42°C, 30 min. Values are normalized to act1. Error bars represent SD, n = 3. * P<0.05, two-tailed, paired student's t-test comparing 42°C to 32°C values. (C) RT-qPCR showing act1, hsp70 and hsp9 mRNA levels after heat shock. Error bars represent SD, n = 3. Values are normalized to 32°C signals. *P < 0.05, two-tailed, paired Student's _t_-test comparing 42 to 32°C values. (D) ChIP-qPCR analysis showing Psm3-GFP enrichment at hsp70 and hsp9 promoters after shifting from 32 to 42°C, 30 min. Values are normalized to rpl29. Error bars represent SD, n = 3. *P < 0.05, one-tailed, paired Student's _t_-test comparing 42 to 32°C values and GFP signal to no tag control. (E) ChIP-qPCR analysis showing Mis4-GFP enrichment at hsp70 and hsp9 promoters after shifting from 32 to 42°C, 30 min. Values are normalized to rpl29. Error bars represent SD, n = 3. *P < 0.05, one-tailed, paired Student's _t_-test comparing 42 to 32°C values and GFP signal to no tag control. (F) ChIP-qPCR analysis showing Eso1-GFP enrichment at hsp70 and hsp9 promoters after shifting from 32 to 42°C, 30 min. Values are normalized to rpl29. Error bars represent SD, n = 3. *P < 0.05, one-tailed, paired Student's _t_-test comparing 42 to 32°C values and GFP signal to no tag control.
Figure 7.
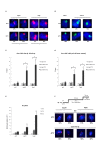
Transcription induction mediates cohesion establishment. (A) DNA FISH analysis of hsp70 and hsp9 loci. FISH probes (red dots, Alexa-555) are shown inside DAPI stained nucleus (blue). *P < 0.05. two-tailed, paired Student's _t_-test. n = 100 cells, two biological repeats. (B) DNA FISH analysis of CAR II and CAR IX used as controls for FISH after heat shock induction. 100% cohesion observed at CAR II between 32 and 42°C (left panel) and ±50% cohesion at CAR IX (same as in Figure 1B and C, respectively). n = 100 cells, two biological repeats. (C) ChIP-qPCR analysis showing Eso1-GFP enrichment at hsp70 and hsp9 loci in S synchronized cells (Hydroxyurea) after heat shock. No tag strain was used to assess the background levels. Error bars represent SD, n = 3. *P < 0.05, two-tailed, paired Student's _t_-test comparing 42 to 32°C values and GFP signal to no tag control. (D) ChIP-qPCR analysis showing Eso1-GFP enrichment at hsp70 and hsp9 loci in G2 synchronized cells (Hydroxyurea block and release) after heat shock. No tag strain was used to assess the background levels. Error bars represent SD, n = 3. *P < 0.05, two-tailed, paired Student's _t_-test comparing 42 to 32°C values and GFP signal to no tag control. (E) RT-qPCR showing act1, hsp70 and hsp9 mRNA levels at 25, 37 and 42°C. Error bars represent SD, n = 3. *P < 0.05, two-tailed, paired Student's _t_-test comparing 42 to 25°C values. (F) DNA FISH analysis of hsp70 and hsp9 loci in WT and eso1-H17 cells. Cells were grown o/n at 25°C. Eso1 was inactivated at 37°C for 2 h, followed by heat shock at 42°C.
Similar articles
- Pds5 promotes cohesin acetylation and stable cohesin-chromosome interaction.
Vaur S, Feytout A, Vazquez S, Javerzat JP. Vaur S, et al. EMBO Rep. 2012 Jun 29;13(7):645-52. doi: 10.1038/embor.2012.72. EMBO Rep. 2012. PMID: 22640989 Free PMC article. - Conserved roles of chromatin remodellers in cohesin loading onto chromatin.
Muñoz S, Passarelli F, Uhlmann F. Muñoz S, et al. Curr Genet. 2020 Oct;66(5):951-956. doi: 10.1007/s00294-020-01075-x. Epub 2020 Apr 10. Curr Genet. 2020. PMID: 32277274 Free PMC article. - Psm3 acetylation on conserved lysine residues is dispensable for viability in fission yeast but contributes to Eso1-mediated sister chromatid cohesion by antagonizing Wpl1.
Feytout A, Vaur S, Genier S, Vazquez S, Javerzat JP. Feytout A, et al. Mol Cell Biol. 2011 Apr;31(8):1771-86. doi: 10.1128/MCB.01284-10. Epub 2011 Feb 7. Mol Cell Biol. 2011. PMID: 21300781 Free PMC article. - Heterochromatin and the cohesion of sister chromatids.
Gartenberg M. Gartenberg M. Chromosome Res. 2009;17(2):229-38. doi: 10.1007/s10577-008-9012-z. Chromosome Res. 2009. PMID: 19308703 Review. - The expanding phenotypes of cohesinopathies: one ring to rule them all!
Piché J, Van Vliet PP, Pucéat M, Andelfinger G. Piché J, et al. Cell Cycle. 2019 Nov;18(21):2828-2848. doi: 10.1080/15384101.2019.1658476. Epub 2019 Sep 13. Cell Cycle. 2019. PMID: 31516082 Free PMC article. Review.
Cited by
- Coordination of cohesin and DNA replication observed with purified proteins.
Murayama Y, Endo S, Kurokawa Y, Kurita A, Iwasaki S, Araki H. Murayama Y, et al. Nature. 2024 Feb;626(7999):653-660. doi: 10.1038/s41586-023-07003-6. Epub 2024 Jan 24. Nature. 2024. PMID: 38267580 - Condensin controls cellular RNA levels through the accurate segregation of chromosomes instead of directly regulating transcription.
Hocquet C, Robellet X, Modolo L, Sun XM, Burny C, Cuylen-Haering S, Toselli E, Clauder-Münster S, Steinmetz L, Haering CH, Marguerat S, Bernard P. Hocquet C, et al. Elife. 2018 Sep 19;7:e38517. doi: 10.7554/eLife.38517. Elife. 2018. PMID: 30230473 Free PMC article. - Selected In Situ Hybridization Methods: Principles and Application.
Veselinyová D, Mašlanková J, Kalinová K, Mičková H, Mareková M, Rabajdová M. Veselinyová D, et al. Molecules. 2021 Jun 24;26(13):3874. doi: 10.3390/molecules26133874. Molecules. 2021. PMID: 34202914 Free PMC article. Review. - Non-coding Transcription Instructs Chromatin Folding and Compartmentalization to Dictate Enhancer-Promoter Communication and T Cell Fate.
Isoda T, Moore AJ, He Z, Chandra V, Aida M, Denholtz M, Piet van Hamburg J, Fisch KM, Chang AN, Fahl SP, Wiest DL, Murre C. Isoda T, et al. Cell. 2017 Sep 21;171(1):103-119.e18. doi: 10.1016/j.cell.2017.09.001. Cell. 2017. PMID: 28938112 Free PMC article. - Deficiency of Polη in Saccharomyces cerevisiae reveals the impact of transcription on damage-induced cohesion.
Wu PS, Grosser J, Cameron DP, Baranello L, Ström L. Wu PS, et al. PLoS Genet. 2021 Sep 9;17(9):e1009763. doi: 10.1371/journal.pgen.1009763. eCollection 2021 Sep. PLoS Genet. 2021. PMID: 34499654 Free PMC article.
References
- Michaelis C., Ciosk R., Nasmyth K. Cohesins: chromosomal proteins that prevent premature separation of sister chromatids. Cell. 1997;91:35–45. - PubMed
- Haering C.H., Lowe J., Hochwagen A., Nasmyth K. Molecular architecture of SMC proteins and the yeast cohesin complex. Mol. Cell. 2002;9:773–788. - PubMed
- Nasmyth K., Haering C.H. The structure and function of SMC and kleisin complexes. Annu. Rev. Biochem. 2005;74:595–648. - PubMed
- Nasmyth K., Haering C.H. Cohesin: its roles and mechanisms. Annu. Rev. Genet. 2009;43:525–558. - PubMed
MeSH terms
Substances
LinkOut - more resources
Full Text Sources
Other Literature Sources
