Macrophage-secreted granulin supports pancreatic cancer metastasis by inducing liver fibrosis - PubMed (original) (raw)
doi: 10.1038/ncb3340. Epub 2016 Apr 18.
Valeria Quaranta 1, Andrea Linford 1, Perpetua Emeagi 1, Carolyn Rainer 1, Almudena Santos 1, Lucy Ireland 1, Takao Sakai 2, Keiko Sakai 2, Yong-Sam Kim 3 4, Dannielle Engle 5 6, Fiona Campbell 1, Daniel Palmer 1, Jeong Heon Ko 3 4, David A Tuveson 5 6 7, Emilio Hirsch 8, Ainhoa Mielgo 1, Michael C Schmid 1
Affiliations
- PMID: 27088855
- PMCID: PMC4894551
- DOI: 10.1038/ncb3340
Macrophage-secreted granulin supports pancreatic cancer metastasis by inducing liver fibrosis
Sebastian R Nielsen et al. Nat Cell Biol. 2016 May.
Erratum in
- Corrigendum: Macrophage-secreted granulin supports pancreatic cancer metastasis by inducing liver fibrosis.
Nielsen SR, Quaranta V, Linford A, Emeagi P, Rainer C, Santos A, Ireland L, Sakai T, Sakai K, Kim YS, Engle D, Campbell F, Palmer D, Ko JH, Tuveson DA, Hirsch E, Mielgo A, Schmid MC. Nielsen SR, et al. Nat Cell Biol. 2016 Jun 28;18(7):822. doi: 10.1038/ncb3377. Nat Cell Biol. 2016. PMID: 27350447 No abstract available.
Abstract
Pancreatic ductal adenocarcinoma (PDAC) is a devastating metastatic disease for which better therapies are urgently needed. Macrophages enhance metastasis in many cancer types; however, the role of macrophages in PDAC liver metastasis remains poorly understood. Here we found that PDAC liver metastasis critically depends on the early recruitment of granulin-secreting inflammatory monocytes to the liver. Mechanistically, we demonstrate that granulin secretion by metastasis-associated macrophages (MAMs) activates resident hepatic stellate cells (hStCs) into myofibroblasts that secrete periostin, resulting in a fibrotic microenvironment that sustains metastatic tumour growth. Disruption of MAM recruitment or genetic depletion of granulin reduced hStC activation and liver metastasis. Interestingly, we found that circulating monocytes and hepatic MAMs in PDAC patients express high levels of granulin. These findings suggest that recruitment of granulin-expressing inflammatory monocytes plays a key role in PDAC metastasis and may serve as a potential therapeutic target for PDAC liver metastasis.
Figures
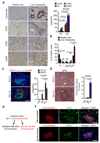
Figure 1. Metastatic PDAC cells induce macrophage recruitment and activation of myofibroblasts in the liver
(a) Identification of pan-cytokeratin (CK)+ metastatic pancreatic cancer cells, hematopoietic cells (CD45+), macrophages (CD68+) and myofibroblasts (αSMA+) as predominant cell types at the hepatic metastatic microenvironment of pancreatic cancer by immunohistochemical analysis of human biopsies. Representative micrographs and quantification of the data are shown (n = 5 PDAC patients, n= 5 healthy subjects; five fields assessed per sample; mean ± s.e.m; two-tailed unpaired t-test). HL= healthy liver, LM= liver metastasis. (b) Established metastatic nodules in the liver were processed 12 days post intrasplenic implantation of 1x10⁶ KPC and analysed by flow cytometry. Composition of intrametastatic leukocytes is shown as a percentage of CD45+ cells using the following definitions: B cells (CD45+CD3negB220+); T cells (CD45+B220negCD3+), NK cells (CD45+B220negCD3negNK1.1+), Neutrophils (CD11b+Ly6G+F4/80neg), MAMs (CD11b+F4/80+) (n= 4 healthy livers; n = 8 liver metastasis; data combine two independent experiments; mean ± s.e.m; two-tailed unpaired t-test). (c) Representative immunofluorescence staining of myofibroblasts (αSMA+) clustering around metastatic KPCluc/zsGreen (zsGreen) cells in the liver at 5 and 12 days after implantation. Histogram: quantification of myeloid cells (CD11b+) and myofibroblasts (αSMA+) cell frequency in livers during the course of metastasis formation. Nuclei were counterstained with DAPI (n = 6 mice per time point; four fields assessed per sample; data combine two independent experiments; mean ± s.e.m; two-tailed unpaired t-test). (d) Representative Masson’s trichrome staining of tumour bearing livers at 5 and 12 days after implantation. Histogram: quantification of area occupied by fibrotic stroma (n = 6 mice per time point; four fields assessed per sample; data combine two independent experiments; mean ± s.e.m; two-tailed unpaired t-test). (e) Schematic of the generation of chimeric mice resulting in tdTomatoRed positive BM derived macrophages and non-labelled resident Kupffer cells (KC). (f) Chimeric mice from (e) were intrasplenically implanted with 1x10⁶Panc02 cells and livers were harvested after day 12. Immunofluorescence analysis of bone marrow derived tdTomatoRed+ cells in combination with F4/80 staining and αSMA staining in tumour bearing livers. Nuclei were counterstained with DAPI (data are from 6 mice per condition; one experiment). Scale bars = 100µm; ns, not significant.
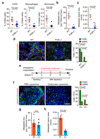
Figure 2. Macrophages promote myofibroblast activation and metastatic growth
(a - d) Liver metastasis was induced by intrasplenic implantation of 1x10⁶ KPC cells. Entire livers were harvested and analysed 12 days later. (a) Hematopoietic cells (CD45+), MAMs (CD45+CD11b+F4/80+), and IM (CD45+CD11b+Ly6C+F4/80negLy6Gneg) from tumour bearing livers of wild type (WT) versus PI3Kγ-/-(-/-) mice were evaluated by flow cytometry (n = 6 mice WT; n = 8 mice PI3Kγ-/-; data combine two independent experiments; individual data points, horizontal lines represent mean ± s.e.m; two-tailed unpaired t-test). (b, c) Quantification of metastatic frequency (b) and average metastatic lesion size (c) in WT and PI3Kγ-/- (-/-) mice by HE stained liver sections (n = 7 mice WT; n = 9 mice PI3Kγ-/-; data combine two independent experiments; mean ± s.e.m; two-tailed unpaired t-test). (d) Representative immunofluorescence staining and quantification of MAMs (F4/80+) and myofibroblasts (αSMA+) cell frequency in livers in WT and PI3Kγ-/- (-/-). Nuclei were counterstained with DAPI (n = 6 mice WT; n = 8 mice PI3Kγ-/-; four fields assessed per sample; data combine two independent experiments; mean ± s.e.m; two-tailed unpaired t-test). (e - h) Liver metastasis was induced by intrasplenic implantation of 1x10⁶ KPC cells. Macrophages were depleted by clodronate liposome treatment after initial colonization of the liver had occurred. (e) Schematic illustration of the experiment. (f) Representative immunofluorescent staining and quantification of MAMs (F4/80+) and myofibroblasts (αSMA+) cell frequency in tumour bearing livers treated with liposomes containing PBS (PL) or clodronate (CL). Nuclei were counterstained with DAPI (n = 4 mice per condition; five fields assessed per sample; one experiment; mean ± s.e.m; two tailed unpaired t-test). (g, h) Evaluation of metastatic frequency (g) and area covered by metastatic cells (h) in tumour bearing livers of mice treated with PL or CL (n = 4 mice per condition; all metastatic nodules assessed from one section per sample; one experiment; individual data and mean ± s.e.m; two-tailed unpaired t-test). Scale bars = 100µm; ns, not significant.
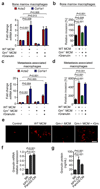
Figure 3. Granulin secreted by macrophages activates hepatic stellate cells
(a) Quantification of αSMA (Acta2), and collagen 1a (Col1a) mRNA levels in primary hStCs stimulated with isogenic macrophage conditioned media (MCM) generated from wild type (WT) or granulin deficient (Grn-/-) macrophages, and CM generated from Grn-/- macrophages in the presence of recombinant granulin (rGranulin) as determined by qPCR (n = 3 independent experiments; mean ± s.e.m.; two-tailed unpaired t-test). (b) Quantification hStCs invasion towards MCM generated from WT or Grn-/- deficient macrophages and MCM generated from Grn-/- in the presence of rGranulin (n = 3 independent experiments; mean ± s.e.m.; two-tailed unpaired t-test). (c, d) same as (a, b), but MCM was generated using _in vivo_derived MAMs. Therefore liver metastasis was induced by intrasplenic implantation of 1x10⁶ KPC cells into isogenic WT + WT BM and WT + Grn-/- BM chimeric mice (n = 3 independent experiments; mean ± s.e.m.; two-tailed unpaired t-test). (e) Representative immunofluorescence images of (d) showing Vybrant Dil (Em565) labelled murine hStCs showing invasion towards MCM generated from WT and Grn-/- MAMs and MCM generated from Grn-/- MAMs in the presence of recombinant granulin (rGranulin) (data are from three independent experiments). (f, g) Quantification of granulin mRNA levels by qPCR (f) and granulin secretion by ELISA (g) in primary unstimulated (M0) macrophages and macrophages stimulated with isogenic CM media generated from murine KPC and Panc02 tumour cells (n = 3 independent experiments; mean ± s.e.m.; two-tailed unpaired t-test). Scale bar = 100 µm; ns, not significant.
Figure 4. Granulin is highly expressed in hepatic metastatic lesions and metastasis associated macrophages are the main source of granulin secretion
(a, b) Quantification of granulin mRNA levels (a) and granulin protein levels (b) in intrametastatic pancreatic cancer cells, immune cell depleted stromal cells (zsGreennegCD45neg), and MAMs (CD45+F4/80+) isolated by fluorescence activated cell sorting from established tumour bearing livers 12 days after intrasplenic implantation of 1x10⁶ KPCluc/zsGreen cancer cells (a, data are from three pooled mice; one experiment; b, n = 3 independent experiments; mean ± s.e.m.; two-tailed unpaired t-test). (c) Quantification of granulin and Tgfb mRNA levels in tissue resident (KC) and MAMs sorted from established metastatic lesions from chimeric WT mice harbouring tdTomatoRed+ BM as described in Fig. 1g (data are from three pooled mice; one experiment). (d) Spontaneous metastatic hepatic tumours derived from KPC mice were isolated and analysed. Representative images of immunohistochemistry staining for MAMs (CD68+) and granulin expression on serial tissue sections from metastatic lesions and healthy liver and quantification of the data (n = 5 control mice, n = 5 KPC mice, five fields assessed per sample; mean ± s.e.m.; two-tailed unpaired t-test). (e) Representative images of immunohistochemistry staining for MAMs (CD68+) and granulin expression on serial tissue sections from human metastatic PDAC lesions and healthy liver and quantification of the data (n = 5 healthy subjects, n = 5 PDAC samples; five fields assessed per sample; mean ± s.e.m.; two-tailed unpaired t-test). Scale bars = 100µm; asterisks indicate matched tissue areas; ns, not significant.
Figure 5. Granulin depletion prevents myofibroblast activation and PDAC metastasis
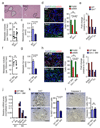
Liver metastasis was induced by intrasplenic implantation of 5x10⁵ KPC cells into WT and granulin deficient (Grn-/-;) mice (a – e) and chimeric WT + WT BM and WT + Grn-/- BM mice (f – l). Entire livers were harvested and analysed 12 days later. (a) Representative images of HE staining of liver sections (data are from 6 WT and 7 Grn-/- mice; one experiment). (b) Metastatic frequency (n = 6 WT mice, n = 7 Grn-/- mice; all metastatic nodules assessed from one section per sample; one experiment; individual data points, horizontal lines represent mean ± s.e.m; two-tailed unpaired t-test). (c) Metastatic area (n = 6 WT mice, n = 7 Grn-/- mice; all metastatic nodules assessed from one section per sample; one experiment; mean ± s.e.m; two-tailed unpaired t-test). (d) Representative immunofluorescent staining and quantification of MAMs (F4/80+) and myofibroblasts (αSMA+) cell frequency in tumour bearing livers. Nuclei were counterstained with DAPI (n = 6 WT mice, n = 7 Grn-/- mice; four fields assess per sample; one experiment; mean ± s.e.m; two-tailed unpaired t-test). (e) qPCR analysis of multiple hStCs activation markers in intrametastatic myofibroblasts isolated from established metastatic lesions (data are from three pooled mice per condition; one experiment). (f) Metastatic frequency (n = 5 WT + WT BM mice, n = 6 WT + Grn-/- BM mice; all metastatic nodules assessed from one section per sample; one experiment; individual data points, horizontal lines represent mean ± s.e.m; two-tailed unpaired t-test). (g) Metastatic area (n = 5 WT + WT BM mice, n = 6 WT + Grn-/- BM mice; all metastatic nodules assessed from one section per sample; one experiment; mean ± s.e.m; two-tailed unpaired t-test). (h) Representative immunofluorescence staining and quantification of MAMs (F4/80+) and myofibroblasts (αSMA+) cell frequency in tumour bearing livers. Nuclei were counterstained with DAPI (n = 5 WT + WT BM mice, n = 6 WT + Grn-/- BM mice; four fields assessed per sample; one experiment; mean ± s.e.m; two-tailed unpaired t-test). (i) qPCR analysis of multiple hStCs activation markers in intrametastatic myofibroblasts isolated from established metastatic lesions (data are from five pooled mice per condition; one experiment). (j, k) Representative IHC staining and quantification of Ki67+ tumour cell frequency (j) and cleaved caspase 3+ cell numbers (k) in metastatic livers (n = 5 WT + WT BM mice, n = 6 WT + Grn-/- BM mice; five fields assessed per sample; one experiment; mean ± s.e.m; two-tailed unpaired t-test). (l) qPCR analysis of multiple M2- and M1- macrophage associated genes in MAMs isolated from metastatic tumours developed in WT + WT BM and WT + Grn-/- BM mice (data are from 6 pooled mice per condition; one experiment). Scale bars = 100μm; ns, not significant.
Figure 6. Myofibroblast secreted periostin enhances pancreatic cancer cell growth.
(a) Top gene ontology (GO) functions of secreted proteins enriched in human myofibroblasts (Mf) following in vitro education with macrophage conditioned media (CM). (b) Fold change rank of identified proteins associated with extracellular matrix organisation. Data were obtained from one experiment assessing two biologically independent samples (Green = periostin). (c) Colony formation assay of primary murine KPC cells, murine Panc02, and human Panc1 cells in the presence or absence of Mf CM and periostin neutralising antibody (anti-Periostin). Representative images reflecting colonies and single cells are displayed for KPC cells (n = 3 independent experiments; mean ± s.e.m; two-tailed unpaired t-test). (d) Immunohistochemical stainings of periostin in human liver biopsies (n = 5 healthy subjects, n= 5 PDAC; five fields assessed per sample; mean ± s.e.m; two-tailed unpaired t-test) and in spontaneous metastatic liver tumours collected from KPC mice (n = 5 mice per condition; five fields assessed per sample, mean ± s.e.m; two-tailed unpaired t-test). Representative micrographs and quantification of the data. HL = healthy liver, LM = liver metastasis. Scale bars = 100μm.
Figure 7. Macrophage derived granulin induces periostin expression by hepatic stellate cells in vitro and in vivo.
(a) Evaluation of periostin (Postn) mRNA expression levels in primary hStCs following stimulation with CM collected from BM WT or Grn-/- macrophages in the presence or absence of recombinant granulin (rGranulin) (n = 3 independent experiments; mean ± s.e.m.; two-tailed unpaired t-test). (b, c) Evaluation of periostin (Postn) mRNA levels by qPCR (b) and periostin protein levels by ELISA (c) in primary hStCs following stimulation with CM collected from in vivo derived WT or Grn-/-MAMs, in the presence or absence of recombinant granulin (rGranulin) (n = 3 independent experiments; mean ± s.e.m.; two-tailed unpaired t-test). (d, e) Evaluation of periostin deposition and fibrotic stroma formation in metastatic livers of control WT, WT mice treated with clodronate liposomes (CL), PI3Kγ-/-, Grn-/-, and WT + Grn-/- BM mice 12 days after intrasplenic implantation of KPC cells. (d) Representative immunofluorescence staining and quantification of periostin deposition. Nuclei were counterstained with DAPI. (e) Representative Masson’s trichrome staining (MTS) and quantification of area occupied by fibrotic stroma (n = 4 mice per condition; four fields assessed per sample; data combine five independent experiments; mean ± s.e.m; two-tailed unpaired t-test). (f) Quantification of periostin (Postn) mRNA expression levels by qPCR in intrametastatic myofibroblasts isolated from tumour bearing livers of WT and Grn-/- mice, and chimeric WT + WT BM and WT + Grn-/- BM mice (data are from six pooled mice per condition; one experiment). Scale bars = 100μm.
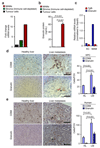
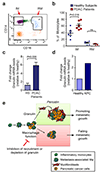
Figure 8. Metastatic PDAC patients have increased circulating inflammatory monocytes that express high levels of granulin
(a) Peripheral mononuclear cells were isolated from healthy subjects and metastatic PDAC patients. Representative dot plot of inflammatory monocytes (IM; CD14hiCD16neg) and resident monocytes (RM; CD14dimCD16hi) after gating for the CD45+CD3negB220negCD19negSytoxnegcell population (data are from 6 different PDAC patients and 6 different healthy subjects). (b) Quantification of a. Percentage of monocyte populations in healthy subjects and metastatic PDAC patients (n = 6 different healthy; n = 6 different PDAC samples; individual data points, horizontal lines represent mean ± s.e.m.; two tailed unpaired t-test). NS, not significant. (c) Quantification of granulin mRNA levels in inflammatory monocytes (IM) isolated from metastatic PDAC patients and healthy subjects (HS) as described in (a, b) (n = 3 different healthy, n = 4 different PDAC samples; mean ± s.e.m; two-tailed unpaired t-test). (d) Quantification of granulin mRNA levels in circulating IM sorted from KPC mice with pathological confirmed liver metastasis or tumour free litter mates (data are from four pooled mice per condition; one experiment). (e) Schematic depicting the role of macrophage-derived granulin in activation of hStCs and in PDAC liver metastasis. Inflammatory monocytes are recruited to the liver by metastatic pancreatic tumour cells through a PI3Kγ-dependent mechanism. Once in the metastatic tissue, differentiated macrophages stimulate the activation and recruitment of resident hStCs through granulin secretion resulting in excessive accumulation of myofibroblasts. Granulin-induced myofibroblasts release high levels of the extracellular matrix protein periostin, thereby enhancing survival and growth of metastatic pancreatic cancer cells in a hostile environment. Interruption of this sequence, by either preventing macrophage accumulation or by abolishing granulin expression in recruited macrophages, limits metastatic growth of pancreatic cancer cells.
Comment in
- Fibroblasts form a hospitable metastatic niche in the liver.
Erez N. Erez N. Nat Cell Biol. 2016 Apr 27;18(5):465-6. doi: 10.1038/ncb3352. Nat Cell Biol. 2016. PMID: 27117331 - Pancreatic cancer: Infiltrating macrophages support liver metastasis.
Thomas H. Thomas H. Nat Rev Gastroenterol Hepatol. 2016 Jun;13(6):313. doi: 10.1038/nrgastro.2016.71. Epub 2016 Apr 27. Nat Rev Gastroenterol Hepatol. 2016. PMID: 27118627 No abstract available. - New player in tumor-stromal interaction: Granulin as a novel therapeutic target for pancreatic ductal adenocarcinoma liver metastasis.
Sato-Matsubara M, Kawada N. Sato-Matsubara M, et al. Hepatology. 2017 Jan;65(1):374-376. doi: 10.1002/hep.28849. Hepatology. 2017. PMID: 27641067 No abstract available.
Similar articles
- Macrophage-Derived Granulin Drives Resistance to Immune Checkpoint Inhibition in Metastatic Pancreatic Cancer.
Quaranta V, Rainer C, Nielsen SR, Raymant ML, Ahmed MS, Engle DD, Taylor A, Murray T, Campbell F, Palmer DH, Tuveson DA, Mielgo A, Schmid MC. Quaranta V, et al. Cancer Res. 2018 Aug 1;78(15):4253-4269. doi: 10.1158/0008-5472.CAN-17-3876. Epub 2018 May 22. Cancer Res. 2018. PMID: 29789416 Free PMC article. - Tumor-driven like macrophages induced by conditioned media from pancreatic ductal adenocarcinoma promote tumor metastasis via secreting IL-8.
Chen SJ, Lian GD, Li JJ, Zhang QB, Zeng LJ, Yang KG, Huang CM, Li YQ, Chen YT, Huang KH. Chen SJ, et al. Cancer Med. 2018 Nov;7(11):5679-5690. doi: 10.1002/cam4.1824. Epub 2018 Oct 12. Cancer Med. 2018. PMID: 30311406 Free PMC article. - Pancreatic Premalignant Lesions Secrete Tissue Inhibitor of Metalloproteinases-1, Which Activates Hepatic Stellate Cells Via CD63 Signaling to Create a Premetastatic Niche in the Liver.
Grünwald B, Harant V, Schaten S, Frühschütz M, Spallek R, Höchst B, Stutzer K, Berchtold S, Erkan M, Prokopchuk O, Martignoni M, Esposito I, Heikenwalder M, Gupta A, Siveke J, Saftig P, Knolle P, Wohlleber D, Krüger A. Grünwald B, et al. Gastroenterology. 2016 Nov;151(5):1011-1024.e7. doi: 10.1053/j.gastro.2016.07.043. Epub 2016 Aug 6. Gastroenterology. 2016. PMID: 27506299 - Monocytes and macrophages as cellular targets in liver fibrosis.
Heymann F, Trautwein C, Tacke F. Heymann F, et al. Inflamm Allergy Drug Targets. 2009 Sep;8(4):307-18. doi: 10.2174/187152809789352230. Inflamm Allergy Drug Targets. 2009. PMID: 19534673 Review. - Persistent activation of pancreatic stellate cells creates a microenvironment favorable for the malignant behavior of pancreatic ductal adenocarcinoma.
Tang D, Wang D, Yuan Z, Xue X, Zhang Y, An Y, Chen J, Tu M, Lu Z, Wei J, Jiang K, Miao Y. Tang D, et al. Int J Cancer. 2013 Mar 1;132(5):993-1003. doi: 10.1002/ijc.27715. Epub 2012 Oct 5. Int J Cancer. 2013. PMID: 22777597 Review.
Cited by
- Targeting BCL2 with Venetoclax Enhances the Efficacy of the KRASG12D Inhibitor MRTX1133 in Pancreatic Cancer.
Becker JH, Metropulos AE, Spaulding C, Marinelarena AM, Shields MA, Principe DR, Pham TD, Munshi HG. Becker JH, et al. Cancer Res. 2024 Nov 4;84(21):3629-3639. doi: 10.1158/0008-5472.CAN-23-3574. Cancer Res. 2024. PMID: 39137400 Free PMC article. - Single-cell analysis reveals the COL11A1+ fibroblasts are cancer-specific fibroblasts that promote tumor progression.
Zhang J, Lu S, Lu T, Han D, Zhang K, Gan L, Wu X, Li Y, Zhao X, Li Z, Shen Y, Hu S, Yang F, Wen W, Qin W. Zhang J, et al. Front Pharmacol. 2023 Jan 20;14:1121586. doi: 10.3389/fphar.2023.1121586. eCollection 2023. Front Pharmacol. 2023. PMID: 36744260 Free PMC article. - Harnessing tumor-associated macrophages as aids for cancer immunotherapy.
Li X, Liu R, Su X, Pan Y, Han X, Shao C, Shi Y. Li X, et al. Mol Cancer. 2019 Dec 5;18(1):177. doi: 10.1186/s12943-019-1102-3. Mol Cancer. 2019. PMID: 31805946 Free PMC article. Review. - Prognostic significance of periostin in colorectal cancer.
Deng X, Ao S, Hou J, Li Z, Lei Y, Lyu G. Deng X, et al. Chin J Cancer Res. 2019 Jun;31(3):547-556. doi: 10.21147/j.issn.1000-9604.2019.03.16. Chin J Cancer Res. 2019. PMID: 31354223 Free PMC article. - Liver sinusoidal endothelial cell ICAM-1 mediated tumor/endothelial crosstalk drives the development of liver metastasis by initiating inflammatory and angiogenic responses.
Benedicto A, Herrero A, Romayor I, Marquez J, Smedsrød B, Olaso E, Arteta B. Benedicto A, et al. Sci Rep. 2019 Sep 11;9(1):13111. doi: 10.1038/s41598-019-49473-7. Sci Rep. 2019. PMID: 31511625 Free PMC article.
References
- Ryan DP, Hong TS, Bardeesy N. Pancreatic adenocarcinoma. The New England journal of medicine. 2014;371:2140–2141. - PubMed
- Nguyen DX, Bos PD, Massague J. Metastasis: from dissemination to organ-specific colonization. Nature reviews. Cancer. 2009;9:274–284. - PubMed
MeSH terms
Substances
Grants and funding
- P30 CA008748/CA/NCI NIH HHS/United States
- 102521/WT_/Wellcome Trust/United Kingdom
- P30 CA045508/CA/NCI NIH HHS/United States
- WT_/Wellcome Trust/United Kingdom
- MR/L000512/1/MRC_/Medical Research Council/United Kingdom
- T32 CA148056/CA/NCI NIH HHS/United States
LinkOut - more resources
Full Text Sources
Other Literature Sources
Medical
Molecular Biology Databases
Research Materials
