RNA-Sequencing Reveals the Progression of Phage-Host Interactions between φR1-37 and Yersinia enterocolitica - PubMed (original) (raw)
RNA-Sequencing Reveals the Progression of Phage-Host Interactions between φR1-37 and Yersinia enterocolitica
Katarzyna Leskinen et al. Viruses. 2016.
Abstract
Despite the expanding interest in bacterial viruses (bacteriophages), insights into the intracellular development of bacteriophage and its impact on bacterial physiology are still scarce. Here we investigate during lytic infection the whole-genome transcription of the giant phage vB_YecM_φR1-37 (φR1-37) and its host, the gastroenteritis causing bacterium Yersinia enterocolitica. RNA sequencing reveals that the gene expression of φR1-37 does not follow a pattern typical observed in other lytic bacteriophages, as only selected genes could be classified as typically early, middle or late genes. The majority of the genes appear to be expressed constitutively throughout infection. Additionally, our study demonstrates that transcription occurs mainly from the positive strand, while the negative strand encodes only genes with low to medium expression levels. Interestingly, we also detected the presence of antisense RNA species, as well as one non-coding intragenic RNA species. Gene expression in the phage-infected cell is characterized by the broad replacement of host transcripts with phage transcripts. However, the host response in the late phase of infection was also characterized by up-regulation of several specific bacterial gene products known to be involved in stress response and membrane stability, including the Cpx pathway regulators, ATP-binding cassette (ABC) transporters, phage- and cold-shock proteins.
Keywords: Yersinia enterocolitica; bacteriophage; transcriptome; φR1-37.
Figures
Figure 1
Growth curves of YeO3-R1 bacteria at different temperatures when infected with phage φR1-37. Bacteria infected with phage φR1-37 at MOIs of 10−1 to 10−5 were grown in LB at 4 °C (A), 10 °C (B), 16 °C (C), 22 °C (D), and 37 °C (E). Each data point in the graphs represents the average of eight replicates. The error bars represent the standard deviation for the optical density calculated for each time point. Note the different axis scales in the different panels.
Figure 2
Percentage of RNA sequencing reads aligning to the φR1-37 phage genome at different time points post-infection.
Figure 3
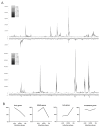
The progression of φR1-37 genome transcription during the infection cycle. The number of reads aligning to every 250 bp fragment of both strands of the phage genome was plotted for each time point (A). The intensity of the color of the curves from grey to black indicate the consecutive time points (for high resolution image of Panel A, see Figure S4). Different temporal classes of φR1-37 gene expression (B). For each gene and infection phase the highest Total Gene Reads (TGR) value was set to 100% and the other values set accordingly. The genes were grouped into four temporal classes and the curves represent the averages calculated for these.
Figure 4
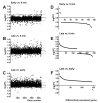
The change in the expression of the bacterial genes during the phage φR1-37 infection cycle. The early phase values represent the average data calculated for the 2 and 5 min time points, and the late phase values, the average for the 28, 35, 42 and 49 min time points. Shown are the Log2FC values between the early phase and the negative control (A), between the late phase and negative control (B), and between the late and early phases (C). Each dot represents the Log2FC value calculated for each gene separately. In the A, B and C graphs, the dots are ordered according to their gene location in the YeO3-R1 genome (the consecutive gene numbers on the X-axis are indicated with the scale at the bottom). The grey lines indicate the selected differential expression threshold of ±1.5. Panels D, E and F demonstrate that in the early phase most differentially expressed host genes are repressed (D), while in the late phase many differentially expressed host genes are activated (E) and this is even more pronounced when the late phase genes are compared to early phase genes (F). For panels D, E and F, the genes are arranged along the X-axis according to their decreasing log2FC values.
Similar articles
- Yersiniophage phiR1-37 is a tailed bacteriophage having a 270 kb DNA genome with thymidine replaced by deoxyuridine.
Kiljunen S, Hakala K, Pinta E, Huttunen S, Pluta P, Gador A, Lönnberg H, Skurnik M. Kiljunen S, et al. Microbiology (Reading). 2005 Dec;151(Pt 12):4093-4102. doi: 10.1099/mic.0.28265-0. Microbiology (Reading). 2005. PMID: 16339954 - Yersinia enterocolitica-Specific Infection by Bacteriophages TG1 and ϕR1-RT Is Dependent on Temperature-Regulated Expression of the Phage Host Receptor OmpF.
Leon-Velarde CG, Happonen L, Pajunen M, Leskinen K, Kropinski AM, Mattinen L, Rajtor M, Zur J, Smith D, Chen S, Nawaz A, Johnson RP, Odumeru JA, Griffiths MW, Skurnik M. Leon-Velarde CG, et al. Appl Environ Microbiol. 2016 Aug 15;82(17):5340-53. doi: 10.1128/AEM.01594-16. Print 2016 Sep 1. Appl Environ Microbiol. 2016. PMID: 27342557 Free PMC article. - Nonessential genes of phage phiYeO3-12 include genes involved in adaptation to growth on Yersinia enterocolitica serotype O:3.
Kiljunen S, Vilen H, Pajunen M, Savilahti H, Skurnik M. Kiljunen S, et al. J Bacteriol. 2005 Feb;187(4):1405-14. doi: 10.1128/JB.187.4.1405-1414.2005. J Bacteriol. 2005. PMID: 15687205 Free PMC article. - Stress relief during host infection: The phage shock protein response supports bacterial virulence in various ways.
Darwin AJ. Darwin AJ. PLoS Pathog. 2013;9(7):e1003388. doi: 10.1371/journal.ppat.1003388. Epub 2013 Jul 11. PLoS Pathog. 2013. PMID: 23853578 Free PMC article. Review. No abstract available. - The Phage Shock Protein Response.
Flores-Kim J, Darwin AJ. Flores-Kim J, et al. Annu Rev Microbiol. 2016 Sep 8;70:83-101. doi: 10.1146/annurev-micro-102215-095359. Epub 2016 Jun 8. Annu Rev Microbiol. 2016. PMID: 27297125 Review.
Cited by
- Characterization and Genomic Analysis of PALS2, a Novel Staphylococcus Jumbo Bacteriophage.
Lee Y, Son B, Cha Y, Ryu S. Lee Y, et al. Front Microbiol. 2021 Mar 8;12:622755. doi: 10.3389/fmicb.2021.622755. eCollection 2021. Front Microbiol. 2021. PMID: 33763042 Free PMC article. - Identification of over ten thousand candidate structured RNAs in viruses and phages.
Fremin BJ, Bhatt AS, Kyrpides NC. Fremin BJ, et al. Comput Struct Biotechnol J. 2023 Nov 7;21:5630-5639. doi: 10.1016/j.csbj.2023.11.010. eCollection 2023. Comput Struct Biotechnol J. 2023. PMID: 38047235 Free PMC article. - Development of ONT-cappable-seq to unravel the transcriptional landscape of Pseudomonas phages.
Putzeys L, Boon M, Lammens EM, Kuznedelov K, Severinov K, Lavigne R. Putzeys L, et al. Comput Struct Biotechnol J. 2022 May 23;20:2624-2638. doi: 10.1016/j.csbj.2022.05.034. eCollection 2022. Comput Struct Biotechnol J. 2022. PMID: 35685363 Free PMC article. - Nutrient driven transcriptional changes during phage infection in an aquatic Gammaproteobacterium.
Nilsson E, Li K, Hoetzinger M, Holmfeldt K. Nilsson E, et al. Environ Microbiol. 2022 May;24(5):2270-2281. doi: 10.1111/1462-2920.15904. Epub 2022 Jan 26. Environ Microbiol. 2022. PMID: 35049095 Free PMC article. - To Be or Not To Be T4: Evidence of a Complex Evolutionary Pathway of Head Structure and Assembly in Giant Salmonella Virus SPN3US.
Ali B, Desmond MI, Mallory SA, Benítez AD, Buckley LJ, Weintraub ST, Osier MV, Black LW, Thomas JA. Ali B, et al. Front Microbiol. 2017 Nov 15;8:2251. doi: 10.3389/fmicb.2017.02251. eCollection 2017. Front Microbiol. 2017. PMID: 29187846 Free PMC article.
References
- Guttman B., Raya R., Kutter E. Basic Phage Biology. In: Kutter E., Sulakvelidze A., editors. Bacteriophages: Biology and Applications. CRC Press; New York, NY, USA: 2004.
- Ceyssens P.J., Minakhin L., Van den Bossche A., Yakunina M., Klimuk E., Blasdel B., De Smet J., Noben J.P., Bläsi U., Severinov K., et al. Development of giant bacteriophage varphiKZ is independent of the host transcription apparatus. J. Virol. 2014;88:10501–10510. doi: 10.1128/JVI.01347-14. - DOI - PMC - PubMed
Publication types
MeSH terms
Substances
LinkOut - more resources
Full Text Sources
Other Literature Sources


