Chronic interleukin-1 exposure drives haematopoietic stem cells towards precocious myeloid differentiation at the expense of self-renewal - PubMed (original) (raw)
doi: 10.1038/ncb3346. Epub 2016 Apr 25.
Cristina Mirantes-Barbeito 1, Sarah Fong 1, Dirk Loeffler 2, Larisa V Kovtonyuk 3, SiYi Zhang 1, Ranjani Lakshminarasimhan 1, Chih Peng Chin 1, José-Marc Techner 1, Britta Will 4, Claus Nerlov 5, Ulrich Steidl 4, Markus G Manz 3, Timm Schroeder 2, Emmanuelle Passegué 1
Affiliations
- PMID: 27111842
- PMCID: PMC4884136
- DOI: 10.1038/ncb3346
Chronic interleukin-1 exposure drives haematopoietic stem cells towards precocious myeloid differentiation at the expense of self-renewal
Eric M Pietras et al. Nat Cell Biol. 2016 Jun.
Abstract
Haematopoietic stem cells (HSCs) maintain lifelong blood production and increase blood cell numbers in response to chronic and acute injury. However, the mechanism(s) by which inflammatory insults are communicated to HSCs and their consequences for HSC activity remain largely unknown. Here, we demonstrate that interleukin-1 (IL-1), which functions as a key pro-inflammatory 'emergency' signal, directly accelerates cell division and myeloid differentiation of HSCs through precocious activation of a PU.1-dependent gene program. Although this effect is essential for rapid myeloid recovery following acute injury to the bone marrow, chronic IL-1 exposure restricts HSC lineage output, severely erodes HSC self-renewal capacity, and primes IL-1-exposed HSCs to fail massive replicative challenges such as transplantation. Importantly, these damaging effects are transient and fully reversible on IL-1 withdrawal. Our results identify a critical regulatory circuit that tailors HSC responses to acute needs, and is likely to underlie deregulated blood homeostasis in chronic inflammation conditions.
Conflict of interest statement
COMPETING FINANCIAL INTERESTS
The authors declare no competing financial interests.
The authors have no financial interests to disclose.
Figures
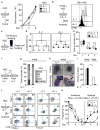
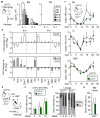
Figure 1. IL-1 accelerates HSC differentiation along the myeloid lineage
a, Representative expansion in liquid culture (n = 3 biological replicates/group). b, CFSE dilution assays after 60 hours. Data represent one of 2 replicate experiments. Grey histogram shows −IL-1β HSCs at 24 hours. c–e Continuous single-cell tracking experiments (n = 47 and 51 HSC/group): (c) experimental design, (d) single-cell pedigrees of median division times, and (e) box plot quantification of division times. Results show median (lines) and 10–90th percentile (whiskers). f–i, Colony forming unit (CFU) assays in methylcellulose: (f) experimental design, (g) single cell clonogenic assays (n = 3 replicate experiments with 60 HSC/group), (h) representative colony type (scale bar, 100 μm) and morphology (scale bar, 10 μm; arrow indicates a macrophage), and (i) replating (repl.) experiments. Data represent one of two replicate experiments. Colonies were scored after 7 days. MkE: megakaryocyte/erythrocyte; M: macrophage; G: granulocyte; GM: ganulocyte/macrophage; GMMkE: mix colony. j–k, Myeloid differentiation in liquid culture (n = 6 biological replicates/group): (j) experimental design with representative FACS plots, and (k) quantification of myeloid marker expression. Source data for a are shown in Supplementary Table 1. Data are means ± S.D.; * p ≤ 0.05, **p ≤ 0.01, ***p ≤ 0.001. _P_-values in a were determined by one-way ANOVA with Dunnet’s test, in g by paired Student’s t test, and in e and k by Mann-Whitney u test. Exact _P_-values number of replicates used to derive statistical data (n) and statistical tests used are shown in Supplementary Table 2.
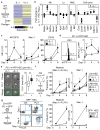
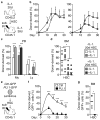
Figure 2. IL-1 induces precocious activation of a PU.1 gene program in HSCs
a–b, Fluidigm gene expression analyses of lineage determinant and cell cycle genes: (a) heatmap, and (b) expression of individual genes (n = 8 pools of 100 cells for each condition; bars: means). Results are expressed as fold changes compared to levels in −IL-1β HSCs (set to 1). My: myeloid; Ly: lymphoid; MkE: megakaryocyte/erythroid. (c) Expression of PU.1 targets (n = 5 biological replicates/group; M-CSFR day 4, n = 7). (d) Representative histogram and PU.1 levels in PU.1-eYFP HSCs (n = 6 biological replicates/group; day 8, n = 4). Results are expressed as mean fluorescence intensity (MFI) levels. (e) Representative images and PU.1 levels in individual PU.1-eYFP HSCs prior to first division (n = 33–37 HSC/group; scale bar, 10 μm). Results are expressed in arbitrary units (AU) and box plots show median (lines) with 10–90th percentile (whiskers). (f) Experimental design and myeloid marker expression in control (Ctrl) and PU.1ΔURE (ΔURE) HSCs (n = 3 biological replicates/group). (g) Experimental design, representative FACS plots and myeloid marker expression in lentivirally transduced (GFP+) Ctrl or PU.1-overexpressing HSCs (n = 3 biological replicates/group for day 4; day 1 represents the mean of two biological replicates/group). Source data for d, f and g are shown in Supplementary Table 1. Data are means ± S.D.; * p ≤ 0.05, **p ≤ 0.01, ***p ≤ 0.001. _P_-values in b–e were determined by Mann-Whitney u test, in f by one-way ANOVA with Dunnet’s test, and in g by paired Student’s t test. Exact _P_-values, number of replicates used to derive statistical data (n), and statistical tests used are shown in Supplementary Table 2.
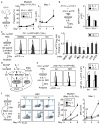
Figure 3. PU.1 activation requires direct and sustained IL-1R signalling
(a) Experimental design and myeloid marker expression in Il1r1−/− HSCs (n = 3 biological replicates/group). (b) Experimental design and PU.1 levels in Il1r1+/+ and Il1r1−/−::PU.1-eYFP HSCs (n = 3 biological replicates/group). (c) Experimental design, representative histograms, and PU.1 levels in PU.1-eYFP HSCs treated with the indicated inhibitors (n = 3 biological replicates/group for MEK, Src, PI3K; n = 4 for p38, PKC, mTOR; n = 7 for IKK). Data are expressed as log2 fold change in PU.1-eYFP MFI levels relative to −IL-1β PU.1-eYFP HSCs. (d) Schematic of the signalling pathways downstream of IL-1R highlighting NF-κB and indicating the connection with M-CSFR signalling. (e) Experimental design, representative histograms and PU.1 levels in PU.1-eYFP HSCs treated with anti-M-CSFR blocking antibody (aMR) or isotype control (iso) (n = 3 biological replicates/group). (f) Experimental design, representative FACS plots and myeloid marker expression in IL-1 wash out (wo) experiments (n = 3 biological replicates/group). Source data for a–c, e and f are shown in Supplementary Table 1. Data are means ± S.D.; * p ≤ 0.05, **p ≤ 0.01, ***p ≤ 0.001. _P_-values in a were determined by Mann-Whitney u test, in b and e by paired Student’s t test, and in c and f by one way ANOVA with Tukey’s and Dunnet’s tests, respectively. Exact _P_-values, number of replicates used to derive statistical data (n), and statistical tests used are shown in Supplementary Table 2
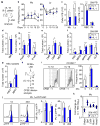
Figure 4. IL-1 enforces HSC myeloid differentiation in vivo
a–c Peripheral blood (PB) parameters in mice injected ±IL-1β for 20 days: (a) experimental design, (b) percentage of myeloid (Mac-1**+**Gr-1+) and lymphoid (B220+ and CD3+) cells over time (n = 5 mice/group; * vs. −IL-1β; ° vs. day 0), and (c) complete blood counts after 20 days. My: myeloid; Ly: lymphoid; RBC: red blood cell; Plt: platelet. d–g Size of the indicated BM populations in mice injected ± IL-1β for 20 days (n = 18 mice/group) h–i In vivo CFSE dilution assay (n = 4 −IL-1β and 7 +IL-1β mice/group): (h) experimental design, and (i) representative histograms and quantification of HSCLT division kinetics. (j) Representative histograms, PU.1 levels and frequency of PU.1+ HSCs from PU.1-eYFP mice injected ± IL-1β for 1 or 20 days (n = 4 −IL-1β and 5 +IL-1β mice/group for day 1; n = 5 −IL-1β and 3 +IL-1β mice/group for day 20). (k) Fluidigm gene expression analyses of myeloid determinants in HSCs from mice injected ±IL-1β for 20 days (n = 8 pools of 100 cells for each condition; bars: means). Results are expressed as fold changes compared to levels in −IL-1β HSCs (set to 1). Source data for i and j are shown in Supplementary Table 1. Data are means ± S.D.; */° p ≤ 0.05, **p ≤ 0.01, ***p ≤ 0.001. _P_-values in b–k were determined by Mann-Whitney u test and in b (relative to day 0) by one-way ANOVA with Dunnet’s test. Exact _P_-values, number of replicates used to derive statistical data (n), and statistical tests used are shown in Supplementary Table 2.
Figure 5. IL-1 accelerates myeloid regeneration following acute BM injury
(a) Experimental design and IL-1α/β levels following 5-FU treatment (n = 6 mice/group, day 0; n = 5 mice/group, day 8–10; n = 4 mice/group, day 12; n = 3 mice/group, day 14). (b) qRT-PCR analysis of Il1a/b expression in the indicated populations (n = 8 pools of 100 OBC, MSC and EC/group; n = 6 pools of 100 cells for all other populations). Results are expressed as fold changes compared to levels in B cells or d0 populations (each set to 0). (c) Experimental design and complete blood counts in 5-FU-treated Il1r1+/+ and Il1r1−/− mice (n = 5 Il1r1+/+ and 6 Il1r1−/− mice/group). d–g Engraftment of Il1r1+/+ and Il1r1−/− HSCs isolated from mice 10 days post-5-FU treatment: (d) experimental design, (e) donor chimerism and (f) donor myeloid (Mac-1+Gr-1+) and lymphoid (B220+ or CD3+) lineage distribution in PB over time, and (g) donor chimerism in BM HSCs 16 weeks post-transplant. Source data for a and e–g are shown in Supplementary Table 1. Data are means ± S.D.; * p ≤ 0.05, **p ≤ 0.01. _P_-values in a and b were determined by one-way ANOVA with Dunnet’s and Tukey’s tests, respectively, and in c–g by Mann-Whitney u test. Exact _P_-values, number of replicates used to derive statistical data (n) and statistical tests used are shown in Supplementary Table 2.
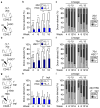
Figure 6. Chronic IL-1 exposure forces myeloid cell production at the expense of HSC engraftment
a–d, Short-term tracking of HSCs from mice injected ± IL-1β for 20 days and transplanted into sublethally irradiated (sub-IR) recipients injected ± IL-1β for another 30 days (n = 9 +IL-1β and 10 −IL-1β mice/group): (a) experimental design, (b) donor chimerism in PB over time (°p < 0.05, °°p < 0.01 vs. −IL-1β recipients), (c) lineage distribution in PB, and (d) donor chimerism in BM HSCs (circles: individual mice, black lines: mean values) 30 days post-transplant. e–g, Short-term tracking of lentivirus-transduced PU.1-overexpressing HSCs (n = 4 ctrl and 5 PU.1 mice/group): (e) experimental design, (f) donor chimerism in PB over time, and (g) donor chimerism in BM HSCs (circles: individual mice, black lines: mean values) 30 days post-transplantation. Source data for f and g are shown in Supplementary Table 1. Data are means ± S.D.; * p ≤ 0.05, **p ≤ 0.01, ***p ≤ 0.001. _P_-values in b and d were determined by one-way ANOVA with Tukey’s test, in c and g by Mann-Whitney u test, and in f by Student’s t test. Exact _P_-values, number of replicates used to derive statistical data (n) and statistical tests used are shown in Supplementary Table 2.
Figure 7. Chronic IL-1 exposure impairs HSC self-renewal
a–c, Long-term engraftment of HSCs from mice injected ± IL-1β for 20 days and transplanted into lethally irradiated (IR) recipients (n = 10 mice/group): (a) experimental design, (b) donor chimerism and (c) lineage distribution in PB over time. d–f, Long-term engraftment of HSCLT from mice injected ± IL-1β for 70 days (n = 9 −IL-1β and 10 +IL-1β mice/group): (d) experimental design, (e) donor chimerism and (f) lineage distribution in PB over time. g–i, Secondary transplantation (2° txpl) of HSCs re-isolated from primary transplanted mice (1° txpl, shown in a) reconstituted with HSCs from mice injected ± IL-1β for 20 days (n = 8 mice/group): (g) experimental design, (h) donor chimerism and (i) lineage distribution in PB over time. Source data for b–c, e–f, and h–i are shown in Supplementary Table 1. Data are means ± S.D.; * p ≤ 0.05, **p ≤ 0.01, ***p ≤ 0.001. _P_-values in b, e, h and i were determined by Mann-Whitney u test, and in c and f by Student’s t test. Exact _P_-values, number of replicates used to derive statistical data (n) and statistical tests used are shown in Supplementary Table 2.
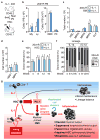
Figure 8. IL-1 effects are reversible upon withdrawal
a–d, Analysis of mice injected ± IL-1β for 20 days and subsequently rested (R) for 8 weeks (n = 5 mice/group): (a) experimental design, (b) PB parameters, (c) progenitor cell, and (d) HSCLT and MPP1 numbers. e–f, Long-term engraftment of HSCs from mice injected ± IL-1β for 20 days and rested for 8 weeks (n = 4 −IL-1β and 5 +IL-1β mice/group: (e) donor chimerism and (f) lineage distribution in PB over time. (g) Model for IL-1 effects on HSC function. At steady state, HSCs are essentially kept in a quiescent state that is geared towards maintenance of blood homeostasis. In this context, IL-1 is produced at low levels in the BM, primarily by granulocytes (Gr) and CD4+ T cells and has minimal impact on HSC function. Upon infection or injury, IL-1 is produced at elevated levels in the BM microenvironment, in particular by endothelial cells (EC) that form an essential component of the HSC niche, and thus can provide localized IL-1 signalling to HSC. In this context, IL-1 functions as an ‘emergency’ signal that directly instructs HSCs towards myeloid differentiation, via activation of the NF-κB pathway and engagement of a PU.1-dependent myeloid gene program resulting in accelerated cell division and precocious differentiation into myeloid progenitors and ultimately mature myeloid cells. While such a response is advantageous in the context of acute inflammation and blood regeneration, it is ultimately detrimental in situations of chronic exposure since IL-1 exposed HSCs lose their ability to differentiate into the lymphoid and erythroid lineages, and exhibit decreased self-renewal activity and regenerative potential in response to replicative challenges such as transplantation. However, these damaging consequences are fully reversible upon IL-1 withdrawal, indicating that IL-1 effects are essentially transient and require continuous exposure to negatively impact HSC function. Source data for b–f are shown in Supplementary Table 1. Data are means ± S.D.; * p ≤ 0.05. All _P_-values were determined by Mann-Whitney u test. Exact _P_-values, number of replicates used to derive statistical data (n) and statistical tests used are shown in Supplementary Table 2.
Similar articles
- M-CSF instructs myeloid lineage fate in single haematopoietic stem cells.
Mossadegh-Keller N, Sarrazin S, Kandalla PK, Espinosa L, Stanley ER, Nutt SL, Moore J, Sieweke MH. Mossadegh-Keller N, et al. Nature. 2013 May 9;497(7448):239-43. doi: 10.1038/nature12026. Epub 2013 Apr 10. Nature. 2013. PMID: 23575636 Free PMC article. - Fundamental properties of unperturbed haematopoiesis from stem cells in vivo.
Busch K, Klapproth K, Barile M, Flossdorf M, Holland-Letz T, Schlenner SM, Reth M, Höfer T, Rodewald HR. Busch K, et al. Nature. 2015 Feb 26;518(7540):542-6. doi: 10.1038/nature14242. Epub 2015 Feb 11. Nature. 2015. PMID: 25686605 - Stromal niche inflammation mediated by IL-1 signalling is a targetable driver of haematopoietic ageing.
Mitchell CA, Verovskaya EV, Calero-Nieto FJ, Olson OC, Swann JW, Wang X, Hérault A, Dellorusso PV, Zhang SY, Svendsen AF, Pietras EM, Bakker ST, Ho TT, Göttgens B, Passegué E. Mitchell CA, et al. Nat Cell Biol. 2023 Jan;25(1):30-41. doi: 10.1038/s41556-022-01053-0. Epub 2023 Jan 17. Nat Cell Biol. 2023. PMID: 36650381 Free PMC article. - Quantitative assessment of the stem cell self-renewal capacity.
Nakauchi H, Sudo K, Ema H. Nakauchi H, et al. Ann N Y Acad Sci. 2001 Jun;938:18-24; discussion 24-5. doi: 10.1111/j.1749-6632.2001.tb03570.x. Ann N Y Acad Sci. 2001. PMID: 11458506 Review. - Inflammation Regulates Haematopoietic Stem Cells and Their Niche.
Ho NP, Takizawa H. Ho NP, et al. Int J Mol Sci. 2022 Jan 20;23(3):1125. doi: 10.3390/ijms23031125. Int J Mol Sci. 2022. PMID: 35163048 Free PMC article. Review.
Cited by
- The IL-1β inhibitor canakinumab in previously treated lower-risk myelodysplastic syndromes: a phase 2 clinical trial.
Rodriguez-Sevilla JJ, Adema V, Chien KS, Loghavi S, Ma F, Yang H, Montalban-Bravo G, Huang X, Calvo X, Joseph J, Bodden K, Garcia-Manero G, Colla S. Rodriguez-Sevilla JJ, et al. Nat Commun. 2024 Nov 13;15(1):9840. doi: 10.1038/s41467-024-54290-2. Nat Commun. 2024. PMID: 39537648 Free PMC article. Clinical Trial. - Intermittent high-fat diet: atherosclerosis progression by neutrophil reprogramming.
Herrero-Cervera A, Chevre R, Soehnlein O. Herrero-Cervera A, et al. Signal Transduct Target Ther. 2024 Nov 7;9(1):314. doi: 10.1038/s41392-024-02027-4. Signal Transduct Target Ther. 2024. PMID: 39511153 Free PMC article. No abstract available. - PD-L1 blockade immunotherapy rewires cancer-induced emergency myelopoiesis.
Boumpas A, Papaioannou AS, Bousounis P, Grigoriou M, Bergo V, Papafragkos I, Tasis A, Iskas M, Boon L, Makridakis M, Vlachou A, Gavriilaki E, Hatzioannou A, Mitroulis I, Trompouki E, Verginis P. Boumpas A, et al. Front Immunol. 2024 Oct 11;15:1386838. doi: 10.3389/fimmu.2024.1386838. eCollection 2024. Front Immunol. 2024. PMID: 39464894 Free PMC article. - Decrease in Hemoglobin Levels during Acute Attacks in Patients with Idiopathic Recurrent Pericarditis: A Model of Anemia in Acute Disease.
Casarin F, Mascolo R, Motta I, Wu MA, Bizzi E, Pedroli A, Dieguez G, Iacomelli G, Serati L, Duca L, Maestroni S, Tombetti E, Cappellini MD, Brucato A. Casarin F, et al. J Clin Med. 2024 Oct 6;13(19):5944. doi: 10.3390/jcm13195944. J Clin Med. 2024. PMID: 39408004 Free PMC article. - Cellular stress and epigenetic regulation in adult stem cells.
Llewellyn J, Baratam R, Culig L, Beerman I. Llewellyn J, et al. Life Sci Alliance. 2024 Sep 30;7(12):e202302083. doi: 10.26508/lsa.202302083. Print 2024 Dec. Life Sci Alliance. 2024. PMID: 39348938 Free PMC article. Review.
References
- Iwasaki H, Akashi K. Myeloid lineage commitment from the hematopoietic stem cell. Immunity. 2007;26:726–740. - PubMed
- Wilson A, et al. Hematopoietic stem cells reversibly switch from dormancy to self-renewal during homeostasis and repair. Cell. 2008;135:1118–1129. - PubMed
Publication types
MeSH terms
Substances
Grants and funding
- R01 HL092471/HL/NHLBI NIH HHS/United States
- F32 HL106989/HL/NHLBI NIH HHS/United States
- K01 DK098315/DK/NIDDK NIH HHS/United States
- T32 AI007334/AI/NIAID NIH HHS/United States
- G0900892/MRC_/Medical Research Council/United Kingdom
- G0701761/MRC_/Medical Research Council/United Kingdom
- MC_UU_12009/7/MRC_/Medical Research Council/United Kingdom
- R01 CA166429/CA/NCI NIH HHS/United States
- K01 DK105134/DK/NIDDK NIH HHS/United States
LinkOut - more resources
Full Text Sources
Other Literature Sources
Medical
Molecular Biology Databases
