The Novel Methods for Analysis of Exosomes Released from Endothelial Cells and Endothelial Progenitor Cells - PubMed (original) (raw)
doi: 10.1155/2016/2639728. Epub 2016 Mar 28.
Runmin Guo 2, Yi Yang 3, Bradley Jacobs 4, Suhong Chen 5, Ifeanyi Iwuchukwu 6, Kenneth J Gaines 4, Yanfang Chen 7, Richard Simman 1, Guiyuan Lv 5, Keng Wu 2, Ji C Bihl 1
Affiliations
- PMID: 27118976
- PMCID: PMC4826946
- DOI: 10.1155/2016/2639728
The Novel Methods for Analysis of Exosomes Released from Endothelial Cells and Endothelial Progenitor Cells
Jinju Wang et al. Stem Cells Int. 2016.
Abstract
Exosomes (EXs) are cell-derived vesicles that mediate cell-cell communication and could serve as biomarkers. Here we described novel methods for purification and phenotyping of EXs released from endothelial cells (ECs) and endothelial progenitor cells (EPCs) by combining microbeads and fluorescence quantum dots (Q-dots®) techniques. EXs from the culture medium of ECs and EPCs were isolated and detected with cell-specific antibody conjugated microbeads and second antibody conjugated Q-dots by using nanoparticle tracking analysis (NTA) system. The sensitivities of the cell origin markers for ECs (CD105, CD144) and EPCs (CD34, KDR) were evaluated. The sensitivity and specificity were determined by using positive and negative markers for EXs (CD63), platelets (CD41), erythrocytes (CD235a), and microvesicles (Annexin V). Moreover, the methods were further validated in particle-free plasma and patient samples. Results showed that anti-CD105/anti-CD144 and anti-CD34/anti-KDR had the highest sensitivity and specificity for isolating and detecting EC-EXs and EPC-EXs, respectively. The methods had the overall recovery rate of over 70% and were able to detect the dynamical changes of circulating EC-EXs and EPC-EXs in acute ischemic stroke. In conclusion, we have developed sensitive and specific microbeads/Q-dots fluorescence NTA methods for EC-EX and EPC-EX isolation and detection, which will facilitate the functional study and biomarker discovery.
Figures
Figure 1
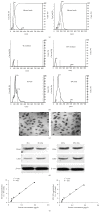
Characterization of EC-EXs and EPC-EXs. (a) Representative NTA plot showing the size distribution of 100 nm and 200 nm polystyrene beads. (b) Representative NTA plots show size/concentration distribution of particles in the EX-depleted EC and EPC medium and of EC-EXs and EPC-EXs. Black solid line: 100 nm landmark; black dash line: 200 nm landmark. (c) TEM micrographs of EXs. (d) Representative western blot bands showing the expression of CD63, CD105, and CD34 in EXs and their corresponding parent cells, ECs and EPCs. (e) The correlation between EXs and their protein concentration.
Figure 2
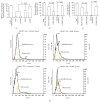
The efficiencies and specificities of the methods by combining microbeads with NTA for purifying and detecting EC-EXs. (a) The purification efficiency and specificity of EC-EXs in the total EC-EXs, which were collected from EC culture medium by ultracentrifuge and isolated by various microbeads-conjugated antibodies against EC specific markers (CD105, as well as negative controls, CD34, CD41, and CD235a). (b) The detection efficiency and specificity of EC-EXs in the total CD105+ EXs that were labeled with CD144-, or KDR-, or Annexin V-, or CD63-conjugated Q-dots upon detection by fluorescence NTA. (c) The overall efficiency for measuring the CD105+ EXs colabeled with CD144-, or KDR-, or Annexin V-, or CD63-conjugated Q-dots in the total EC-EXs. (d) Representative plots showing the size/concentration distribution of the CD105+ beads isolated EXs under fluorescence/nonfluorescence modes. Black curve: CD105+ EXs measured under light scatter (nonfluorescence) mode. Yellow curve: CD105+Q-dots+ EXs measured under fluorescence mode. Black dash line: 200 nm landmark. N = 4/group.
Figure 3
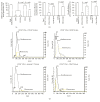
The efficiencies and specificities of the methods by combining microbeads with NTA for purifying and detecting EPC-EXs. (a) The purification efficiency and specificity of EPC-EXs in the total EPC-EXs, which were collected from EPC culture medium by ultracentrifuge and isolated by various microbeads-conjugated antibodies against EPC specific markers (CD34, as well as negative controls, CD105, CD41, and CD235a). (b) The detection efficiency and specificity of EPC-EXs in the total CD34+ EXs that were labeled with CD144-, or KDR-, or Annexin V-, or CD63-conjugated Q-dots upon detection by fluorescence NTA. (c) The overall efficiency for measuring the CD34+ EXs colabeled with CD144-, or KDR-, or Annexin V-, or CD63-conjugated Q-dots in the total EC-EXs. (d) Representative plots showing the size/concentration distribution of the CD34+ beads isolated EXs under fluorescence/nonfluorescence modes. Black curve: CD34+ EXs measured under light scatter (nonfluorescence) mode. Yellow curve: CD34+Q-dots+ EXs measured under fluorescence mode. Black dash line: 200 nm landmark. N = 4/group.
Figure 4
High recovery and detection efficiency of EC-EXs from particle-free plasma by using microbead purification and fluorescence NTA detection methods. (a) EC-EXs were recovered from particle-free plasma by using microbeads conjugated with various antibodies and analyzed by NTA. (b) The detection efficiency of recovered CD105+ EXs that were labeled with secondary antibodies (CD144, or KDR, or Annexin V, or CD63) conjugated with Q-dots and analyzed by fluorescent NTA. (c) The overall efficiency for measuring the recovered CD105+ EXs colabeled with CD144-, or KDR-, or Annexin V-, or CD63-conjugated Q-dots. (d) The absolute number of recovered CD105+ EXs that were positive for CD144, or KDR, or Annexin V, or CD63 per mL particle-free plasma. N = 4/group.
Figure 5
High recovery and detection efficiency of EPC-EXs from particle-free plasma by using microbead purification and fluorescence NTA detection methods. (a) EPC-EXs were recovered from particle-free plasma by using microbeads conjugated with various antibodies and analyzed by NTA. (b) The detection efficiency of recovered CD34+ EXs that were labeled with secondary antibodies (CD144, or KDR, or Annexin V, or CD63) conjugated with Q-dots and analyzed by fluorescent NTA. (c) The overall efficiency for measuring the recovered CD34+ EXs colabeled with CD144-, or KDR-, or Annexin V-, or CD63-conjugated Q-dots. (d) The absolute number of recovered CD34+ EXs that were positive for CD144, or KDR, or Annexin V, or CD63 per mL particle-free plasma. N = 4/group.
Figure 6
Identification of cEC-EXs and cEPC-EXs from human plasma by using anti-CD105- or anti-CD34-conjugated microbeads and Q-dots combined with fluorescence NTA. ((a1) and (b1)) The proportions of CD105+ cEXs and CD34+ cEXs in plasma that were isolated by anti-CD105- or anti-CD34-conjugated microbeads. ((a2) and (b2)) The proportion of CD105+ cEXs or CD34+ cEXs colabeled with CD144-, or KDR-, or Annexin V-, or CD63-conjugated Q-dots in total cEXs. ((a3) and (b3)) The absolute number of CD105+ cEXs and CD34+ cEXs that were labeled with CD144, or KDR, or Annexin V, or CD63 per mL day 1 ischemic stroke patient plasma. N = 8/group.
Figure 7
The dynamic change of cEC-EXs and cEPC-EXs in stroke patient plasma on days 1, 3, and 5 after admission. (a) The dynamic change of cEC-EXs and cEPC-EXs per mL plasma on days 1, 3, and 5 after stroke patient admission upon analysis by NTA.
Similar articles
- The protective effects of miR-210 modified endothelial progenitor cells released exosomes in hypoxia/reoxygenation injured neurons.
Yerrapragada SM, Sawant H, Chen S, Bihl T, Wang J, Bihl JC. Yerrapragada SM, et al. Exp Neurol. 2022 Dec;358:114211. doi: 10.1016/j.expneurol.2022.114211. Epub 2022 Aug 24. Exp Neurol. 2022. PMID: 36027941 Free PMC article. - Analyses of Endothelial Cells and Endothelial Progenitor Cells Released Microvesicles by Using Microbead and Q-dot Based Nanoparticle Tracking Analysis.
Wang J, Zhong Y, Ma X, Xiao X, Cheng C, Chen Y, Iwuchukwu I, Gaines KJ, Zhao B, Liu S, Travers JB, Bihl JC, Chen Y. Wang J, et al. Sci Rep. 2016 Apr 20;6:24679. doi: 10.1038/srep24679. Sci Rep. 2016. PMID: 27094208 Free PMC article. - Compromised endothelial progenitor cell exosomal communication with endothelial cells in hypertension ischemia conditions.
Chen S, Polaki V, Bihl JC, Wang J. Chen S, et al. Front Stroke. 2022;1:1015463. doi: 10.3389/fstro.2022.1015463. Epub 2022 Oct 13. Front Stroke. 2022. PMID: 39450345 Free PMC article. - Cardioprotective Roles of Endothelial Progenitor Cell-Derived Exosomes.
Zeng CY, Xu J, Liu X, Lu YQ. Zeng CY, et al. Front Cardiovasc Med. 2021 Aug 26;8:717536. doi: 10.3389/fcvm.2021.717536. eCollection 2021. Front Cardiovasc Med. 2021. PMID: 34513956 Free PMC article. Review. - Dysfunction and Therapeutic Potential of Endothelial Progenitor Cells in Diabetes Mellitus.
Hu L, Dai SC, Luan X, Chen J, Cannavicci A. Hu L, et al. J Clin Med Res. 2018 Oct;10(10):752-757. doi: 10.14740/jocmr3581w. Epub 2018 Sep 10. J Clin Med Res. 2018. PMID: 30214646 Free PMC article. Review.
Cited by
- Composition, isolation, identification and function of adipose tissue-derived exosomes.
Zhao R, Zhao T, He Z, Cai R, Pang W. Zhao R, et al. Adipocyte. 2021 Dec;10(1):587-604. doi: 10.1080/21623945.2021.1983242. Adipocyte. 2021. PMID: 34709975 Free PMC article. Review. - Stem Cell-Released Microvesicles and Exosomes as Novel Biomarkers and Treatments of Diseases.
Chen Y, Tang Y, Long W, Zhang C. Chen Y, et al. Stem Cells Int. 2016;2016:2417268. doi: 10.1155/2016/2417268. Epub 2016 Aug 8. Stem Cells Int. 2016. PMID: 27579044 Free PMC article. No abstract available. - NPC-EXs Alleviate Endothelial Oxidative Stress and Dysfunction through the miR-210 Downstream Nox2 and VEGFR2 Pathways.
Liu H, Wang J, Chen Y, Chen Y, Ma X, Bihl JC, Yang Y. Liu H, et al. Oxid Med Cell Longev. 2017;2017:9397631. doi: 10.1155/2017/9397631. Epub 2017 May 28. Oxid Med Cell Longev. 2017. PMID: 28630660 Free PMC article. - The profile of inflammatory extracellular vesicles in intracerebral hemorrhage patients.
Sawant H, Bihl T, Nguyen D, Iwuchukwu I, Bihl J. Sawant H, et al. Front Stroke. 2022;1:988081. doi: 10.3389/fstro.2022.988081. Epub 2022 Sep 19. Front Stroke. 2022. PMID: 40129971 Free PMC article. - The protective effects of miR-210 modified endothelial progenitor cells released exosomes in hypoxia/reoxygenation injured neurons.
Yerrapragada SM, Sawant H, Chen S, Bihl T, Wang J, Bihl JC. Yerrapragada SM, et al. Exp Neurol. 2022 Dec;358:114211. doi: 10.1016/j.expneurol.2022.114211. Epub 2022 Aug 24. Exp Neurol. 2022. PMID: 36027941 Free PMC article.
References
LinkOut - more resources
Full Text Sources
Other Literature Sources
Miscellaneous


