Antibiotic perturbation of the murine gut microbiome enhances the adiposity, insulin resistance, and liver disease associated with high-fat diet - PubMed (original) (raw)
Antibiotic perturbation of the murine gut microbiome enhances the adiposity, insulin resistance, and liver disease associated with high-fat diet
Douglas Mahana et al. Genome Med. 2016.
Abstract
Background: Obesity, type 2 diabetes, and non-alcoholic fatty liver disease (NAFLD) are serious health concerns, especially in Western populations. Antibiotic exposure and high-fat diet (HFD) are important and modifiable factors that may contribute to these diseases.
Methods: To investigate the relationship of antibiotic exposure with microbiome perturbations in a murine model of growth promotion, C57BL/6 mice received lifelong sub-therapeutic antibiotic treatment (STAT), or not (control), and were fed HFD starting at 13 weeks. To characterize microbiota changes caused by STAT, the V4 region of the 16S rRNA gene was examined from collected fecal samples and analyzed.
Results: In this model, which included HFD, STAT mice developed increased weight and fat mass compared to controls. Although results in males and females were not identical, insulin resistance and NAFLD were more severe in the STAT mice. Fecal microbiota from STAT mice were distinct from controls. Compared with controls, STAT exposure led to early conserved diet-independent microbiota changes indicative of an immature microbial community. Key taxa were identified as STAT-specific and several were found to be predictive of disease. Inferred network models showed topological shifts concurrent with growth promotion and suggest the presence of keystone species.
Conclusions: These studies form the basis for new models of type 2 diabetes and NAFLD that involve microbiome perturbation.
Figures
Fig. 1
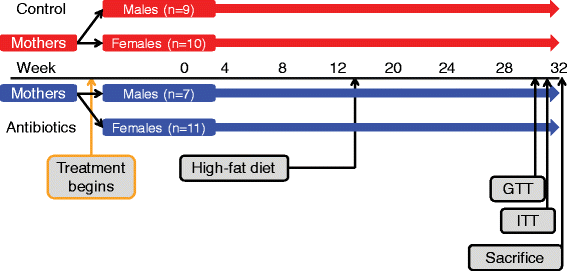
Study design. C57Bl/6 dams were bred, and then randomized to STAT and control groups. Resultant pups continued treatment and were weighed and had fecal samples collected 2–3 times per week until sacrifice at 32 weeks. All mice were switched to a high-fat diet at week 13. A second iteration of this design was performed to increase the number of pups in each group
Fig. 2
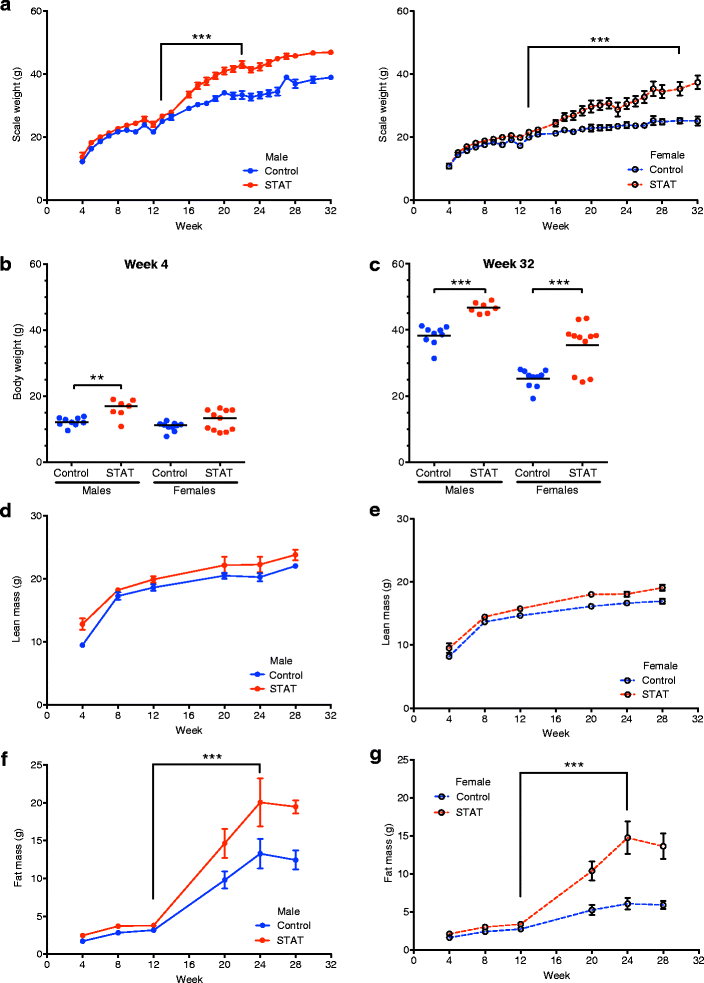
STAT enhances weight gain and adiposity. a Scale weight was measured 3–5 times each week beginning at week 4 (day 28) of life. Group data were smoothed to the second order (3-neighbor method). p values were calculated using piecewise linear regression to assess rate of growth. b, c Weight at week 4 (b) and sacrifice (week 32; c). p values reflect ANOVA with Bonferroni’s correction for multiple comparisons. A high-fat diet (45 % kcal from fat) was introduced to all groups at week 13. DEXA was used at 4, 8, 12, 20, 24, and 28 weeks of life and values are shown as Mean ± SD. d, e Lean mass in male and female mice. f, g Fat mass in male and female mice. Data in a, d, e, f, and g are reported as mean ± SEM. p values calculated from individual mouse data (Mann–Whitney U test). In all panels: *p <0.05; ***p <0.001
Fig. 3
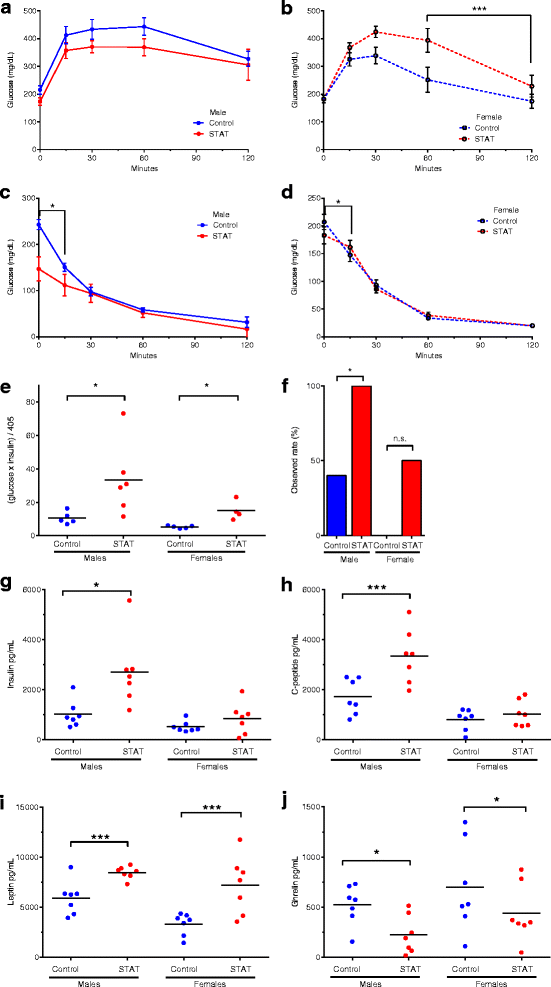
STAT disrupts glucose homeostasis, promoting insulin resistance. For glucose and insulin tolerance testing of 30-week-old male and female mice, six mice from each group were challenged with 5 g/kg dextrose (IPGTT), or with 0.5 U/kg human insulin (IPITT) by intraperitoneal injection. Blood glucose was measured by glucometer at 0, 15, 30, 60, and 120 min post-injection. p values reflect differences in rates of change comparing STAT and control. a, b Glucose tolerance. c, d Insulin resistance. e HOMA-IR was computed as ((Glucose mg/dL) × (Insulin mU/L)/405), as described [1] with values measured at fasting (time 0). p values determined by Kruskal–Wallis test (*p <0.05). **f** Observed mice with elevated HOMA-IR (>13.2). p values calculated by Fisher’s exact test (*p <0.05). Serum was collected at 32 weeks for analysis by MILLIPLEX® MAP Magnetic Bead Panel. g Insulin, h C-peptide, i leptin, and j ghrelin. Each point is the mean of duplicate tests. Data in a, b, c, and d are reported as mean ± SEM. p values determined by Kruskal–Wallis test (in all panels: *p <0.05; **p <0.01; ***p <0.001)
Fig. 4
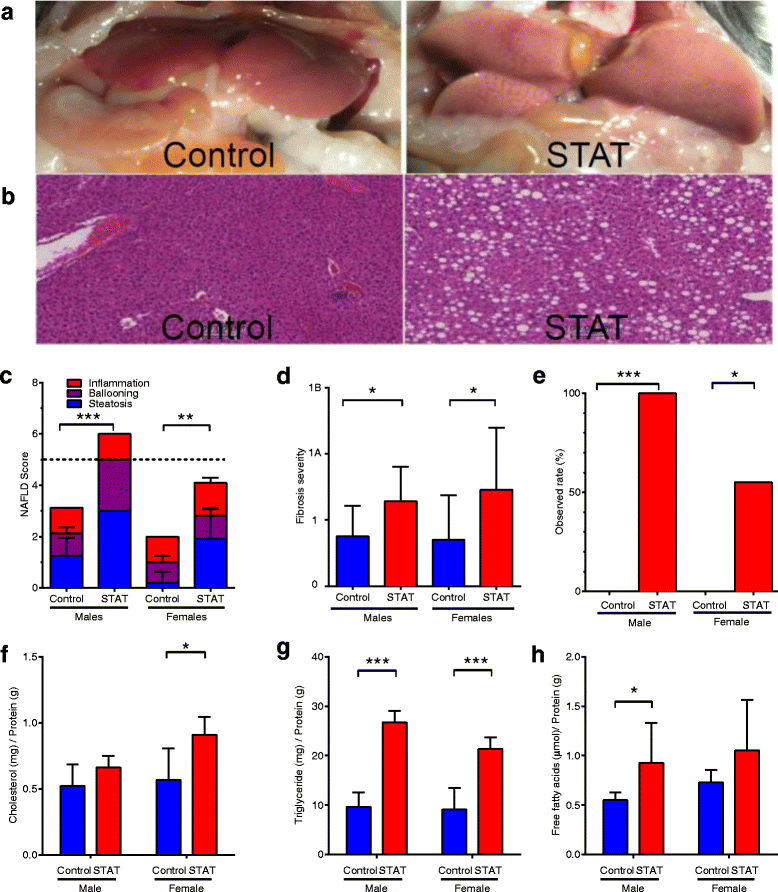
STAT promotes NAFLD through hepatic lipid accumulation. a, b Ex vivo images and H&E stained slides (magnification × 40), showing the scope of liver pathology. NAS score and fibrosis were determined by standardized histological scoring methods [2] with blinded readers averaging the results of ten fields per mouse for each criterion tested. c NAS score by group. The dashed line denotes the diagnostic threshold (>5) for NAFLD. d Fibrosis extent and severity scored from trichrome-stained sections. e Observed percent of mice with diagnostic NAFLD scores (>5; p value by Fisher’s exact test). p values were calculated by Kruskal–Wallis test, unless noted. Lipids were extracted from frozen livers, quantified, and normalized to protein. f Cholesterol, g triglycerides, and h free fatty acids. Data in c, d, f, g, and h are reported as mean ± SEM. p values were calculated by paired _t_-test. In all panels: *p <0.05; **p <0.01; ***p <0.001
Fig. 5
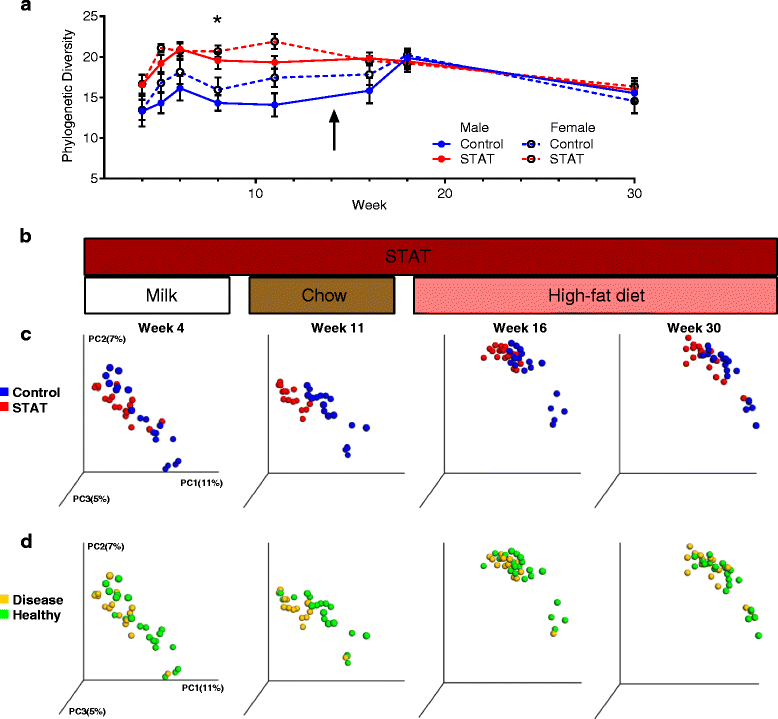
STAT alters microbial communities. a α-diversity of all samples over time, rarefied to a depth of 1014. Only differences observed at week 8 were significant (p <0.05). b STAT exposure and diet corresponding to the PCoA at weeks 4, 11, 16, and 30. c–d PCoAs of beta diversity at weeks 4, 11, 16, and 30. c Control vs. STAT, d healthy vs. disease outcome. p values calculated by Kruskal–Wallis and AUC analysis (*p <0.05; **p <0.01; ***p <0.001). Adonis testing also indicated significant differences (p <0.0005) between the UniFrac distances for the diet:treatment and diet:disease features, when accounting for the repeated measures design (Additional file 3: Table S1)
Fig. 6
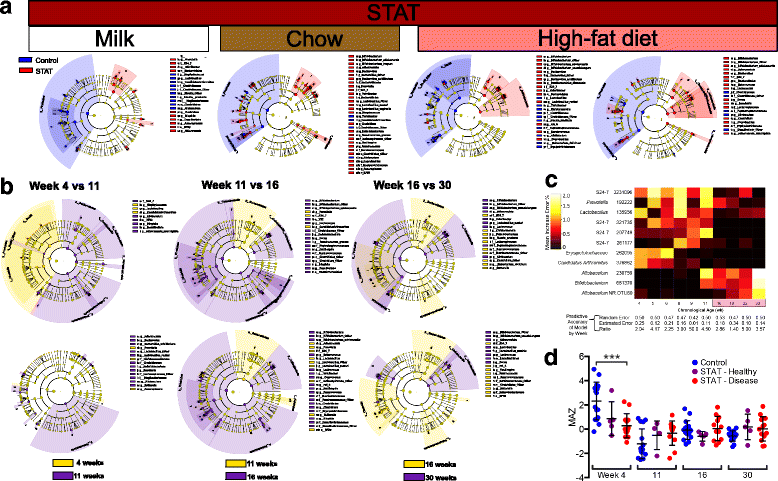
Differential microbial features between STAT and control. a LEfSe cladograms showing discriminant taxa between control and STAT at weeks 4, 11, 16, and 30, respectively, with corresponding diet. All identified taxa were significantly altered by Kruskal–Wallis test (p <0.05) and had at least twofold increase by LDA. b Inter-week comparisons in control (upper) or STAT (lower). The week 4 to 11 comparison shows changes across weaning, the week 11 to 16 comparison shows changes from the introduction of HFD, and the week 16 to 30 comparison shows changes with increasing age. c A Random Forest classification model was built to predict disease outcome (class) based on bacterial OTU relative abundance (features) for each week of life. Heat map indicates the importance of each OTU (as mean increase error %) to the disease prediction models at each stage of life. The mean increase error for each OTU indicates the incremental decrease in prediction accuracy if that OTU is removed from the model. Highlighted time points show HFD. The table lists the predictive accuracy of the model by week. d Average microbiota-by-age z-score (MAZ) over time; z-score = 0 indicates appropriate maturation over time; higher or lower z-scores indicate accelerated or delayed microbiota development, respectively. ***p <0.001 relative to Control, one-way ANOVA with Fisher’s LSD adjusted for false-discovery rate
Fig. 7
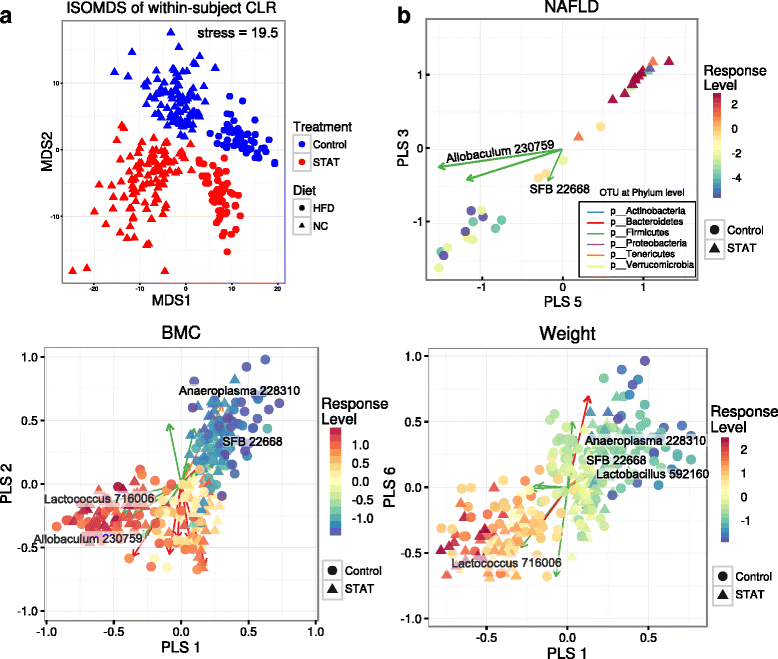
Fecal microbial compositions are associated with host body phenotypes and disease indications. a Isometric multidimensional scaling (MDS) of Euclidean distances between clr-transformed OTU compositions, with within-subject variances extracted. The first two MDS components are shown, with Control vs. STAT and NC vs. HFD (point color, shape) explicitly modeled in this approach. This was done by evaluating between-subject variances within each respective group and subtracting from the full dataset. b Within-subject response-selected OTUs are shown as biplots. For each phenotype of interest (NAFLD, BMC, or Weight), the relevant two-component (out of seven possible latent components) subspaces from the sPLS model are shown. Taxa are filtered for statistical significance (α = 10–2) and key taxa are highlighted for biological significance. “Response Level” indicates the centered and scaled within-subject variances of the relevant measurement
Fig. 8
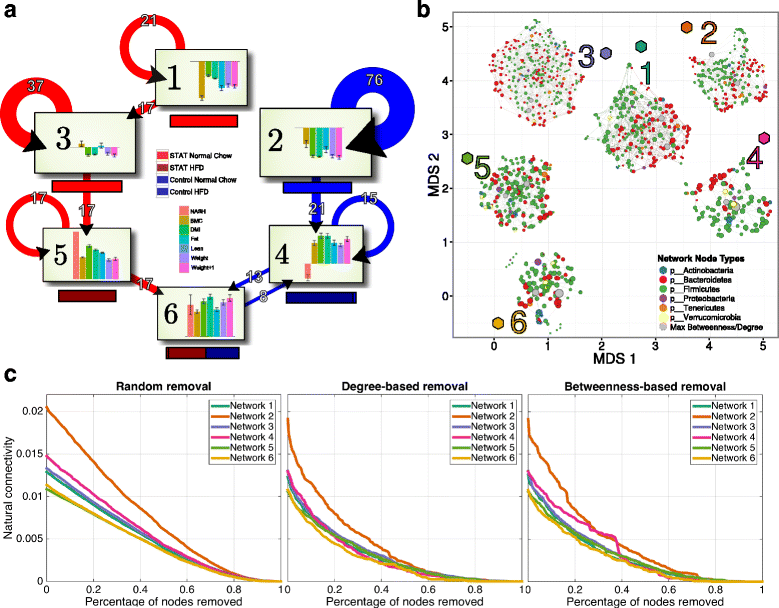
Network properties recapitulate physiology. a For each of the six clusters, which were defined from clustering scores in the multilevel sPLS model-fitted subspace, we show the treatment group identity (STAT/Control and NC/HFD, colored horizontal bars) and average physiological responses (vertical bar plots). Since each response is scaled and centered, the axes represent the mean response over the whole population at each time point. The state-change diagrams represent real-time transitions for the community in an individual mouse moving into a new cluster. For greater clarity, we removed transitions representing fewer than six mouse cluster changes. Clusters 1 and 3 are predominantly obtained from communities in STAT mice early-in-life, and Cluster 2 represents the early-in-life communities in control mice. The switch from NC to HFD corresponds to transitions from Cluster 3 to 5 and from Cluster 2 to 4. Transitions to Cluster 6 primarily include samples from week 30 STAT mice and week 18 and 30 Control mice. The circular arrows shown indicate those communities in mice that do not change clusters b We inferred networks using SPIEC-EASI [34] over the set of samples defined by each cluster. To compare graphs, we include a two-dimensional embedding of graphlet correlation distances (using isometric MDS, with the network positions shown as colored hexagons). These show that based on summarized local network topologies, closeness networks reflect cluster identity. The networks are shown in force directed layouts (overlaid on the ISOMDS, near their respective position in the embedding) and nodes are colored at the Phylum level, except for the two nodes with the highest betweenness (shown in gray, see also Additional file 6: Figure S6). c We used natural connectivity to assess the robustness of microbial ecological interaction networks to sequential node removals. The order of node removals was either random or ordered by degree or betweenness centrality. Natural connectivity is shown as a function of the relative size of the network
Similar articles
- Red pitaya betacyanins protects from diet-induced obesity, liver steatosis and insulin resistance in association with modulation of gut microbiota in mice.
Song H, Chu Q, Yan F, Yang Y, Han W, Zheng X. Song H, et al. J Gastroenterol Hepatol. 2016 Aug;31(8):1462-9. doi: 10.1111/jgh.13278. J Gastroenterol Hepatol. 2016. PMID: 26699443 - Protective effect of quercetin on high-fat diet-induced non-alcoholic fatty liver disease in mice is mediated by modulating intestinal microbiota imbalance and related gut-liver axis activation.
Porras D, Nistal E, Martínez-Flórez S, Pisonero-Vaquero S, Olcoz JL, Jover R, González-Gallego J, García-Mediavilla MV, Sánchez-Campos S. Porras D, et al. Free Radic Biol Med. 2017 Jan;102:188-202. doi: 10.1016/j.freeradbiomed.2016.11.037. Epub 2016 Nov 25. Free Radic Biol Med. 2017. PMID: 27890642 - Integrated omics analysis unraveled the microbiome-mediated effects of Yijin-Tang on hepatosteatosis and insulin resistance in obese mouse.
Lee JE, Lee SM, Jung J. Lee JE, et al. Phytomedicine. 2020 Dec;79:153354. doi: 10.1016/j.phymed.2020.153354. Epub 2020 Sep 21. Phytomedicine. 2020. PMID: 32992082 - Gut Microbiota and Nonalcoholic Fatty Liver Disease: Insights on Mechanism and Application of Metabolomics.
He X, Ji G, Jia W, Li H. He X, et al. Int J Mol Sci. 2016 Mar 15;17(3):300. doi: 10.3390/ijms17030300. Int J Mol Sci. 2016. PMID: 26999104 Free PMC article. Review. - High fat diet-triggered non-alcoholic fatty liver disease: A review of proposed mechanisms.
Lian CY, Zhai ZZ, Li ZF, Wang L. Lian CY, et al. Chem Biol Interact. 2020 Oct 1;330:109199. doi: 10.1016/j.cbi.2020.109199. Epub 2020 Aug 15. Chem Biol Interact. 2020. PMID: 32805210 Review.
Cited by
- Transitioning From Descriptive to Mechanistic Understanding of the Microbiome: The Need for a Prospective Longitudinal Approach to Predicting Disease.
Martin VJ, Leonard MM, Fiechtner L, Fasano A. Martin VJ, et al. J Pediatr. 2016 Dec;179:240-248. doi: 10.1016/j.jpeds.2016.08.049. Epub 2016 Sep 12. J Pediatr. 2016. PMID: 27634626 Free PMC article. No abstract available. - Altering Microbiomes with Hydroxyapatite Nanoparticles: A Metagenomic Analysis.
Uskoković V, Wu VM. Uskoković V, et al. Materials (Basel). 2022 Aug 24;15(17):5824. doi: 10.3390/ma15175824. Materials (Basel). 2022. PMID: 36079205 Free PMC article. - Integrating the Ecosystem Services Framework to Define Dysbiosis of the Breastfed Infant Gut: The Role of B. infantis and Human Milk Oligosaccharides.
Duar RM, Henrick BM, Casaburi G, Frese SA. Duar RM, et al. Front Nutr. 2020 Apr 14;7:33. doi: 10.3389/fnut.2020.00033. eCollection 2020. Front Nutr. 2020. PMID: 32346537 Free PMC article. - Gut-derived IL-13 contributes to growth via promoting hepatic IGF-1 production.
Ma N, Wang H, Li Q, Chang M, Zhu J, Nan S, Zhang Q, Li Q, Yang D, Ming K, Zhuang S, Guo P, Yin R, Sun J, Wang H, Lei Q, Liu Z, Ding M, Zhou X, Ding Y. Ma N, et al. Microbiome. 2024 Nov 23;12(1):248. doi: 10.1186/s40168-024-01929-3. Microbiome. 2024. PMID: 39580435 Free PMC article. - Mechanistic and therapeutic advances in non-alcoholic fatty liver disease by targeting the gut microbiota.
Han R, Ma J, Li H. Han R, et al. Front Med. 2018 Dec;12(6):645-657. doi: 10.1007/s11684-018-0645-9. Epub 2018 Sep 4. Front Med. 2018. PMID: 30178233 Review.
References
- Ng M, Fleming T, Robinson M, Thomson B, Graetz N, Margono C, et al. Global, regional, and national prevalence of overweight and obesity in children and adults during 1980–2013: a systematic analysis for the Global Burden of Disease Study 2013. Lancet. 2014;384:766–81. doi: 10.1016/S0140-6736(14)60460-8. - DOI - PMC - PubMed
- Jukes TH, Williams WL. Nutritional effects of antibiotics. Pharmacol Rev. 1953;5(4):381–420. - PubMed
Publication types
MeSH terms
Substances
Grants and funding
- P30 CA016087/CA/NCI NIH HHS/United States
- 5T32AI007180-30/AI/NIAID NIH HHS/United States
- T32 AI007180/AI/NIAID NIH HHS/United States
- P30CA016087/CA/NCI NIH HHS/United States
- R01 DK090989/DK/NIDDK NIH HHS/United States
LinkOut - more resources
Full Text Sources
Other Literature Sources
Medical
