Mitochondrial Reactive Oxygen Species Mediate Lysophosphatidylcholine-Induced Endothelial Cell Activation - PubMed (original) (raw)
. 2016 Jun;36(6):1090-100.
doi: 10.1161/ATVBAHA.115.306964. Epub 2016 Apr 28.
Pu Fang 1, Yafeng Li 1, Yin-Ming Kuo 1, Andrew J Andrews 1, Gayani Nanayakkara 1, Candice Johnson 1, Hangfei Fu 1, Huimin Shan 1, Fuyong Du 1, Nicholas E Hoffman 1, Daohai Yu 1, Satoru Eguchi 1, Muniswamy Madesh 1, Walter J Koch 1, Jianxin Sun 1, Xiaohua Jiang 1, Hong Wang 1, Xiaofeng Yang 2
Affiliations
- PMID: 27127201
- PMCID: PMC4882253
- DOI: 10.1161/ATVBAHA.115.306964
Mitochondrial Reactive Oxygen Species Mediate Lysophosphatidylcholine-Induced Endothelial Cell Activation
Xinyuan Li et al. Arterioscler Thromb Vasc Biol. 2016 Jun.
Abstract
Objective: Hyperlipidemia-induced endothelial cell (EC) activation is considered as an initial event responsible for monocyte recruitment in atherogenesis. However, it remains poorly defined what is the mechanism underlying hyperlipidemia-induced EC activation. Here, we tested a novel hypothesis that mitochondrial reactive oxygen species (mtROS) serve as signaling mediators for EC activation in early atherosclerosis.
Approach and results: Metabolomics and transcriptomics analyses revealed that several lysophosphatidylcholine (LPC) species, such as 16:0, 18:0, and 18:1, and their processing enzymes, including Pla2g7 and Pla2g4c, were significantly induced in the aortas of apolipoprotein E knockout mice during early atherosclerosis. Using electron spin resonance and flow cytometry, we found that LPC 16:0, 18:0, and 18:1 induced mtROS in primary human aortic ECs, independently of the activities of nicotinamide adenine dinucleotide phosphate oxidase. Mechanistically, using confocal microscopy and Seahorse XF mitochondrial analyzer, we showed that LPC induced mtROS via unique calcium entry-mediated increase of proton leak and mitochondrial O2 reduction. In addition, we found that mtROS contributed to LPC-induced EC activation by regulating nuclear binding of activator protein-1 and inducing intercellular adhesion molecule-1 gene expression in vitro. Furthermore, we showed that mtROS inhibitor MitoTEMPO suppressed EC activation and aortic monocyte recruitment in apolipoprotein E knockout mice using intravital microscopy and flow cytometry methods.
Conclusions: ATP synthesis-uncoupled, but proton leak-coupled, mtROS increase mediates LPC-induced EC activation during early atherosclerosis. These results indicate that mitochondrial antioxidants are promising therapies for vascular inflammation and cardiovascular diseases.
Keywords: atherosclerosis; endothelial cell; hyperlipidemia; mitochondria; reactive oxygen species.
© 2016 American Heart Association, Inc.
Figures
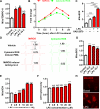
Figure 1. Aortic lysophoshatidylcholine (LPC) species are induced during early atherogenesis in mice
Eight-week old wild-type (WT) mice and apolipoprotein E knockout (ApoE−/−) mice were fed with high-fat diet for 3 weeks before they were sacrificed. Aortas were collected from these mice for metabolomics analysis (A) and microarray analysis (B). A. Aortic LPC species were induced during early atherosclerosis. Relative changes of aortic LPC between WT and ApoE−/− were shown (n=8 per group). B. LPC-generating enzymes, including Pla2g4c and Pla2g7, were induced in the aortas during early atherosclerosis. Volcano plot was presented which showed fold change and statistical P value of expression changes of phospholipase A2 superfamily members and 3 housekeeping genes (Actb, Gapdh, and Nono) between ApoE−/− mice and WT mice (n=5 per group; solid triangle, significantly increased PLA2 genes; grey diamond, unchanged PLA2 genes; empty circle, control housekeeping genes). For all panels, values represent mean ± SEM. NS, not significant; *, p<0.05; **, p<0.01; ***, p<0.001. WT, wild-type; ApoE−/−, apolipoprotein E deficient.
Figure 2. LPC induces mitochondrial ROS (mtROS) in human aortic endothelial cells (HAECs)
A. LPC time-dependently induced mtROS. HAECs were treated with LPC (16:0, 10 μM) for different time points and cell aliquots were incubated with MitoTEMPO-H (1mM) at 37°C for 20 minutes before electron spin resonance (ESR) analysis (n=4, p values vs control). B. Higher mtROS than cytosolic ROS were induced by LPC. HAECs were treated with LPC (16:0, 10 μM) for different time points and cell aliquots were incubated with either mtROS spin probe MitoTEMPO-H (1mM, red line) or cytosolic ROS spin probe CP-H (1mM, green line) at 37°C for 20min before measurement by ESR. C. The effect of NADPH oxidase inhibition on LPC-induced mtROS. After loading with MitoSOX (5 μM) for 10 min, HAECs were treated with LPC (16:0, 10 μM) with or without NADPH oxidase inhibitor VAS-2870 (5 μM) for 1 hour before flow cytometry analysis (n=6). Fold change of MitoSOX+ cell population was shown. D. The effect of NADPH oxidase activation on mtROS. HAECs were treated with Antimycin A (5 μM) or phorbol myristate acetate (PMA, 5 μM) for 1 hour and cells were incubated with mtROS probe MitoTEMPO-H (1mM) and cytosolic ROS probe CPH (1mM) before measurement by ESR. ESR signals were shown and fold changes were quantified by measuring the difference between maximal and minimal spin probe signal. E. LPC dose-dependently induced mtROS. After loading with MitoSOX (5 μM) for 10 min, HAECs were treated with different doses of LPC (16:0) ranging from 2.5μM to 40 μM for 1 hour before flow cytometry analysis (n=8, p values vs control). F. Higher concentration of LPC induced cytotoxicity. HAECs were treated with different doses of LPC (16:0) for 1 hour and cell mediums were collected for the measurement of LDH release as an indicator of cytotoxicity (n=15, p values vs control). G. Three major LPC species all induced mtROS. Three major LPC species (10 μM) including LPC (16:0), LPC (18:0), and LPC (18:1) all significantly induced mtROS in HAEC after 1-hour treatment as measured by MitoSOX using flow cytometry method (n=6, p values vs control). H. Visualization of mtROS induction by LPC. After treatment of HAEC with vehicle control or LPC (16:0, 10 μM) for 1 hour, MitoSOX staining was visualized by fluorescent microscopy. The data are representative of three randomly chosen field. For all panels, values represent mean ± SEM and data are representative of at least two independent experiments. NS, not significant, *, p<0.05, **, p<0.01, ***, p<0.001. PMA, phorbol myristate acetate.
Figure 3. LPC induces mitochondrial Ca2+ entry in HAECs
A. LPC induced both cytosolic Ca2+ and mitochondrial Ca2+ in HAEC. HAECs loaded with cytosolic Ca2+ (cytoCa2+) indicator Fluo-4/AM (green) and mitochondrial Ca2+ (mitoCa2+) indicator Rhod-2 (red) were stimulated by 10 μM LPC and analyzed by confocal microscopy. Images were taken before and after the stimulation of LPC. B. LPC-induced mitochondrial Ca2+ followed quickly after cytosolic Ca2+ increase. Real-time tracing of cytosolic and mitochondrial Ca2+ mobilization in response to LPC from the confocal microscopy analysis was shown. Each line represents the mean value from three cells. C. LPC induced similar levels of mitochondrial Ca2+ and cytosolic Ca2+. Quantitation of peak response of cytosolic Ca2+ and mitochondrial Ca2+ from the confocal microscopy analysis was shown (n=9). For all panels, values represent mean ± SEM and data are representative of at least three independent experiments. ***, p<0.001. CytoCa2+, cytosolic Ca2+; mitoCa2+, mitochondrial Ca2+. F/F0, fluorescence intensity ratios.
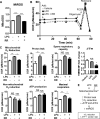
Figure 4. Mitochondrial Ca2+ entry mediates LPC-induced mtROS by increasing mitochondrial O2 reduction and proton leak in HAECs
A. LPC induced mtROS via mitochondrial Ca2+ entry. After loading with MitoSOX (5 μM) for 10 min, HAECs were treated with vehicle control, LPC (10 μM), or LPC (10 μM) plus Ruthenium Red (RR) (10 μM) for 1 hour and mtROS were measured by flow cytometer (n=8). B & C. LPC induced mitochondrial O2 reduction and proton leak via mitochondrial Ca2+ entry. After the addition of vehicle control, LPC (10 μM), and LPC (10 μM) plus RR (10 μM), oxygen consumption rate (OCR) was measured every 20 minutes for 1 hour. Afterwards, XF Mito Stress Test was performed by sequential adding of Oligomycin (1 μM), FCCP (1 μM), and Rotenone (1 μM). Experiment curve (B) and quantification of six mitochondrial parameters (C) were shown (n=6). D. LPC did not affect mitochondrial membrane potential (ΔΨm). After HAECs were treated with vehicle control, LPC (10 μM), or FCCP (1 μM) for 1 hour, they were loaded with ΔΨm probe TMRM (30 nM) for 20 min, and ΔΨm was measured by flow cytometer (n=4, p values vs control). E. Schematic representation of how LPC induced mtROS. For all panels, values represent mean ± SEM and data are representative of at least two independent experiments. NS, not significant, *, p<0.05, **, p<0.01, ***, p<0.001. RR, Ruthenium Red; ΔΨm, mitochondrial membrane potential. OCR, oxygen consumption rate; MFI, mean fluorescence intensity.
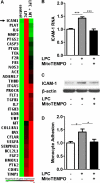
Figure 5. LPC-induced mtROS are required for ICAM-1 upregulation in HAECs
A. LPC induced ICAM-1 and other EC function-related genes via mtROS. HAECs were treated with vehicle control, LPC (10μM), and LPC (10μM) plus MT (1μM) for 6 hours and RNA was collected for Human EC Biology PCR array (QIAGEN) analysis. Non-supervised hierarchical clustering of genes was used to generate heat map to show the genes that were regulated by LPC-induced mtROS. Three samples were pooled in each group. B. Confirmation by real-time PCR. HAECs were treated with LPC (10 μM) with/without MitoTEMPO (1 μM) for 18 hours before RNA was collected for real-time PCR analysis. Quantitation of ICAM-1 RNA expression normalized by β-actin was shown (n=6). C. Confirmation by Western blot. HAECs were treated with LPC (10 μM) with/without MitoTEMPO (1 μM) for 18 hours before proteins were collected for ICAM-1 expression. Representative Western blots from three independent experiments were shown. D. Effects of mtROS inhibition on LPC-induced monocyte adhesion to HAECs. HAECs were treated with LPC (10 μM) with/without MitoTEMPO (1 μM) for 4 hours, after which the adhesion of non-stimulated, fluorescence-labeled human peripheral blood mononuclear cells to stimulated HAECs was quantified (n=5). For all panels, values represent mean ± SEM and data are representative of at least two independent experiments. *, p<0.05, **, p<0.01, ***, p<0.001. MT, MitoTEMPO.
Figure 6. MtROS contribute to LPC-induced endothelial activation by upregulating nuclear binding of AP-1 on the promoter of ICAM-1
A. Putative AP-1 and NFκB binding site in the promoter of ICAM-1. B & C. MtROS inhibitor MitoTEMPO blocked LPC-induced nuclear AP-1 binding. HAECs were treated with vehicle or LPC (10 μM) for 1 hour with or without MitoTEMPO (1 μM) 1-hour pre-incubation, and nuclear proteins were collected afterwards for electrophoretic mobility shift assay (EMSA). 2 μg nuclear proteins were used for AP-1 EMSA (B) and 5 μg nuclear proteins were used for NFκB EMSA (C). Representative images from three independent experiments were shown.
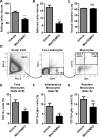
Fig. 7. MitoTEMPO treatment decreases in vivo endothelial activation during early atherosclerosis
At eight weeks of age, mini-pumps containing saline or MitoTEMPO (1500 μg/kg/day) were implanted in ApoE−/− mice before they were fed with a high fat diet for three weeks. Afterwards, intravital microscopy (A-C, n=4-6 mice per group, 3 vein vessels per mouse were recorded) and flow cytometry analyses (D to G, n=7-9 mice per group) were carried out to determine the endothelial activation status in vivo. A. MitoTEMPO treatment decreased leukocyte rolling to endothelium. Number of leukocytes that rolled past an imaginary line that was perpendicular to the vessels during a 1-minute period observed. B. MitoTEMPO decreased leukocyte adhesion to endothelium. Number of cells adhered to the endothelium for 1 minute, 100um length observed. C. MitoTEMPO did not change mean vessel diameter of venule. D. Gating strategy of aortic monocyte by flow cytometry. Total monocytes were gated as Indo-1−CD45+CD11b+ and inflammatory monocytes were gated as Indo-1-CD45+CD11b+Ly6c+. E. MitoTEMPO decreased aortic monocyte infiltration. Percentages of CD11b+ monocytes (Gate A+B in panel C) in total aortic leukocyte cell population (Indo-1−CD45+) were shown in each group. F. MitoTEMPO decreased aortic inflammatory monocyte infiltration. Percentages of CD11b+Ly6c+inflammatory monocytes (Gate B in panel C) in total aortic leukocyte cell population were shown in each group. G. MitoTEMPO did not significantly affect aortic resident monocyte infiltration. Percentages of CD11b+Ly6c− resident monocytes (Gate A in panel C) in total aortic leukocyte cell population were shown in each group. For all panels, values represent mean ± SEM. NS, not significant, *, p<0.05, ***, p<0.001.
Figure 8. A new working model
Left, during early atherosclerosis, LPCs are induced in the aorta, presumably due to increased expression of Pla2g4c and Pla2g7. LPC then induces cytosolic Ca2+, which then enters into the mitochondria of aortic endothelial cells. LPC-induced mitochondrial Ca2+ then stimulates mitochondrial electron transport chain and proton leak without affecting ATP synthesis and mitochondrial membrane potential. As a result, mitochondrial reactive oxygen species (mtROS) are specifically induced without causing mitochondria injury. LPC-induced mtROS could then be released to the cytosol, where they regulate nuclear binding of AP-1 to the promoter of intercellular adhesion molecule-1 (ICAM-1) and other genes, contributing to endothelial activation. Anterograde signaling describes signal transduction from cytosol to mitochondria and retrograde signaling describes signal transduction from mitochondria to cytosol and nucleus. Right, LPC induces ATP-uncoupled, but proton leak-coupled mtROS. ICAM-1, intercellular adhesion molecule-1; mtROS, mitochondrial reactive oxygen species. ΔΨm, mitochondrial membrane potential.
Similar articles
- IL-35 (Interleukin-35) Suppresses Endothelial Cell Activation by Inhibiting Mitochondrial Reactive Oxygen Species-Mediated Site-Specific Acetylation of H3K14 (Histone 3 Lysine 14).
Li X, Shao Y, Sha X, Fang P, Kuo YM, Andrews AJ, Li Y, Yang WY, Maddaloni M, Pascual DW, Luo JJ, Jiang X, Wang H, Yang X. Li X, et al. Arterioscler Thromb Vasc Biol. 2018 Mar;38(3):599-609. doi: 10.1161/ATVBAHA.117.310626. Epub 2018 Jan 25. Arterioscler Thromb Vasc Biol. 2018. PMID: 29371247 Free PMC article. - Early hyperlipidemia promotes endothelial activation via a caspase-1-sirtuin 1 pathway.
Yin Y, Li X, Sha X, Xi H, Li YF, Shao Y, Mai J, Virtue A, Lopez-Pastrana J, Meng S, Tilley DG, Monroy MA, Choi ET, Thomas CJ, Jiang X, Wang H, Yang XF. Yin Y, et al. Arterioscler Thromb Vasc Biol. 2015 Apr;35(4):804-16. doi: 10.1161/ATVBAHA.115.305282. Epub 2015 Feb 19. Arterioscler Thromb Vasc Biol. 2015. PMID: 25705917 Free PMC article. - Role of Hic-5 in the formation of microvilli-like structures and the monocyte-endothelial interaction that accelerates atherosclerosis.
Arita-Okubo S, Kim-Kaneyama JR, Lei XF, Fu WG, Ohnishi K, Takeya M, Miyauchi A, Honda H, Itabe H, Miyazaki T, Miyazaki A. Arita-Okubo S, et al. Cardiovasc Res. 2015 Mar 1;105(3):361-71. doi: 10.1093/cvr/cvv003. Epub 2015 Jan 12. Cardiovasc Res. 2015. PMID: 25587044 - Mitochondrial ROS, uncoupled from ATP synthesis, determine endothelial activation for both physiological recruitment of patrolling cells and pathological recruitment of inflammatory cells.
Li X, Fang P, Yang WY, Chan K, Lavallee M, Xu K, Gao T, Wang H, Yang X. Li X, et al. Can J Physiol Pharmacol. 2017 Mar;95(3):247-252. doi: 10.1139/cjpp-2016-0515. Epub 2016 Nov 5. Can J Physiol Pharmacol. 2017. PMID: 27925481 Free PMC article. Review. - Proton leak regulates mitochondrial reactive oxygen species generation in endothelial cell activation and inflammation - A novel concept.
Nanayakkara GK, Wang H, Yang X. Nanayakkara GK, et al. Arch Biochem Biophys. 2019 Feb 15;662:68-74. doi: 10.1016/j.abb.2018.12.002. Epub 2018 Dec 3. Arch Biochem Biophys. 2019. PMID: 30521782 Free PMC article. Review.
Cited by
- Innate immunity of vascular smooth muscle cells contributes to two-wave inflammation in atherosclerosis, twin-peak inflammation in aortic aneurysms and trans-differentiation potential into 25 cell types.
Yang Q, Saaoud F, Lu Y, Pu Y, Xu K, Shao Y, Jiang X, Wu S, Yang L, Tian Y, Liu X, Gillespie A, Luo JJ, Shi XM, Zhao H, Martinez L, Vazquez-Padron R, Wang H, Yang X. Yang Q, et al. Front Immunol. 2024 Jan 24;14:1348238. doi: 10.3389/fimmu.2023.1348238. eCollection 2023. Front Immunol. 2024. PMID: 38327764 Free PMC article. - Anti-inflammatory cytokines IL-35 and IL-10 block atherogenic lysophosphatidylcholine-induced, mitochondrial ROS-mediated innate immune activation, but spare innate immune memory signature in endothelial cells.
Li X, Fang P, Sun Y, Shao Y, Yang WY, Jiang X, Wang H, Yang X. Li X, et al. Redox Biol. 2020 Jan;28:101373. doi: 10.1016/j.redox.2019.101373. Epub 2019 Nov 6. Redox Biol. 2020. PMID: 31731100 Free PMC article. - The Role of Lipids in Parkinson's Disease.
Xicoy H, Wieringa B, Martens GJM. Xicoy H, et al. Cells. 2019 Jan 7;8(1):27. doi: 10.3390/cells8010027. Cells. 2019. PMID: 30621069 Free PMC article. Review. - Gemfibrozil-Induced Intracellular Triglyceride Increase in SH-SY5Y, HEK and Calu-3 Cells.
Bachmann CM, Janitschke D, Lauer AA, Erhardt T, Hartmann T, Grimm MOW, Grimm HS. Bachmann CM, et al. Int J Mol Sci. 2023 Feb 3;24(3):2972. doi: 10.3390/ijms24032972. Int J Mol Sci. 2023. PMID: 36769295 Free PMC article. - Metabotypes of response to bariatric surgery independent of the magnitude of weight loss.
Palau-Rodriguez M, Tulipani S, Marco-Ramell A, Miñarro A, Jáuregui O, Sanchez-Pla A, Ramos-Molina B, Tinahones FJ, Andres-Lacueva C. Palau-Rodriguez M, et al. PLoS One. 2018 Jun 1;13(6):e0198214. doi: 10.1371/journal.pone.0198214. eCollection 2018. PLoS One. 2018. PMID: 29856816 Free PMC article.
References
- Libby P, Ridker PM, Hansson GK. Progress and challenges in translating the biology of atherosclerosis. Nature. 2011;473:317–25. - PubMed
- Mozaffarian D, Benjamin EJ, Go AS, et al. Heart disease and stroke statistics-2015 update: a report from the american heart association. Circulation. 2015;131:e29–e322. - PubMed
- Combadiere C, Potteaux S, Rodero M, Simon T, Pezard A, Esposito B, Merval R, Proudfoot A, Tedgui A, Mallat Z. Combined inhibition of CCL2, CX3CR1, and CCR5 abrogates Ly6C(hi) and Ly6C(lo) monocytosis and almost abolishes atherosclerosis in hypercholesterolemic mice. Circulation. 2008;117:1649–57. - PubMed
Publication types
MeSH terms
Substances
Grants and funding
- R01 HL128324/HL/NHLBI NIH HHS/United States
- R01 HL108910/HL/NHLBI NIH HHS/United States
- R01 HL133248/HL/NHLBI NIH HHS/United States
- R01 HL132399/HL/NHLBI NIH HHS/United States
- R01 HL094451/HL/NHLBI NIH HHS/United States
- P30 CA006927/CA/NCI NIH HHS/United States
LinkOut - more resources
Full Text Sources
Other Literature Sources
Medical
Molecular Biology Databases
Research Materials
Miscellaneous


