Temperate Earth-sized planets transiting a nearby ultracool dwarf star - PubMed (original) (raw)
. 2016 May 12;533(7602):221-4.
doi: 10.1038/nature17448. Epub 2016 May 2.
Emmanuël Jehin 1, Susan M Lederer 2, Laetitia Delrez 1, Julien de Wit 3, Artem Burdanov 1, Valérie Van Grootel 1, Adam J Burgasser 4, Amaury H M J Triaud 5, Cyrielle Opitom 1, Brice-Olivier Demory 6, Devendra K Sahu 7, Daniella Bardalez Gagliuffi 4, Pierre Magain 1, Didier Queloz 6
Affiliations
- PMID: 27135924
- PMCID: PMC5321506
- DOI: 10.1038/nature17448
Temperate Earth-sized planets transiting a nearby ultracool dwarf star
Michaël Gillon et al. Nature. 2016.
Abstract
Star-like objects with effective temperatures of less than 2,700 kelvin are referred to as 'ultracool dwarfs'. This heterogeneous group includes stars of extremely low mass as well as brown dwarfs (substellar objects not massive enough to sustain hydrogen fusion), and represents about 15 per cent of the population of astronomical objects near the Sun. Core-accretion theory predicts that, given the small masses of these ultracool dwarfs, and the small sizes of their protoplanetary disks, there should be a large but hitherto undetected population of terrestrial planets orbiting them--ranging from metal-rich Mercury-sized planets to more hospitable volatile-rich Earth-sized planets. Here we report observations of three short-period Earth-sized planets transiting an ultracool dwarf star only 12 parsecs away. The inner two planets receive four times and two times the irradiation of Earth, respectively, placing them close to the inner edge of the habitable zone of the star. Our data suggest that 11 orbits remain possible for the third planet, the most likely resulting in irradiation significantly less than that received by Earth. The infrared brightness of the host star, combined with its Jupiter-like size, offers the possibility of thoroughly characterizing the components of this nearby planetary system.
Conflict of interest statement
The authors declare no competing financial interests.
Figures
Extended Data Figure 1. Raw TRAPPIST-1 transit light curves.
The light curves are shown in chronological order from top to bottom and left to right, with unbinned (cyan dots) and binned per 0.005-d (7.2-min) intervals (black dots with error bars). The error bars are the standard errors of the mean of the measurements in the bins. The best-fit transit+baseline models are overplotted (red line). The light curves are phased for the mid-transit time and shifted along the_y_-axis for the sake of clarity. For the dual transit of 11 Dec 2015, the light curve is phased for the mid-transit time of planet c.
Extended Data Figure 2. Detrended TRAPPIST-1 transit light curves.
Same as Extended Data Fig. 1, except that the light curves are here divided by the best-fit baseline model to highlight the transit signatures.
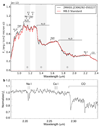
Extended Data Figure 3. Near-infrared spectra of TRAPPIST-1.
a, Comparison of TRAPPIST-1's near-infrared spectrum obtained with the spectrograph IRTF/SpeX and the spectrum of the M8-type standard LHS132 (red). b, Cross-dispersed IRTF/SpeX spectrum of TRAPPIST-1 in the 2.17-2.35 μm region. NaI, CaI and CO features are labeled. Additional structure is primarily from overlapping H2O bands. The spectrum is normalized at 2.2 μm.
Extended Data Figure 4. Flare events in the TRAPPIST 2015 photometry.
The photometric measurements are shown unbinned (cyan dots) and binned per 7.2-minute intervals. For each interval, the error bars are the standard error of the mean.
Extended Data Figure 5. Photometric variability of TRAPPIST-1.
a, Global light curve of the star as measured by TRAPPIST. The photometric measurements are shown unbinned (cyan dots) and binned per night (black dots with error bars = standard errors of the mean). It is compared to the light curve of the comparison star 2MASSJ23063445-0507511, shifted along the y-axis for the sake of clarity.b, Same light curve folded on the period P=1.40-days and binned by 10-minute intervals (error bars = standard errors of the mean). Two periods are shown in the figure for the sake of clarity.
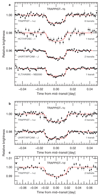
Figure 1. Transit photometry of the TRAPPIST-1 planets.
Each light curve is phased to the time of inferior conjunction (mid-transit time) of the object. The light curves are binned by 2-minute intervals for planet b (a) and 5-minute interval for planet c (b) and d (c). The best-fit transit models as derived from the global analysis of the data are overplotted on the light curves (red lines). The light curves are shifted along the _y_-axis for the sake of clarity. For the HCT/HFOSC light curve, the data are unbinned and the error bars are the formal measurement errors. For the other light curves, the error bars are the standard errors of the mean of the measurements in the bin.
Figure 2. Host star masses and temperatures of the known sub-Neptune-size exoplanets.
The size of the symbols linearly scales with planet radius. The background is color-coded as a function of stellar mass (in units of the Sun’s mass). TRAPPIST-1 is at the boundary between hydrogen burning stars and brown dwarfs. Equilibrium temperatures are estimated neglecting atmospheric effects and assuming an Earth-like albedo of 0.3. The positions of the solar system terrestrial planets are given with dotted lines for reference. The range of possible equilibrium temperatures of TRAPPIST-1d is represented by a solid bar. The location of the dot is the most likely solution. Only the exoplanets with a measured radius equal to or smaller than GJ1214b's are included in the figure.
Figure 3. Potential for atmospheric characterization of known transiting sub-Neptune-size exoplanets.
Estimation of the signal in transmission (in ppm, parts per million and for clear water-dominated atmospheres with mean molecular weight μ = 19) and signal-to-noise (SNR) in transmission (normalized to GJ1214b's) versus equilibrium temperatures (Teq) assuming a Bond albedo of 0.3. The black line indicates the SNR ratio requiring 200(500)[1000] hrs of in-transit observations with JWST to yield a planet's atmospheric temperature with a relative uncertainty below 15% and abundances within a factor of 4 in the case of a H2O(N2)[CO2]-dominated atmosphere (μ=19(28)[39]). Only the exoplanets with a measured radius equal to or smaller than GJ1214b's are included in the figure. The size of the circular symbol of each planet is proportional to its physical size.
Comment in
- Astronomy: Earth's seven sisters.
Snellen IA. Snellen IA. Nature. 2017 Feb 22;542(7642):421-423. doi: 10.1038/542421a. Nature. 2017. PMID: 28230129 No abstract available.
Similar articles
- Seven temperate terrestrial planets around the nearby ultracool dwarf star TRAPPIST-1.
Gillon M, Triaud AH, Demory BO, Jehin E, Agol E, Deck KM, Lederer SM, de Wit J, Burdanov A, Ingalls JG, Bolmont E, Leconte J, Raymond SN, Selsis F, Turbet M, Barkaoui K, Burgasser A, Burleigh MR, Carey SJ, Chaushev A, Copperwheat CM, Delrez L, Fernandes CS, Holdsworth DL, Kotze EJ, Van Grootel V, Almleaky Y, Benkhaldoun Z, Magain P, Queloz D. Gillon M, et al. Nature. 2017 Feb 22;542(7642):456-460. doi: 10.1038/nature21360. Nature. 2017. PMID: 28230125 Free PMC article. - A temperate rocky super-Earth transiting a nearby cool star.
Dittmann JA, Irwin JM, Charbonneau D, Bonfils X, Astudillo-Defru N, Haywood RD, Berta-Thompson ZK, Newton ER, Rodriguez JE, Winters JG, Tan TG, Almenara JM, Bouchy F, Delfosse X, Forveille T, Lovis C, Murgas F, Pepe F, Santos NC, Udry S, Wünsche A, Esquerdo GA, Latham DW, Dressing CD. Dittmann JA, et al. Nature. 2017 Apr 19;544(7650):333-336. doi: 10.1038/nature22055. Nature. 2017. PMID: 28426003 - A rocky planet transiting a nearby low-mass star.
Berta-Thompson ZK, Irwin J, Charbonneau D, Newton ER, Dittmann JA, Astudillo-Defru N, Bonfils X, Gillon M, Jehin E, Stark AA, Stalder B, Bouchy F, Delfosse X, Forveille T, Lovis C, Mayor M, Neves V, Pepe F, Santos NC, Udry S, Wünsche A. Berta-Thompson ZK, et al. Nature. 2015 Nov 12;527(7577):204-7. doi: 10.1038/nature15762. Nature. 2015. PMID: 26560298 - M stars as targets for terrestrial exoplanet searches and biosignature detection.
Scalo J, Kaltenegger L, Segura A, Fridlund M, Ribas I, Kulikov YN, Grenfell JL, Rauer H, Odert P, Leitzinger M, Selsis F, Khodachenko ML, Eiroa C, Kasting J, Lammer H. Scalo J, et al. Astrobiology. 2007 Feb;7(1):85-166. doi: 10.1089/ast.2006.0125. Astrobiology. 2007. PMID: 17407405 Review. - A reappraisal of the habitability of planets around M dwarf stars.
Tarter JC, Backus PR, Mancinelli RL, Aurnou JM, Backman DE, Basri GS, Boss AP, Clarke A, Deming D, Doyle LR, Feigelson ED, Freund F, Grinspoon DH, Haberle RM, Hauck SA 2nd, Heath MJ, Henry TJ, Hollingsworth JL, Joshi MM, Kilston S, Liu MC, Meikle E, Reid IN, Rothschild LJ, Scalo J, Segura A, Tang CM, Tiedje JM, Turnbull MC, Walkowicz LM, Weber AL, Young RE. Tarter JC, et al. Astrobiology. 2007 Feb;7(1):30-65. doi: 10.1089/ast.2006.0124. Astrobiology. 2007. PMID: 17407403 Review.
Cited by
- A combined transmission spectrum of the Earth-sized exoplanets TRAPPIST-1 b and c.
de Wit J, Wakeford HR, Gillon M, Lewis NK, Valenti JA, Demory BO, Burgasser AJ, Burdanov A, Delrez L, Jehin E, Lederer SM, Queloz D, Triaud AH, Van Grootel V. de Wit J, et al. Nature. 2016 Sep 1;537(7618):69-72. doi: 10.1038/nature18641. Epub 2016 Jul 20. Nature. 2016. PMID: 27437572 - Beyond Hubble.
Gibb BC. Gibb BC. Nat Chem. 2022 Nov;14(11):1207-1209. doi: 10.1038/s41557-022-01080-2. Nat Chem. 2022. PMID: 36302866 No abstract available. - An ultra-short-period super-Earth with an extremely high density and an outer companion.
Livingston JH, Gandolfi D, Trani AA, Herath M, Barragán O, Hatzes A, Luque R, Fukui A, Nowak G, Palle E, Hellier C, Fridlund M, de Leon J, Hirano T, Narita N, Albrecht S, Dai F, Deeg H, Van Eylen V, Korth J, Tamura M. Livingston JH, et al. Sci Rep. 2024 Nov 8;14(1):27219. doi: 10.1038/s41598-024-76490-y. Sci Rep. 2024. PMID: 39516227 Free PMC article. - Atmospheric escape from the TRAPPIST-1 planets and implications for habitability.
Dong C, Jin M, Lingam M, Airapetian VS, Ma Y, van der Holst B. Dong C, et al. Proc Natl Acad Sci U S A. 2018 Jan 9;115(2):260-265. doi: 10.1073/pnas.1708010115. Epub 2017 Dec 28. Proc Natl Acad Sci U S A. 2018. PMID: 29284746 Free PMC article. - Seven temperate terrestrial planets around the nearby ultracool dwarf star TRAPPIST-1.
Gillon M, Triaud AH, Demory BO, Jehin E, Agol E, Deck KM, Lederer SM, de Wit J, Burdanov A, Ingalls JG, Bolmont E, Leconte J, Raymond SN, Selsis F, Turbet M, Barkaoui K, Burgasser A, Burleigh MR, Carey SJ, Chaushev A, Copperwheat CM, Delrez L, Fernandes CS, Holdsworth DL, Kotze EJ, Van Grootel V, Almleaky Y, Benkhaldoun Z, Magain P, Queloz D. Gillon M, et al. Nature. 2017 Feb 22;542(7642):456-460. doi: 10.1038/nature21360. Nature. 2017. PMID: 28230125 Free PMC article.
References
- Kirkpatrick JD, Henry TJ, Simon DA. The solar neighborhood. 2: the first list of dwarfs with spectral types of M7 and cooler. Astron J. 1995;109:797–807.
- Cantrell JR, Henry TJ, White RJ. The solar neighborhood XXIX: the habitable real estate of our nearest stellar neighbours. Astron J. 2013;146:99.
- Andrews SM, Wilner DJ, Hugues AM, Qi C, Dullemond CP. Protoplanetary disk structures in Opiuchus. II. Extension to fainter sources. Astrophys J. 2010;723:1241–1254.
- Lyu Y, Joergens V, Bayo A, Nielbock M, Wang H. A homogeneous analysis of disk around brown dwarfs. Astron & Astrophys. 2015;582:A22.
- Payne MJ, Lodato G. The potential for Earth-mass planet formation around brown dwarfs. Mon Not R Astron Soc. 2007;381:1597–1606.
Publication types
LinkOut - more resources
Full Text Sources
Other Literature Sources


