Regulation of genetic flux between bacteria by restriction-modification systems - PubMed (original) (raw)
Regulation of genetic flux between bacteria by restriction-modification systems
Pedro H Oliveira et al. Proc Natl Acad Sci U S A. 2016.
Abstract
Restriction-modification (R-M) systems are often regarded as bacteria's innate immune systems, protecting cells from infection by mobile genetic elements (MGEs). Their diversification has been recently associated with the emergence of particularly virulent lineages. However, we have previously found more R-M systems in genomes carrying more MGEs. Furthermore, it has been suggested that R-M systems might favor genetic transfer by producing recombinogenic double-stranded DNA ends. To test whether R-M systems favor or disfavor genetic exchanges, we analyzed their frequency with respect to the inferred events of homologous recombination and horizontal gene transfer within 79 bacterial species. Genetic exchanges were more frequent in bacteria with larger genomes and in those encoding more R-M systems. We created a recognition target motif predictor for Type II R-M systems that identifies genomes encoding systems with similar restriction sites. We found more genetic exchanges between these genomes, independently of their evolutionary distance. Our results reconcile previous studies by showing that R-M systems are more abundant in promiscuous species, wherein they establish preferential paths of genetic exchange within and between lineages with cognate R-M systems. Because the repertoire and/or specificity of R-M systems in bacterial lineages vary quickly, the preferential fluxes of genetic transfer within species are expected to constantly change, producing time-dependent networks of gene transfer.
Keywords: bacterial evolution; homologous recombination; horizontal gene transfer.
Conflict of interest statement
The authors declare no conflict of interest.
Figures
Fig. 1.
Analysis of HR and HGT events. (A) 16S rRNA phylogenetic tree of the 79 bacterial species. The tree was drawn using the iTOL server (
itol.embl.de/index.shtml
) (40). The innermost circle layer indicates the species and associated clade. The six subsequent layers correspond (in an outwardly direction) to the average number of HGT events per genome computed using Count; the number of recombined genes per genome given by NSS, MaxChi, and PHI; and the number of recombination events per genome given by Geneconv and CFML (outermost layer), respectively. These values are given in Dataset S1. (B) Distribution of the average number of horizontal gene transfer (HGT) events and homologous recombination (HR) events (inferred by Geneconv) per clade according to genome size (_G_S). Spearman’s ρHGT = 0.65, P HGT < 10−4; Spearman’s ρGeneconv = 0.32, _P_Geneconv < 10−2. Data obtained with the remaining recombination inference tools are shown in Fig. S1.
Fig. S1.
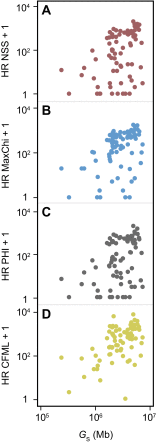
Association between genetic flux and genome size. Distribution of the average homologous recombination (HR) events per clade computed using NSS (A), MaxChi (B), PHI (C), and CFML (D) in function of genome size (G_S, given in megabases). Similarly to what was obtained with Geneconv (Fig. 1_B), we can observe positive associations between HR + 1 and _G_S (Spearman's ρNSS = 0.42, _P_NSS = 10−4; Spearman's ρMaxChi = 0.48, _P_MaxChi < 10−4; Spearman's ρPHI = 0.40, _P_PHI < 10−3; Spearman's ρCFML = 0.48, _P_CFML < 10−4).
Fig. 2.
Association between gene transfer and R-M systems. Distribution of the average HGT events (A) and homologous recombination (HR) events inferred by Geneconv (C) per clade according to the total number of R-M systems. Spearman's ρHGT = 0.43, Spearman's ρGeneconv = 0.62; both P < 10−4. Distribution of the average HGT (B) and Geneconv HR events (D) per clade according to the presence (Yes)/absence (No) of Type II R-M systems (both P < 10−4; Mann–Whitney–Wilcoxon test). We obtained similar qualitative results with the remaining recombination inference tools (Fig. S2).
Fig. S2.
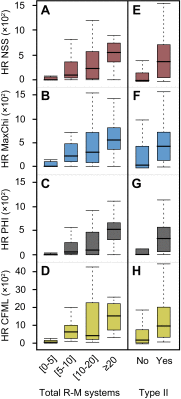
Association between gene transfer and R-M systems. Distribution of the average HR per clade computed using NSS (A), MaxChi (B), PHI (C), and CFML (D) in function of the total number of R-M systems. Positive associations were observed in all cases (Spearman's ρNSS = 0.50, Spearman's ρMaxChi = 0.55, Spearman's ρPHI = 0.53, Spearman's ρCFML = 0.60; all P < 10−4). Also shown are the average HR per clade computed using NSS (E), MaxChi (F), PHI (G), and CFML (H) in function of the presence (Yes) or absence (No) of Type II R-M systems (all P < 10−4; Mann–Whitney–Wilcoxon test).
Fig. 3.
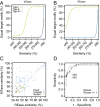
Relation between target specificity and protein similarity in R-M components. Percentage of equal target motifs recognized by Types I, II, and III MTases (A) and REases (B) according to their pairwise protein sequence similarity. (C) Plot of all pairwise similarities of Type II MTases versus the cognate Type II REases of the REBASE gold standard. Blue dots correspond to equal target motifs, red dots to unequal target motifs, and green dots to nested motifs. The dashed horizontal and vertical lines indicate the threshold similarity limits for MTases and REases. (D) The same dataset was used to plot the corresponding receiver operating characteristic (ROC) curves. These curves depict the Sensitivity (true-positive rate) versus 1-Specificity (false-positive rate) for several values of percentage similarity of Type II MTases and REases. We selected the cutoff values of similarity that maximized the true-positive rate and minimized the false-positive rate. Details on the number of R-M proteins of each type can be found in Table S2. ROC data including curve-fitting equations can be found in Table S3.
Fig. S3.
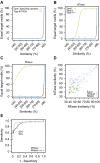
Assessing the robustness of the recognition target motif predictor. (A) Percentage of equal target motifs recognized by Type I Specificity domains and Type III TRDs according to their pairwise sequence similarity. (B–E) Reanalysis of the data from Fig. 3 including PacBio data. Percentage of equal target motifs recognized by Types I, II, and III MTases (B) and REases (C) according to their pairwise protein sequence similarity. (D) Plot of all pairwise similarities of Type II MTases versus the cognate Type II REases of the gold standard of REBASE. Blue dots correspond to equal target motifs, red dots to unequal target motifs, and green dots to nested motifs. The dashed horizontal and vertical lines indicate the threshold similarity limits for MTases and REases. (E) The same dataset was used to plot the corresponding ROC curves. These curves depict the Sensitivity (true-positive rate) versus 1-Specificity (false-positive rate) for several values of percentage similarity of Type II MTases and REases.
Fig. S4.
Association between gene transfer and R-M systems excluding all Type II R-M systems (IIC included). Distribution of the average HGT events per clade computed with Count (A) and homologous recombination (HR) events per clade computed with NSS (B), MaxChi (C), PHI (D), Geneconv (E), and CFML (F) according to the total number of Type I, III R-M systems and Type IV REases. Positive associations were observed in all cases (Spearman's ρHGT = 0.41, Spearman's ρNSS = 0.43, Spearman's ρMaxChi = 0.51, Spearman's ρPHI = 0.46, Spearman's ρCFML = 0.54; all P < 10−4 with the exception of HGT for which P < 10−3).
Fig. S5.
Analysis of the rate of turnover of R-M systems in the clades and how that relates to the length of the tips of the tree. (A) Schema of the analysis. We calculated the frequency of Type II R-M systems shared by the genomes of two taxa (R). For this, we computed the number of systems in the genomes, while grouping together in a family those that are part of the same family of the pangenome (e.g., duplicated systems X and X″ are put together with X′ when they are all more than 80% identical in protein sequence). We then computed the number of families with members in both genomes (one in the example: X, X′, and X″), divided by the total number of families (with members in at least one of the two genomes, three in the example: the family X, X′, and X″ and the families W and Z). The values of R are in general small. In more than 50% of the comparisons, R < 0.1. Note that two R-M systems can be cognate and not be put in the same family of pangenome (if they are not sufficiently similar, e.g., because they were acquired independently from another species). The Count model can be used to analyze the evolution of orthologous families, but not of cognate families because the dataset is not large enough to parameterize the model. (B) Distribution of the patristic distances (d) between genomes with R < 1 (i.e., at least one R-M system not in common). (C) Distribution of the sizes of tips. The comparison between B and C shows that the length of the tips is, on average, smaller than the patristic distances between genomes with different R-M systems. Therefore, the R-M system found in the tip is likely to have been in the lineage for most if not all of the time since the split with the closest neighbor of the taxa in the tree. The comparison also shows that the length of the largest tips is close to the patristic distances for which one starts finding noncognate genomes. Hence, one cannot reliably assume that a given R-M system is present in most of the internal branches because the trait evolves fast.
Fig. S6.
Gene flux in bacteria encoding R-M systems. Contrary to Fig. 4 in the main text, we have not filtered any clade in this analysis: all 79 clades are represented. (A) Histogram of patristic distances (colored by quartiles) between bacteria with Type II R-M systems. (B) Median values of HGT and recombination events for each quartile (Q) and for the full dataset (All) between terminal branches of bacteria with Type II R-M systems recognizing (or not) the same target motif. (C) Correlation between Wagner parsimony gene family gains and maximum likelihood (ML) gains for values of posterior probability (PP) between 0.2 and 0.9. Spearman ρ values are indicated in each graph, and in all cases, P < 10−4; *P < 0.05; **P < 0.01; and ***P < 0.001.
Fig. 4.
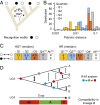
Gene flux in bacteria encoding R-M systems. (A) We analyzed the patterns of HR and HGT in the tree of each clade, comparing the flux between tips ending in cognate (similar recognition motifs) or noncognate (different motifs) extant taxa. (B) Histogram of patristic distances (colored by quartiles) between bacteria with Type II R-M systems. (C) Median values of HGT and recombination events for each quartile (Q) and for the full dataset (All) between terminal branches of bacteria with Type II R-M systems recognizing (or not) the same target motif. We analyzed Bacillus amyloliquefaciens, Bifidobacterium longum, Escherichia coli, Haemophilus influenza, Listeria monocytogenes, Neisseria meningitidis, Salmonella enterica, and Streptococcus pneumoniae. *P < 0.05; **P < 0.01; ***P < 0.001 (see Fig. S6 A and B for the data including all clades). (D) Genetic flux in function of time and the presence of R-M systems. As lineages diverge and R-M systems change (circles indicate such changes), the lineages with cognate R-M systems (same color) share more genetic material than the other lineages. For example, the lineage B changes R-M systems twice since the last common ancestor (LCA). Initially transfer is favored with all lineages, then with the sister lineage A, and finally with the distantly related lineage C.
Fig. S7.
Distribution of ΔmedianHGT in the 100 bootstrap experiments (boxplot on Top and histogram on Bottom). The red dashed line indicates the (null) expectation if the flux between R-M cognate genomes was similar to that of noncognate ones.
Similar articles
- Genetic exchanges are more frequent in bacteria encoding capsules.
Rendueles O, de Sousa JAM, Bernheim A, Touchon M, Rocha EPC. Rendueles O, et al. PLoS Genet. 2018 Dec 21;14(12):e1007862. doi: 10.1371/journal.pgen.1007862. eCollection 2018 Dec. PLoS Genet. 2018. PMID: 30576310 Free PMC article. - The interplay of restriction-modification systems with mobile genetic elements and their prokaryotic hosts.
Oliveira PH, Touchon M, Rocha EP. Oliveira PH, et al. Nucleic Acids Res. 2014;42(16):10618-31. doi: 10.1093/nar/gku734. Epub 2014 Aug 12. Nucleic Acids Res. 2014. PMID: 25120263 Free PMC article. - The chromosomal organization of horizontal gene transfer in bacteria.
Oliveira PH, Touchon M, Cury J, Rocha EPC. Oliveira PH, et al. Nat Commun. 2017 Oct 10;8(1):841. doi: 10.1038/s41467-017-00808-w. Nat Commun. 2017. PMID: 29018197 Free PMC article. - [Homologous recombination among bacterial genomes: the measurement and identification].
Yang XW, Yang RF, Cui YJ. Yang XW, et al. Yi Chuan. 2016 Feb;38(2):137-43. doi: 10.16288/j.yczz.15-382. Yi Chuan. 2016. PMID: 26907777 Review. Chinese. - Gene transfer, speciation, and the evolution of bacterial genomes.
Lawrence JG. Lawrence JG. Curr Opin Microbiol. 1999 Oct;2(5):519-23. doi: 10.1016/s1369-5274(99)00010-7. Curr Opin Microbiol. 1999. PMID: 10508729 Review.
Cited by
- Whole genome phylogenies reflect the distributions of recombination rates for many bacterial species.
Sakoparnig T, Field C, van Nimwegen E. Sakoparnig T, et al. Elife. 2021 Jan 8;10:e65366. doi: 10.7554/eLife.65366. Elife. 2021. PMID: 33416498 Free PMC article. - A mobile restriction-modification system provides phage defence and resolves an epigenetic conflict with an antagonistic endonuclease.
Birkholz N, Jackson SA, Fagerlund RD, Fineran PC. Birkholz N, et al. Nucleic Acids Res. 2022 Apr 8;50(6):3348-3361. doi: 10.1093/nar/gkac147. Nucleic Acids Res. 2022. PMID: 35286398 Free PMC article. - Plasmid fitness costs are caused by specific genetic conflicts enabling resolution by compensatory mutation.
Hall JPJ, Wright RCT, Harrison E, Muddiman KJ, Wood AJ, Paterson S, Brockhurst MA. Hall JPJ, et al. PLoS Biol. 2021 Oct 13;19(10):e3001225. doi: 10.1371/journal.pbio.3001225. eCollection 2021 Oct. PLoS Biol. 2021. PMID: 34644303 Free PMC article. Updated. - The DNA methylation landscape of giant viruses.
Jeudy S, Rigou S, Alempic JM, Claverie JM, Abergel C, Legendre M. Jeudy S, et al. Nat Commun. 2020 May 27;11(1):2657. doi: 10.1038/s41467-020-16414-2. Nat Commun. 2020. PMID: 32461636 Free PMC article. - A sequential one-pot approach for rapid and convenient characterization of putative restriction-modification systems.
Zhang Y, Takaki Y, Yoshida-Takashima Y, Hiraoka S, Kurosawa K, Nunoura T, Takai K. Zhang Y, et al. mSystems. 2023 Dec 21;8(6):e0081723. doi: 10.1128/msystems.00817-23. Epub 2023 Oct 16. mSystems. 2023. PMID: 37843256 Free PMC article.
References
- Frost LS, Leplae R, Summers AO, Toussaint A. Mobile genetic elements: The agents of open source evolution. Nat Rev Microbiol. 2005;3(9):722–732. - PubMed
Publication types
MeSH terms
LinkOut - more resources
Full Text Sources
Other Literature Sources
Molecular Biology Databases

