Simultaneous profiling of transcriptome and DNA methylome from a single cell - PubMed (original) (raw)
Simultaneous profiling of transcriptome and DNA methylome from a single cell
Youjin Hu et al. Genome Biol. 2016.
Abstract
Background: Single-cell transcriptome and single-cell methylome technologies have become powerful tools to study RNA and DNA methylation profiles of single cells at a genome-wide scale. A major challenge has been to understand the direct correlation of DNA methylation and gene expression within single-cells. Due to large cell-to-cell variability and the lack of direct measurements of transcriptome and methylome of the same cell, the association is still unclear.
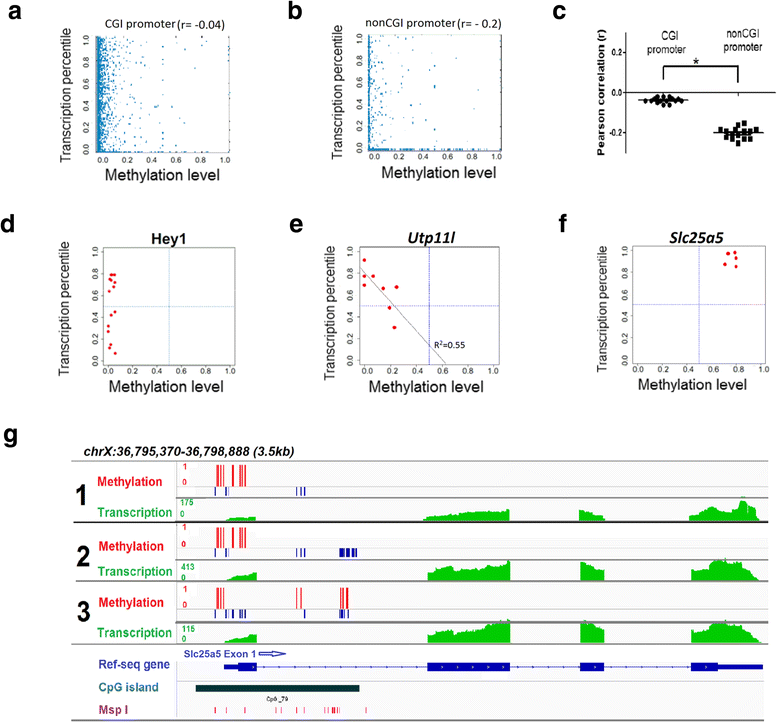
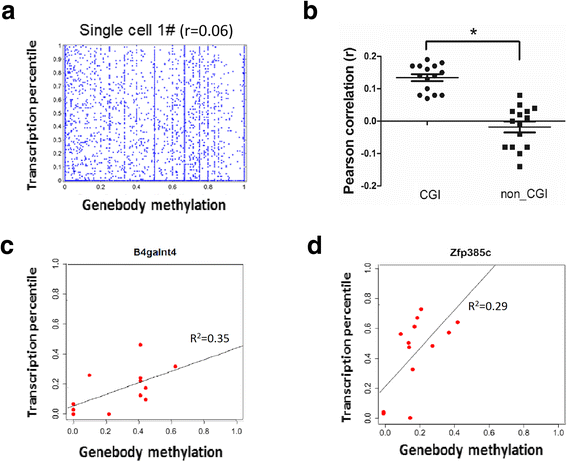
Results: Here, we describe a novel method (scMT-seq) that simultaneously profiles both DNA methylome and transcriptome from the same cell. In sensory neurons, we consistently identify transcriptome and methylome heterogeneity among single cells but the majority of the expression variance is not explained by proximal promoter methylation, with the exception of genes that do not contain CpG islands. By contrast, gene body methylation is positively associated with gene expression for only those genes that contain a CpG island promoter. Furthermore, using single nucleotide polymorphism patterns from our hybrid mouse model, we also find positive correlation of allelic gene body methylation with allelic expression.
Conclusions: Our method can be used to detect transcriptome, methylome, and single nucleotide polymorphism information within single cells to dissect the mechanisms of epigenetic gene regulation.
Keywords: Dorsal root ganglion; Gene regulation; Sensory neurons; Single-cell methylome; Single-cell transcriptome.
Figures
Fig. 1
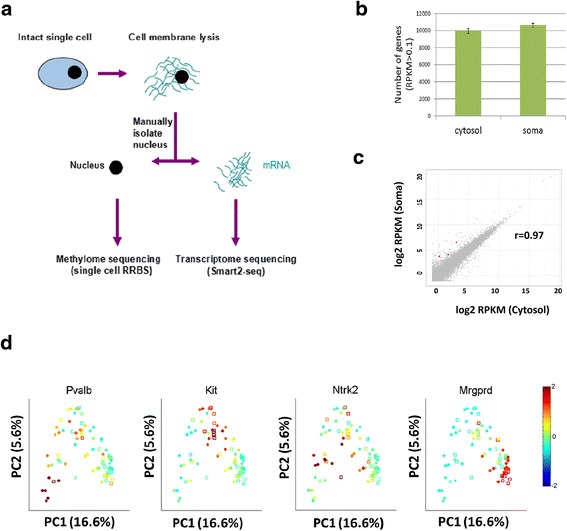
Single-cell cytosol transcriptome resembles single-soma transcriptome. a Schematic of the single-cell transcriptome and methylome sequencing (scMT-seq) method. b Comparison of single-cell cytosol RNA-seq and soma RNA-seq in terms of the coverage of gene number. Only genes with reads per kilobase per million (RPKM) >0.1 were counted. c Scatter plot of transcript expression levels in cytosol (x-axis) or soma (y-axis) samples. Red dots indicate the significantly differentially expressed genes (p <0.01) and gray dots indicate genes that are not differentially expressed. d Principal component analysis for DRG single soma and cytosol RNA-seq libraries. The relative expression levels of known marker genes for specific subgroups are shown in color. Red represents high expression while blue represents low expression. Solid circles represent cytosol; empty squares represent soma
Fig. 2
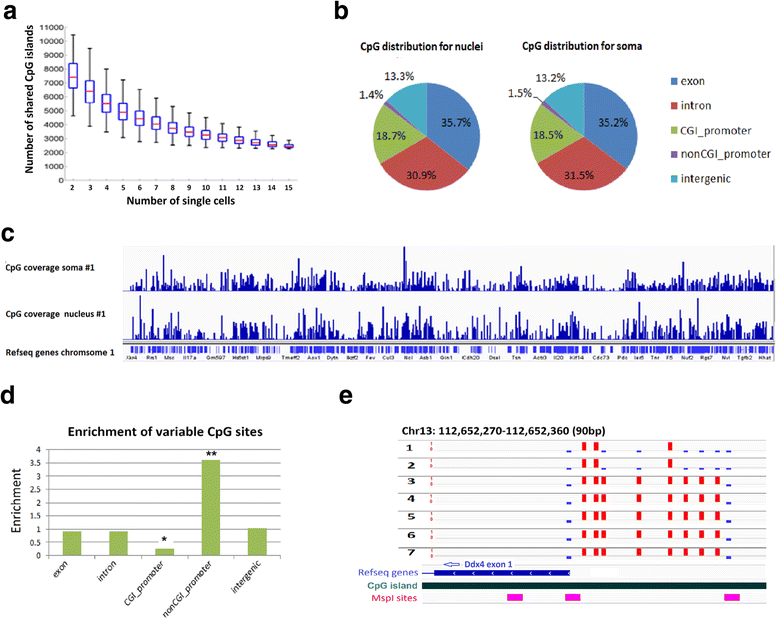
DNA methylome analysis of single DRG neuronal nucleus. a Boxplots showing the distribution of overlapping CGIs between randomly sampled number of cells as indicated on the x-axis. b Pie chart with the genomic distribution of all CpG sites detected in nucleus and soma RRBS libraries. c Genome browser tracks showing the coverage of CpG sites for chromosome 1 that are covered by soma methylome (top) or nucleus methylome (bottom). d Bar graph showing the genomic features that are enriched for differentially methylated CpG sites across scRRBS libraries. * and ** indicate differential distribution of differentially methylated CpG sites at CpG island promoter and non-CpG island promoter region, respectively (p <10−8, binomial test). e The heterogeneous methylation status of a representative locus at promoter region of Ddx4. Red bars indicate the methylated CpG sites, blue bars indicate the unmethylated CpG sites
Fig. 3
Simultaneous profiling of promoter methylation and gene expression from a single neuron. a Representative scatter plot for CGI promoter methylation level and transcription level of genes at whole genome wide within a representative single cell. Promoter methylation level was calculated by the ratio of methylated CpG sites over all CpG sites within the promoter region. Expression level was transformed to expression percentile. b Representative scatter plot for non-CGI promoter methylation level and transcription level of individual genes within a representative single cell. c Dot plot of Pearson correlation coefficients between transcription level (as expression percentile) and promoter methylation. d Representative example of genes with hypomethylation promoter and dynamic expression. Each point represents a single cell. e Representative example of genes that differential promoter methylation is negatively correlated with gene expression. Each point represents a single cell. f Representative example of genes with hypermethylation promoter and high expression. Each point represents a single cell. g Genome browser tracks for Slc25a5 showing promoter hypermethylation and high gene expression in three representative male single cells. Red bars indicate the methylation CpG sites and blue bars indicate the unmethylated CpG sites. RNA transcription level is shown in green. The CpG island reference and MspI cut sites are in dark green and purple, respectively. *p <0.0001
Fig. 4
Correlation of gene body methylation with gene expression in a single neuron. a Scatter plot of gene body methylation and transcription level for genes within single neuron cells. b Dot plot of Pearson correlation coefficients between transcription level (as expression percentile) and gene body methylation. The genes with CpG sites detected in the region more than 0.5 Kb were clustered into two groups, CGI promoter genes and non-CGI promoter genes. c, d Representative scatter plot examples of the CGI promoter genes which are expressed and positively correlated with gene body methylation. *p <0.0001 (Student’s _t_-test)
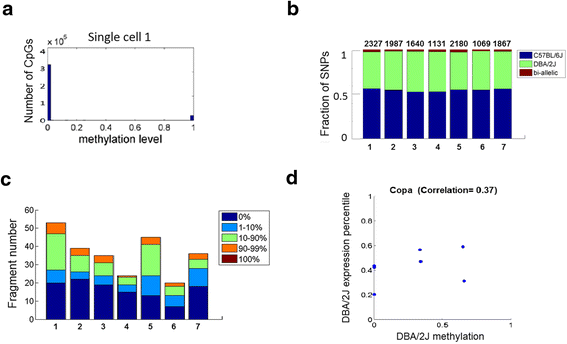
Fig. 5
Profile of allelic-specific transcription and methylation. a Histogram of methylation levels for all CpG sites within a representative single cell. b Bar graph showing the proportion of mono-allellic or bi-allelic SNPs as measured by scRRBS. Each site with known strain-specific SNPs that overlapped with RRBS fragments were interrogated for their presence of C57BL/6 J and DBA/2 J SNPs. Sites that covered both SNPs were considered bi-allelic otherwise are considered mono-allelic. Each bar represents the distribution for a single cell. c Bar graph showing the distribution of methylation level within bi-allelic fragments. Each bar represents the distribution for a single cell. d Scatter plot of DBA/2 J-strain-specific Copa methylation and expression across single cells. Each point represents a single cell and the position on the graph shows the DBA/2 J specific methylation and expression levels for Copa
Similar articles
- Simultaneous Profiling of mRNA Transcriptome and DNA Methylome from a Single Cell.
Hu Y, An Q, Guo Y, Zhong J, Fan S, Rao P, Liu X, Liu Y, Fan G. Hu Y, et al. Methods Mol Biol. 2019;1979:363-377. doi: 10.1007/978-1-4939-9240-9_21. Methods Mol Biol. 2019. PMID: 31028648 - Intraindividual dynamics of transcriptome and genome-wide stability of DNA methylation.
Furukawa R, Hachiya T, Ohmomo H, Shiwa Y, Ono K, Suzuki S, Satoh M, Hitomi J, Sobue K, Shimizu A. Furukawa R, et al. Sci Rep. 2016 May 19;6:26424. doi: 10.1038/srep26424. Sci Rep. 2016. PMID: 27192970 Free PMC article. - Genome-wide DNA methylome variation in two genetically distinct chicken lines using MethylC-seq.
Li J, Li R, Wang Y, Hu X, Zhao Y, Li L, Feng C, Gu X, Liang F, Lamont SJ, Hu S, Zhou H, Li N. Li J, et al. BMC Genomics. 2015 Oct 23;16:851. doi: 10.1186/s12864-015-2098-8. BMC Genomics. 2015. PMID: 26497311 Free PMC article. - Computational Methods for Single-cell DNA Methylome Analysis.
Iqbal W, Zhou W. Iqbal W, et al. Genomics Proteomics Bioinformatics. 2023 Feb;21(1):48-66. doi: 10.1016/j.gpb.2022.05.007. Epub 2022 Jun 17. Genomics Proteomics Bioinformatics. 2023. PMID: 35718270 Free PMC article. Review. - Revealing cellular and molecular complexity of the central nervous system using single cell sequencing.
Zeng Z, Miao N, Sun T. Zeng Z, et al. Stem Cell Res Ther. 2018 Sep 13;9(1):234. doi: 10.1186/s13287-018-0985-z. Stem Cell Res Ther. 2018. PMID: 30213269 Free PMC article. Review.
Cited by
- Simultaneous profiling of RNA isoforms and chromatin accessibility of single cells of human retinal organoids.
Zhang S, Xiao Y, Mo X, Chen X, Zhong J, Chen Z, Liu X, Qiu Y, Dai W, Chen J, Jin X, Fan G, Hu Y. Zhang S, et al. Nat Commun. 2024 Sep 13;15(1):8022. doi: 10.1038/s41467-024-52335-0. Nat Commun. 2024. PMID: 39271703 Free PMC article. - Revolutionizing immunology with single-cell RNA sequencing.
Chen H, Ye F, Guo G. Chen H, et al. Cell Mol Immunol. 2019 Mar;16(3):242-249. doi: 10.1038/s41423-019-0214-4. Epub 2019 Feb 22. Cell Mol Immunol. 2019. PMID: 30796351 Free PMC article. Review. - Underestimated effect of intragenic HIV-1 DNA methylation on viral transcription in infected individuals.
Kint S, Trypsteen W, De Spiegelaere W, Malatinkova E, Kinloch-de Loes S, De Meyer T, Van Criekinge W, Vandekerckhove L. Kint S, et al. Clin Epigenetics. 2020 Feb 28;12(1):36. doi: 10.1186/s13148-020-00829-1. Clin Epigenetics. 2020. PMID: 32111236 Free PMC article. - Integrating ChIP-seq with other functional genomics data.
Jiang S, Mortazavi A. Jiang S, et al. Brief Funct Genomics. 2018 Mar 1;17(2):104-115. doi: 10.1093/bfgp/ely002. Brief Funct Genomics. 2018. PMID: 29579165 Free PMC article. Review. - Deconstructing the pluripotency gene regulatory network.
Li M, Izpisua Belmonte JC. Li M, et al. Nat Cell Biol. 2018 Apr;20(4):382-392. doi: 10.1038/s41556-018-0067-6. Epub 2018 Mar 28. Nat Cell Biol. 2018. PMID: 29593328 Free PMC article. Review.
References
Publication types
MeSH terms
Grants and funding
- R01 DE016513/DE/NIDCR NIH HHS/United States
- UL1-TR000124/TR/NCATS NIH HHS/United States
- R01 AR063089/AR/NIAMS NIH HHS/United States
- T32 AR059033/AR/NIAMS NIH HHS/United States
- T32AR059033/AR/NIAMS NIH HHS/United States
- UL1 TR000124/TR/NCATS NIH HHS/United States
- P50 CA092131/CA/NCI NIH HHS/United States
- P30 CA016042/CA/NCI NIH HHS/United States
- P50CA092131/CA/NCI NIH HHS/United States
LinkOut - more resources
Full Text Sources
Other Literature Sources
Molecular Biology Databases
