Protein kinase Cδ upregulation in microglia drives neuroinflammatory responses and dopaminergic neurodegeneration in experimental models of Parkinson's disease - PubMed (original) (raw)
doi: 10.1016/j.nbd.2016.04.008. Epub 2016 May 2.
Neeraj Singh 1, Vivek Lawana 1, Anamitra Ghosh 1, Dilshan S Harischandra 1, Huajun Jin 1, Colleen Hogan 1, Souvarish Sarkar 1, Dharmin Rokad 1, Nikhil Panicker 1, Vellareddy Anantharam 1, Anumantha G Kanthasamy 1, Arthi Kanthasamy 2
Affiliations
- PMID: 27151770
- PMCID: PMC4995107
- DOI: 10.1016/j.nbd.2016.04.008
Protein kinase Cδ upregulation in microglia drives neuroinflammatory responses and dopaminergic neurodegeneration in experimental models of Parkinson's disease
Richard Gordon et al. Neurobiol Dis. 2016 Sep.
Abstract
Chronic microglial activation has been linked to the progressive degeneration of the nigrostriatal dopaminergic neurons evidenced in Parkinson's disease (PD) pathogenesis. The exact etiology of PD remains poorly understood. Although both oxidative stress and neuroinflammation are identified as co-contributors in PD pathogenesis, signaling mechanisms underlying neurodegenerative processes have yet to be defined. Indeed, we recently identified that protein kinase C delta (PKCδ) activation is critical for induction of dopaminergic neuronal loss in response to neurotoxic stressors. However, it remains to be defined whether PKCδ activation contributes to immune signaling events driving microglial neurotoxicity. In the present study, we systematically investigated whether PKCδ contributes to the heightened microglial activation response following exposure to major proinflammatory stressors, including α-synuclein, tumor necrosis factor α (TNFα), and lipopolysaccharide (LPS). We report that exposure to the aforementioned inflammatory stressors dramatically upregulated PKCδ with a concomitant increase in its kinase activity and nuclear translocation in both BV-2 microglial cells and primary microglia. Importantly, we also observed a marked upregulation of PKCδ in the microglia of the ventral midbrain region of PD patients when compared to age-matched controls, suggesting a role for microglial PKCδ in neurodegenerative processes. Further, shRNA-mediated knockdown and genetic ablation of PKCδ in primary microglia blunted the microglial proinflammatory response elicited by the inflammogens, including ROS generation, nitric oxide production, and proinflammatory cytokine and chemokine release. Importantly, we found that PKCδ activated NFκB, a key mediator of inflammatory signaling events, after challenge with inflammatory stressors, and that transactivation of NFκB led to translocation of the p65 subunit to the nucleus, IκBα degradation and phosphorylation of p65 at Ser536. Furthermore, both genetic ablation and siRNA-mediated knockdown of PKCδ attenuated NFκB activation, suggesting that PKCδ regulates NFκB activation subsequent to microglial exposure to inflammatory stimuli. To further investigate the pivotal role of PKCδ in microglial activation in vivo, we utilized pre-clinical models of PD. We found that PKCδ deficiency attenuated the proinflammatory response in the mouse substantia nigra, reduced locomotor deficits and recovered mice from sickness behavior in an LPS-induced neuroinflammation model of PD. Likewise, we found that PKCδ knockout mice treated with MPTP displayed a dampened microglial inflammatory response. Moreover, PKCδ knockout mice exhibited reduced susceptibility to the neurotoxin-induced dopaminergic neurodegeneration and associated motor impairments. Taken together, our studies propose a pivotal role for PKCδ in PD pathology, whereby sustained PKCδ activation drives sustained microglial inflammatory responses and concomitant dopaminergic neurotoxicity consequently leading to neurobehavioral deficits. We conclude that inhibiting PKCδ activation may represent a novel therapeutic strategy in PD treatment.
Keywords: Dopaminergic degeneration; Microglial activation; NFκB; Neuroinflammation; Oxidative stress; PKC delta; PKCδ; Parkinson's disease; α-Synuclein.
Copyright © 2016. Published by Elsevier Inc.
Figures
Figure 1
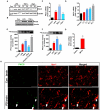
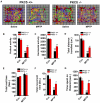
Increased PKCδ expression and kinase activity in inflammogen-activated microglia. A, PKCδ protein expression in primary microglia. Purified primary microglia were treated with LPS (100 ng/ml), TNFα (30 ng/ml), and aggregated α-synuclein (αSyn, 300 nM) for 12 and 24 h. The control group was treated with the vehicle (1x PBS) used to prepare LPS, TNFα and α-synuclein prior to treatment. PKCδ protein levels were probed by Western blotting using an antibody against the C-terminus of the protein that detects both the native and cleaved fragments. Equal loading was ascertained by tubulin. B, Increased PKCδ protein expression in inflammogen-activated BV-2 microglial cells. Immortalized BV-2 microglial cells were activated with LPS (1 μg/ml) and TNFα (30 ng/ml) for 24 h and then PKCδ protein levels were determined by Western blotting. β-actin was used as the loading control. Representative blots are shown and experiments were repeated at least three times. C, Increased PKCδ mRNA expression in primary microglia. SYBR Green real time quantitative PCR analysis for PKCδ mRNA expression in isolated primary microglial cells treated with LPS (100 ng/ml), TNFα (30 ng/ml) and aggregated α-synuclein (300 nM) for 24 h. The normalized fold increase in PKCδ gene expression over the control group was calculated by the ΔΔCt method. D, Increased PKCδ mRNA expression in BV-2 microglial cells treated with LPS (1 μg/ml) for 4, 8, 16 and 24 h. E–F, PKCδ kinase activity in activated microglia. The kinase activity of PKCδ was determined using a standard immunoprecipitation kinase assay. Primary microglia (E) and BV-2 microglial cells (F) were treated with either LPS (1 μg/ml), TNFα (30 ng/ml) or aggregated α-synuclein (300 nM) for 24 h. The PKCδ protein was immunoprecipitated from 500 μg of total protein and processed for the in vitro kinase activity assay using a histone substrate and radiolabeled [γ-32P] ATP. The kinase activity was quantified by densitometric analysis of the 32P-histone band intensity and expressed as percent control. The pure recombinant PKCδ protein was used as a positive control in primary microglia. Representative kinase assay gels are shown and kinase assays were repeated twice. G, Increased PKCδ mRNA expression in the MPTP-treated mouse ventral midbrain. H, Midbrain sections of PD patients and age-matched controls were double-labeled for Iba-1 and PKCδ. Results represent three independent experiments. Scale bar, 20 μm. Data represented as the mean ± SEM for each group. Asterisks (***p<0.001, **p<0.01 and *p<0.05) indicate significant differences between control and treatment groups.
Figure 2
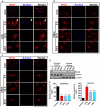
Subcellular localization of PKCδ in inflammogen-activated microglial cells. A–C, Isolated primary microglia were treated with or without LPS (100 ng/ml), TNFα (30 ng/ml) and aggregated α-synuclein (300 nM) for 3, 12 and 24 h. Cells were fixed in 4% PFA and processed for immunofluorescence staining using a rabbit polyclonal antibody to PKCδ (Red, Alexa-555). Nuclei were labeled with Hoechst stain (blue). In microglia treated with LPS (A), TNFα (B) and aggregated α-synuclein (C), stimulus- and time-dependent nuclear translocation of PKCδ was visualized by confocal microscopy. D–E, Nuclear localization of PKCδ was determined by Western blotting the cytosolic and nuclear fractions prepared from primary microglia treated for 12 h with LPS (100 ng/ml), TNFα (30 ng/ml) and aggregated α-synuclein (300 nM). Equal loading was ascertained by Lamin B (nuclear fraction) and tubulin (cytosolic fraction). F–G, Subcellular localization of PKCδ in inflammogen-activated BV-2 cells. BV-2 cells were treated with LPS (1 μg/ml, J) and TNFα (30 ng/ml, K) for 30 min, 1 and 3 h. Cells were fixed in 4% PFA and processed for immunofluorescence staining using a rabbit polyclonal antibody to PKCδ (Red, Alexa-555). Nuclei were labeled with Hoechst stain (blue). H–K, Time course of PKCδ nuclear localization was determined in the cytosolic and nuclear fractions prepared from BV-2 cells treated with LPS (1 μg/ml, H–I) and TNFα (30 ng/ml, J–K) for 1 and 3 h using Western blot analysis. Equal loading was ascertained by Lamin B and tubulin.
Figure 3
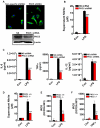
Lentiviral shRNA-mediated knockdown and genetic depletion of PKCδ attenuates LPS-induced microglial activation. A, Isolated primary microglia were transduced with lentiviral particles expressing either PKCδ shRNA or non-specific (NS) shRNA. The infection efficiency was determined by visualizing the GFP-tag co-expressed by the viral particles, and knockdown of the PKCδ native protein level was confirmed by Western blotting. B, LPS-induced nitric oxide production in shRNA-infected microglia. Primary microglia were infected with either non-specific or PKCδ shRNA virus and then treated with LPS (100 ng/ml) for 24 h. Nitric oxide levels in the supernatant were determined using the Griess reagent. PKCδ shRNA-infected primary microglial showed reduced nitrite levels in the supernatant compared to non-specific shRNA-infected microglia. C, Effect of PKCδ knockdown on LPS-induced proinflammatory cytokine production in primary microglia. Primary microglia were infected with either non-specific or PKCδ shRNA virus and treated with LPS (100 ng/ml) for 24 h, and then proinflammatory cytokines were quantified using the Luminex immunoassay system. Knockdown of PKCδ attenuated LPS-induced IL-6 and TNFα production but not IL-12 levels in the same supernatants. D, Nitric oxide production in primary microglial supernatants. Primary microglia were isolated from PKCδ wild-type (+/+) and knockout (−/−) mice treated with LPS (100 ng/ml) for 24 h, and nitric oxide production was determined indirectly by quantifying the nitrite levels in the supernatant using the Greiss reagent. Microglia isolated from PKCδ −/− mice showed significantly reduced nitric oxide production compared to +/+ microglial cells. E–F, Intracellular ROS generation in microglia. Primary microglia from PKCδ +/+ and −/− mice were treated with LPS (100 ng/ml, E) and TNFα (30 ng/ml, F) for 6 h and intracellular ROS generation was quantified using the fluorescent DCFDA dye. Microglia isolated from PKCδ −/− mice had attenuated intracellular ROS levels compared to those isolated from PKCδ +/+ mice when stimulated with either LPS or TNFα. No significant changes in ROS levels were observed in PKCδ +/+ and −/− mouse microglia stimulated with 300 nM aggregated α-synuclein (data not shown). Data represented as the group mean ± SEM (n = 4 to 8 per group). Experiments were repeated three times. Asterisks (***p<0.001 and **p<0.01) indicate significant differences between LPS-treated groups or TNFα-treated groups and “ns” denotes no significant difference.
Figure 4
Reduced cytokine and chemokine production in microglia isolated from PKCδ knockout mice in response to inflammogen stimulation. Primary microglia from PKCδ wild-type (+/+) and knockout (−/−) mice were treated with LPS (100 ng/ml, A–B) and aggregated α-synuclein (300 nM, C–E) for 24 h. Cytokine levels in the supernatant were quantified at various time points (8, 16 and 24 h) using the Luminex immunoassay system. Data represented as the group mean ± SEM (n = 4–6 per group) from two experiments run on a 32-plex assay system. Asterisks (***p<0.001, **p<0.01 and *p<0.05) indicate significant differences between LPS-treated groups or α-synuclein-treated groups from PKCδ +/+ and PKCδ −/− microglial cells.
Figure 5
PKCδ regulates inflammogen-induced activation of the NFκB signaling pathway in activated microglia. A–B, LPS- and TNFα-induced IκBα degradation in primary microglia is suppressed in PKCδ knockout microglia. Wild-type (+/+) and PKCδ knockout (−/−) microglia were treated with LPS (100 ng/ml) or TNFα (30 ng/ml). Whole-cell lysates were probed with IκBα antibody using Western blot, with equal loading ascertained by tubulin. Asterisks (*** p<0.001) indicate significant differences between LPS-treated groups or TNFα-treated groups from PKCδ +/+ and PKCδ −/− microglial cells. C–D, siRNA-mediated PKCδ knockdown suppressed LPS-induced IκBα degradation in primary microglia. For PKCδ knockdown studies, primary microglia were transfected with either scrambled or PKCδ-specific siRNA for 48 h. Transfected microglia were subsequently treated with or without LPS (100 ng/ml) for 15-60 mins. Whole-cell lysates were probed with IκBα antibody using Western blot, with equal loading ascertained by tubulin. Asterisks indicate significant differences between the respective treatment groups (** p<0.01 vs LPS-treated scrambled siRNA-transfected cells; ## p< 0.01 vs untreated scrambled siRNA-transfected cells). E–F, PKCδ +/+ and PKCδ −/− microglia were treated with or without LPS (100 ng/ml, E) and TNFα (30 ng/ml, F) for 15 minutes. For ICC studies, cells were fixed in 4% PFA and processed for immunofluorescence staining/confocal microscopy using a rabbit polyclonal antibody to p65 (Green). Nuclei were labeled with Hoechst stain (Blue). G, Non-specific siRNA- and PKCδ-specific siRNA-transfected primary microglia were treated with or without LPS (100 ng/ml) for 15-60 min. Nuclear and cytosolic extraction was then carried out and p65 nuclear translocation was quantified by Western blot analysis in both cytosolic and nuclear lysates. Lamin B and tubulin were used as loading controls for nuclear and cytosolic fractions, respectively.
Figure 6
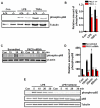
PKCδ regulates inflammogen-induced p65 phosphorylation in activated microglia. A–B, LPS- and TNFα-induced p65 phosphorylation at Serine 536 in primary microglia was suppressed in PKCδ knockout microglia. Wild-type (+/+) and PKCδ knockout (−/−) microglia were treated with or without LPS (100 ng/ml) and TNFα (30 ng/ml) for. Whole-cell lysates were probed with a phospho-p65 antibody using Western blot, with equal loading ascertained by tubulin. Asterisks (* p<0.05) indicate significant differences between LPS-treated groups or TNFα-treated groups from PKCδ +/+ and PKCδ −/− microglial cells. C–E, siRNA-mediated PKCδ knockdown (C–D) and PKCδ inhibitor, rottlerin (E), suppressed LPS-induced p65 phosphorylation in primary microglia. For knockdown studies, primary microglia were transfected with non-specific and PKCδ-specific siRNA for 48 h and then treated with or without LPS (100 ng/ml) for 15 min. For PKCδ inhibitor studies, microglia were pre-incubated for 1 h with rottlerin (2 μM) or DMSO and then stimulated with 100 ng/ml LPS for 5–30 min. Whole-cell lysates were probed with a phospho-p65 antibody using Western blot, with equal loading ascertained by β-actin or tubulin. Asterisks indicate significant differences between the respective treatment groups (** p<0.01 vs LPS-treated scrambled siRNA-transfected cells; # p< 0.05, ## p< 0.01 vs untreated scrambled siRNA-transfected cells).
Figure 7
PKCδ knockout mice have reduced nigral proinflammatory cytokines and are resistant to LPS-induced endotoxemia. A, Representative maps (VersaPlot) of vertical rearing activity (red circles) and horizontal movement tracks of saline- and LPS-injected mice. Age-matched PKCδ WT (+/+) and KO (−/−) mice were injected with a single dose of LPS (5 mg/kg, i.p.) or equivalent volumes of saline and their behavioral activity was assessed 48 h later using the VersaMax Analyzer. LPS-injected PKCδ −/− mice exhibit near normal locomotor activity similar to saline-injected controls (lower panel). In comparison, +/+ mice showed typical symptoms of endotoxemia and lethargic movement (top panel). B, Total horizontal movements and C, Total vertical activity of saline- and LPS-injected mice quantified using the VersaMax Analyzer at 48 h showing significantly improved activity in PKCδ −/−. D, Rotarod performance. At 48 h after LPS (5 mg/kg) treatment, LPS-injected PKCδ −/− mice spent more time on the rotarod compared to +/+ mice. Data represented as the group mean ± SEM from 6 to 8 mice. Experiments were repeated three times. Asterisks (***p<0.001 and ** p<0.01) indicate significant differences between LPS-treated groups from PKCδ +/+ and PKCδ −/− mice. ## denotes p<0.001 compared to saline-injected mice. E, Real-time SYBR green qRT-PCR for nigral pro-inflammatory cytokines. PKCδ +/+ and −/− mice were injected with 5 mg/kg LPS (ip) and proinflammatory cytokine gene expression was determined by real-time PCR at 48 h. Levels of IL-12 were elevated following LPS stimulation in PKCδ +/+ mice but were significantly reduced in PKCδ −/− mice. Data represented as the group mean ± SEM (n = 4 mice per group). Experiments were repeated at least three times. Asterisks (** p<0.01) indicate significant differences between LPS-treated groups from PKCδ +/+ and PKCδ −/− mice. # p<0.01 denotes significant differences between LPS- and saline-treated +/+ groups.
Figure 8
PKCδ knockout mice are protected against MPTP-induced locomotor deficits. A, VersaPlot movement track of mice. Locomotor activity was analyzed 5 days after MPTP treatment in PKCδ wild-type (+/+) and knockout (−/−) mice using VersaMax Analyzer. Representative horizontal movement tracks (VersaPlot) and vertical rearing events (red circles) of the mice collected over 10 min were plotted for a single mouse from each group. B–F, Quantification of locomotor activity using the VersaMax Analyzer. Saline- or MPTP-treated mice were placed in the VersaMax monitor for 10 min and various locomotor activity parameters were measured simultaneously. PKCδ −/− mice showed significantly improved vertical activity (B), horizontal activity (C), total distance travelled (D), total rest time (E) and total movement time (F). G, Rotarod performance analysis was performed 5 days after MPTP treatment and the amount of time spent on the rotarod was measured in PKCδ +/+ and −/− mice. Data represented as the mean ± SEM of six mice per group. Asterisks (** p< 0.01 and * p<0.05) denote significant differences between MPTP-treated +/+ and PKCδ −/− mice; # p< 0.01 and ## p< 0.001 denote significant differences between saline- and MPTP-treated +/+ groups. “ns”, not significant.
Figure 9
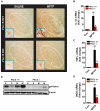
PKCδ knockout mice have reduced microglial activation and proinflammatory responses in the MPTP model of dopaminergic degeneration. A, Immunocytochemistry for Iba1-positive microglia in nigral brain sections. Ventral midbrain sections from 24-h MPTP-treated PKCδ wild-type (+/+) and knockout (−/−) mice were stained for the microglial marker Iba1 using DAB immunohistochemistry. Images were captured at 10× and 20× (inserts) magnification. The nigral zone is outlined for each field (white ellipses). Extensive microglial activation is evident in MPTP-treated +/+ mice whereas PKCδ −/− mice had reduced Iba1 staining. B–D, Quantitative real-time PCR for pro-inflammatory cytokines in MPTP-treated nigral tissues. Age-matched PKCδ +/+ and −/− mice were injected with 4 doses of MPTP (18 mg/kg) or saline at 2-h intervals. Nigral tissues were dissected 24 h after the last injection and mRNA levels for TNFα, IL-1β and iNOS were determined by real-time SYBR green quantitative RT-PCR. The 18S rRNA gene was used as the internal control and the data are expressed as fold change over the saline-treated group. Data represented as the group mean ± SEM (n = 4 mice per group). Experiments were repeated twice. E, Western blot for gp-91phox. Nigral tissues from PKCδ +/+ and −/− mice were dissected 24 h after the last injection of either saline (S) or MPTP (M). Lysates were probed by Western blotting for gp91phox, the membrane-bound subunit of the NADPH-oxidase complex, using a mouse monoclonal antibody; β-actin was used as a loading control. A representative blot is shown and experiments were repeated three times. Asterisks (* p<0.05 and ** p<0.01) indicate significant differences between MPTP-treated groups from PKCδ +/+ and PKCδ −/− mice. ## p<0.001 denotes significant differences between saline- and MPTP-treated +/+ groups.
Figure 10
PKCδ knockout mice are protected against MPTP-induced nigrostriatal dopaminergic degeneration. A, DAB immunohistochemistry for tyrosine hydroxylase (TH) in substantia nigral and striatal sections. Mice were perfused 7 days after MPTP dosing, 30-μm sections were processed for TH-DAB immunostaining and SNpc images were captured at 2× and 20× (middle panel) magnification. Striatal sections were imaged at 2X magnification. Representative images are shown and experiments were repeated three times. B, Stereological counting of TH-positive neurons in the substantia nigra. The number of surviving TH-positive dopaminergic neurons in MPTP-treated PKCδ wild-type (+/+) and knockout (−/−) mice at 7 days was counted using unbiased stereological analysis as described in Methods. After MPTP treatment, PKCδ −/− mice had a significantly more TH-positive dopaminergic neurons than did +/+ mice. C–E, HPLC analysis of striatal dopamine and its metabolites. PKCδ +/+ and −/− mice were treated with 4 doses of MPTP (18 mg/kg) or saline at 2-h intervals and were sacrificed 7 days after the last injection. The levels of striatal dopamine and its metabolites DOPAC and HVA were determined by HPLC. After MPTP treatment, PKCδ −/− mice had significantly higher levels of dopamine, DOPAV and HVA. Data represented as the mean ± SEM of 6 to 7 mice per group. Asterisks indicate significant differences between the respective treatment groups (* p<0.05 and *** p< 0.001 vs +/+ MPTP; ## p< 0.001 vs +/+ Control).
Similar articles
- Fyn Kinase Regulates Microglial Neuroinflammatory Responses in Cell Culture and Animal Models of Parkinson's Disease.
Panicker N, Saminathan H, Jin H, Neal M, Harischandra DS, Gordon R, Kanthasamy K, Lawana V, Sarkar S, Luo J, Anantharam V, Kanthasamy AG, Kanthasamy A. Panicker N, et al. J Neurosci. 2015 Jul 8;35(27):10058-77. doi: 10.1523/JNEUROSCI.0302-15.2015. J Neurosci. 2015. PMID: 26157004 Free PMC article. - Proteolytic activation of proapoptotic kinase protein kinase Cδ by tumor necrosis factor α death receptor signaling in dopaminergic neurons during neuroinflammation.
Gordon R, Anantharam V, Kanthasamy AG, Kanthasamy A. Gordon R, et al. J Neuroinflammation. 2012 Apr 27;9:82. doi: 10.1186/1742-2094-9-82. J Neuroinflammation. 2012. PMID: 22540228 Free PMC article. - Apocyanin, a Microglial NADPH Oxidase Inhibitor Prevents Dopaminergic Neuronal Degeneration in Lipopolysaccharide-Induced Parkinson's Disease Model.
Sharma N, Nehru B. Sharma N, et al. Mol Neurobiol. 2016 Jul;53(5):3326-3337. doi: 10.1007/s12035-015-9267-2. Epub 2015 Jun 17. Mol Neurobiol. 2016. PMID: 26081143 - Inflammation in Parkinson's diseases and other neurodegenerative diseases: cause and therapeutic implications.
Wilms H, Zecca L, Rosenstiel P, Sievers J, Deuschl G, Lucius R. Wilms H, et al. Curr Pharm Des. 2007;13(18):1925-8. doi: 10.2174/138161207780858429. Curr Pharm Des. 2007. PMID: 17584117 Review. - Pathological α-synuclein exacerbates the progression of Parkinson's disease through microglial activation.
Zhang QS, Heng Y, Yuan YH, Chen NH. Zhang QS, et al. Toxicol Lett. 2017 Jan 4;265:30-37. doi: 10.1016/j.toxlet.2016.11.002. Epub 2016 Nov 16. Toxicol Lett. 2017. PMID: 27865851 Review.
Cited by
- Roles for c-Abl in postoperative neurodegeneration.
Feng L, Fu S, Yao Y, Li Y, Xu L, Zhao Y, Luo L. Feng L, et al. Int J Med Sci. 2022 Sep 28;19(12):1753-1761. doi: 10.7150/ijms.73740. eCollection 2022. Int J Med Sci. 2022. PMID: 36313229 Free PMC article. Review. - Manganese exposure induces neuroinflammation by impairing mitochondrial dynamics in astrocytes.
Sarkar S, Malovic E, Harischandra DS, Ngwa HA, Ghosh A, Hogan C, Rokad D, Zenitsky G, Jin H, Anantharam V, Kanthasamy AG, Kanthasamy A. Sarkar S, et al. Neurotoxicology. 2018 Jan;64:204-218. doi: 10.1016/j.neuro.2017.05.009. Epub 2017 May 21. Neurotoxicology. 2018. PMID: 28539244 Free PMC article. - Nucleotide transmitters ATP and ADP mediate intercellular calcium wave communication via P2Y12/13 receptors among BV-2 microglia.
Jiang P, Xing F, Guo B, Yang J, Li Z, Wei W, Hu F, Lee I, Zhang X, Pan L, Xu J. Jiang P, et al. PLoS One. 2017 Aug 11;12(8):e0183114. doi: 10.1371/journal.pone.0183114. eCollection 2017. PLoS One. 2017. PMID: 28800362 Free PMC article. - PKCδ serves as a potential biomarker and therapeutic target for microglia-mediated neuroinflammation in Alzheimer's disease.
Du Y, Guo T, Hao Y, Li C, Tang L, Li X, Zhang X, Li L, Yao D, Xu X, Si H, Zhang J, Zhao N, Yu T, Zhao Y, Zhang W, Xu H. Du Y, et al. Alzheimers Dement. 2024 Aug;20(8):5511-5527. doi: 10.1002/alz.14047. Epub 2024 Jun 28. Alzheimers Dement. 2024. PMID: 38938161 Free PMC article. - Fyn Kinase-Mediated PKCδ Y311 Phosphorylation Induces Dopaminergic Degeneration in Cell Culture and Animal Models: Implications for the Identification of a New Pharmacological Target for Parkinson's Disease.
Saminathan H, Ghosh A, Zhang D, Song C, Jin H, Anantharam V, Kanthasamy A, Kanthasamy AG. Saminathan H, et al. Front Pharmacol. 2021 Apr 28;12:631375. doi: 10.3389/fphar.2021.631375. eCollection 2021. Front Pharmacol. 2021. PMID: 33995031 Free PMC article.
References
- Almodovar AJ, et al. Genomic structure and genetic drift in C57BL/6 congenic metabolic mutant mice. Mol Genet Metab. 2013;110:396–400. - PubMed
- Beitz JM. Parkinson's disease: a review. Front Biosci (Schol Ed) 2014;6:65–74. - PubMed
Publication types
MeSH terms
Substances
Grants and funding
- R01 ES010586/ES/NIEHS NIH HHS/United States
- R01 NS065167/NS/NINDS NIH HHS/United States
- R01 NS078247/NS/NINDS NIH HHS/United States
- R01 NS088206/NS/NINDS NIH HHS/United States
LinkOut - more resources
Full Text Sources
Other Literature Sources
Medical
Molecular Biology Databases
