Oxidative metabolism drives inflammation-induced platinum resistance in human ovarian cancer - PubMed (original) (raw)
. 2016 Sep 1;23(9):1542-54.
doi: 10.1038/cdd.2016.39. Epub 2016 May 20.
M R Amoroso 1, H Lu 2, R Avolio 1, D Arzeni 1, C Procaccini 3, D Faicchia 4, F Maddalena 5, V Simeon 5, I Agliarulo 1, E Zanini 2, C Mazzoccoli 5, C Recchi 2, E Stronach 6, G Marone 4, H Gabra 6, G Matarese 1, M Landriscina 5 7, F Esposito 1
Affiliations
- PMID: 27206315
- PMCID: PMC5072430
- DOI: 10.1038/cdd.2016.39
Oxidative metabolism drives inflammation-induced platinum resistance in human ovarian cancer
D S Matassa et al. Cell Death Differ. 2016.
Abstract
Tumour cells have long been considered defective in mitochondrial respiration and mostly dependent on glycolytic metabolism. However, this assumption is currently challenged by several lines of evidence in a growing number of tumours. Ovarian cancer (OC) is one of the most lethal cancers worldwide, but it continues to be a poorly understood disease and its metabolic features are far to be elucidated. In this context, we investigated the role of tumour necrosis factor receptor-associated protein 1 (TRAP1), which is found upregulated in several cancer types and is a key modulator of tumour cell metabolism. Surprisingly, we found that TRAP1 expression inversely correlated with grade, stage and lower survival in a large cohort of OC patients. Accordingly, TRAP1 silencing induced resistance to cisplatin, resistant cells showed increased oxidative metabolism compared with their sensitive counterpart, and the bioenergetics cellular index of higher grade tumours indicated increased mitochondrial respiration. Strikingly, cisplatin resistance was reversible upon pharmacological inhibition of mitochondrial oxidative phosphorylation by metformin/oligomycin. At molecular level, increased oxidative metabolism in low TRAP1-expressing OC cells and tissues enhanced production of inflammatory mediators such as interleukin (IL)-6 and IL-8. Mechanistically, we identified members of the multidrug resistance complex (MDR) as key mediators of such metabolism-driven, inflammation-induced process. Indeed, treatment of OC cell lines with TNFα and IL6 induced a selective increase in the expression of TAP1 and multidrug resistance protein 1, whereas TAP1 silencing sensitized cells to cisplatin-induced apoptosis. Our results unveil a novel role for TRAP1 and oxidative metabolism in cancer progression and suggest the targeting of mitochondrial bioenergetics to increase cisplatin efficacy in human OC.
Figures
Figure 1
Lower TRAP1 expression is associated with more advanced disease. (a) Correlation between TRAP1 mRNA expression and tumour stage from the Tothill data set (_P_-values determined by the Kruskal–Wallis test). (b) Correlation between TRAP1 mRNA expression and tumour grade from the Tothill data set (_P_-values determined by the Wilcoxon rank sum test). (c) Kaplan–Meier estimates of the impact of TRAP1 on PFS (_P_-values determined by the log-rank test). (d) Total lysates obtained from PEA1-sensitive and PEA2-resistant cells were separated by SDS-PAGE and immunoblotted with the indicated antibodies. Images are representative of three independent experiments. (e) Real-time RT-PCR analysis of TRAP1 mRNAs expression in PEA1-sensitive and PEA2-resistant cells. Data are expressed as mean±S.E.M. from three independent experiments with technical triplicates each. Numbers above bars indicate the statistical significance (_P_-value), based on the two-tailed Student's _t_-test
Figure 2
Drug resistance and tumour grade are associated with cell metabolism in OC. (a) BEC index analysis on PEA1 and PEA2 cells upon TRAP1 silencing. Where indicated, cells were transfected with TRAP1-directed or control siRNAs; 72 h after transfection, cells were harvested and total protein lysates were immunoblotted with anti-_β_F1ATPase, anti-HSP60 and anti-GAPDH antibodies. Immunoreactive bands were quantified by using ImageJ and BEC index was calculated by the formula F1ATPase/HSP60/GAPDH (see Material and Methods section for details). Data are expressed as mean±S.E.M. from five independent experiments. Numbers above bars indicate the statistical significance (_P_-value), based on the two-tailed Student's _t_-test. (b) Total lysates obtained by a set of OC tissues (_n_=47) were analyzed by WB analysis for BEC index calculation as described in panel (a). The resulting BEC index values were normalized on a reference sample and correlated to clinical parameters of each sample. (c) Kaplan–Meier estimates of the impact of TRAP1 on Overall Survival (_P_-values determined by the log-rank test)
Figure 3
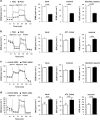
Modulation of TRAP1 expression causes metabolic shift in OC cells. (a and b) Kinetic profile of ECAR and OCR in PEA1 and PEA2 cells was measured in real-time, under basal conditions and in response to glucose, oligomycin and 2-DG for ECAR (panel a), and in response to mitochondrial drugs oligomycin, FCCP, Antimycin A and Rotenone for OCR (panel b). Indices of glycolytic pathway activation, calculated from PEA1 and PEA2 cells ECAR profile: basal ECAR, maximal ECAR and glycolytic capacity (see also Materials and Methods section). Indices of mitochondrial respiratory function, calculated from PEA1 and PEA2 cells OCR profile: basal OCR, ATP-linked OCR and maximal OCR (see also Materials and Methods section). For each profile is shown one representative out of three independent experiments. Data are expressed as mean±S.E.M. of three measurements, each of them in triplicates. (c and d) Kinetic profile of ECAR and OCR in PEA1 cells transfected with non-targeted control siRNA or TRAP1-directed siRNA was measured as described for PEA1 and PEA2 cells. For each profile, one representative out of three independent experiments is shown. Data are expressed as mean±S.E.M. of three measurements, each of them in triplicates. (Statistical analysis by two-tailed Mann–Whitney test)
Figure 4
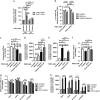
Glycolysis is decreased in resistant cells but not affected by TRAP1. (a and b) Total lysates obtained from PEA1-sensitive and PEA2-resistant cells (a) or from PEA1 cells transfected for 72 h with non-targeted control siRNA or TRAP1-directed siRNA (b), were separated by SDS-PAGE and immunoblotted with the indicated antibodies. Numbers indicate densitometric band intensities, calculated by assuming protein levels of the control equal 1. Images are representative of three independent experiments. (c) PFK1 activity was measured by a colorimetric assay in PEA1-sensitive and PEA2-resistant cells and in PEA1 cells transfected for 72 h with non-targeted control siRNA or TRAP1-directed siRNA. Data are expressed as mean±S.E.M. from three independent experiments with technical triplicates each. Numbers above bars indicate the statistical significance (_P_-value), based on the two-tailed Student's _t_-test. (d) Viability assays performed by MTT in PEA1 and PEA2 cells cultured in complete medium or in low-glucose medium for 72 h. Absorbance was measured at 570 nm by subtracting background values at 690 nm. Data are expressed as mean±S.E.M. from four independent experiments with technical triplicates each. Numbers above bars indicate the statistical significance (_P_-value), based on the two-tailed Student's _t_-test
Figure 5
Cisplatin resistance in OC cells is mediated by oxidative metabolism. (a) PEA1 cells were transfected with non-targeted control siRNA or TRAP1-directed siRNA. Seventy-two hours after transfection, cells were placed in high-glucose (4.5 g/l) or low-glucose (1 g/l) medium and, after 1 h, further treated for 24 h with 20 _μ_M cisplatin. Subsequently, apoptosis was measured by a luminescent caspase 3/7 activity assay. Data are expressed as mean ± S.E.M. from four independent experiments with technical triplicates each. (b) PEA1 cells were transfected with non-targeted control siRNA or TRAP1-directed siRNA. Seventy-two hours after transfection, cells were treated for 24 h with 20 _μ_M cisplatin, 10 mM metformin or both. Subsequently, cell viability was measured by MTT assay. Data are expressed as mean ± S.E.M. from three independent experiments with technical triplicates each. (c and d) PEA2 cells were treated with 40 _μ_M cisplatin, 10 mM metformin or both for 24 h, then cell viability was measured by MTT assay (c) and apoptosis was measured by a luminescent caspase 3/7 activity assay (d). See also Supplementary Figure S1. Data are expressed as mean ± S.E.M. from four independent experiments with technical triplicates each. (e and f) PEA1 cells were treated with 20 _μ_M cisplatin, 1.2 _μ_M FCCP or both for 24 h, then apoptosis was measured by caspase 3/7 activity luminescent assay (e) and their viability was assessed by MTT assay (f). Data are expressed as mean ± S.E.M. from five independent experiments with technical triplicates each. (g and h) Cells were pretreated for 1 h with NAC 1 mM, then treated with 20 _μ_M (PEA1) or 40 _μ_M cisplatin (PEA2) after NAC washout. After 24 h, cell viability was measured by MTT assay (g) and apoptosis was measured by a luminescent caspase 3/7 activity assay (h). Data are expressed as mean ± S.E.M. from four (PEA1-PEA2) or six independent experiments (sh-control and sh-TRAP1 PEA1 cells) with technical triplicates each. In all panels, numbers above bars indicate the statistical significance (_P_-value), based on the two-tailed Student's _t-_test
Figure 6
Metabolic remodelling of PEA1 cells elicits inflammatory response. (a) Pathway activity analysis (2000–2014 Ingenuity Systems, Inc.), representing the eight canonical pathways most differentially regulated in PEA1 cells upon Glucose deprivation (6 h). Orange bars or blue bars predict an increase or decrease in a pathway's activity, respectively. Log (_P_-value) indicates statistical significance of selected pathway, z-score is used to infer the activation states of predicted pathways, and ratio indicates percentage of genes in analysis compared with the whole pathway gene list (see also Supplementary Table S1). (b) Real-time RT-PCR analysis of expression of 11 selected genes belonging to the glucocorticoid receptor signalling or the aryl hydrocarbon receptor signalling, following 6 h of glucose deprivation, upon siRNA-mediated TRAP1 silencing, and following 6 h of FCCP treatment in PEA1 cells (see also Supplementary Table S2). All data are expressed as mean ± S.E.M. from four independent experiments with technical triplicates each. Numbers above bars indicate the statistical significance (_P_-value), based on the one-sample _t-_test. Solid line indicate expression level of the relative control. (c) Correlation between TRAP1 expression and IL6, MAP2K2 and PLAU mRNA expression in TCGA data set. _P_-values determined by the Pearson's product moment correlation coefficient. See also Supplementary Table S3
Figure 7
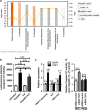
Activation of inflammatory pathways is responsible for cisplatin resistance. (a) Pathway activity analysis (2000–2014 Ingenuity Systems, Inc.), representing the eight canonical pathways most differentially regulated in PEA2/PEO4/PEO23 resistant cells in comparison with their matched sensitive counterparts. Orange bars or blue bars predict an increase or decrease in a pathway's activity, respectively. Log (_P_-value) indicates statistical significance of selected pathway, z-score is used to infer the activation states of predicted pathways, and ratio indicates percentage of genes in analysis compared with the whole pathway gene list. (b) PEA1 cells were treated with 20 _μ_M cisplatin in the presence/absence of human IL6 (200 U/ml) for 24 h, then apoptosis was measured by caspase 3/7 activity luminescent assay. Data are expressed as mean±S.E.M. from four independent experiments with technical triplicates each. Numbers above bars indicate the statistical significance (_P_-value), based on the two-tailed Student's t_-test. (c) Real-time RT-PCR analysis of MDR1 and TAP1 expression in PEA1 cells 72 h after transfection with non-targeted control siRNA or TRAP1-directed siRNA or after 6-h treatment with human IL6 (200 U/ml) or both TNF_α (20 ng/ml) and IL6. Data are expressed as mean±S.E.M. from three independent experiments with technical triplicates each. Numbers above bars indicate the statistical significance (_P_-value), based on one-sample _t_-test. Solid line indicate expression level of the relative control. (d) PEA1 and PEA2 cells were transfected with non-targeted control siRNA or TAP1-directed siRNA. Seventy-two hours, cells were treated for 24 h with 20 _μ_M cisplatin (PEA1) or 40 _μ_M cisplatin (PEA2). Subsequently, apoptosis was measured by a luminescent caspase 3/7 activity assay. Data are expressed as mean±S.E.M. from three independent experiments with technical triplicates each. Numbers above bars indicate the statistical significance (_P_-value), based on the two-tailed Student's _t_-test
Figure 8
A model for the OXPHOS-mediated activation of survival pathways in low versus high TRAP1-expressing ovarian tumour cells following clinically acquired platinum resistance. Cells expressing low TRAP1 levels have increased OXPHOS activity, which is usually escaped by cancer cells in order to pursue the advantages of aerobic glycolysis. However, OC is characterized by an autocrine production of ILs and cytokines, mainly produced by immune cells, whose expression is stimulated by OXPHOS through an unknown mechanism. This elicits an inflammatory response, which is responsible for resistance to cisplatin
Similar articles
- Stress-Adaptive Response in Ovarian Cancer Drug Resistance: Role of TRAP1 in Oxidative Metabolism-Driven Inflammation.
Amoroso MR, Matassa DS, Agliarulo I, Avolio R, Maddalena F, Condelli V, Landriscina M, Esposito F. Amoroso MR, et al. Adv Protein Chem Struct Biol. 2017;108:163-198. doi: 10.1016/bs.apcsb.2017.01.004. Epub 2017 Feb 12. Adv Protein Chem Struct Biol. 2017. PMID: 28427560 Review. - TRAP1 downregulation in human ovarian cancer enhances invasion and epithelial-mesenchymal transition.
Amoroso MR, Matassa DS, Agliarulo I, Avolio R, Lu H, Sisinni L, Lettini G, Gabra H, Landriscina M, Esposito F. Amoroso MR, et al. Cell Death Dis. 2016 Dec 15;7(12):e2522. doi: 10.1038/cddis.2016.400. Cell Death Dis. 2016. PMID: 27977010 Free PMC article. - Cholesterol Homeostasis Modulates Platinum Sensitivity in Human Ovarian Cancer.
Criscuolo D, Avolio R, Calice G, Laezza C, Paladino S, Navarra G, Maddalena F, Crispo F, Pagano C, Bifulco M, Landriscina M, Matassa DS, Esposito F. Criscuolo D, et al. Cells. 2020 Mar 30;9(4):828. doi: 10.3390/cells9040828. Cells. 2020. PMID: 32235572 Free PMC article. - Overcoming cisplatin resistance of ovarian cancer cells by targeting HIF-1-regulated cancer metabolism.
Ai Z, Lu Y, Qiu S, Fan Z. Ai Z, et al. Cancer Lett. 2016 Apr 1;373(1):36-44. doi: 10.1016/j.canlet.2016.01.009. Epub 2016 Jan 19. Cancer Lett. 2016. PMID: 26801746 Free PMC article. - Heat shock proteins, cell survival and drug resistance: the mitochondrial chaperone TRAP1, a potential novel target for ovarian cancer therapy.
Landriscina M, Amoroso MR, Piscazzi A, Esposito F. Landriscina M, et al. Gynecol Oncol. 2010 May;117(2):177-82. doi: 10.1016/j.ygyno.2009.10.078. Epub 2009 Nov 25. Gynecol Oncol. 2010. PMID: 19942270 Review.
Cited by
- Oxidative Phosphorylation: A Target for Novel Therapeutic Strategies Against Ovarian Cancer.
Nayak AP, Kapur A, Barroilhet L, Patankar MS. Nayak AP, et al. Cancers (Basel). 2018 Sep 18;10(9):337. doi: 10.3390/cancers10090337. Cancers (Basel). 2018. PMID: 30231564 Free PMC article. Review. - TRAP1 Regulation of Cancer Metabolism: Dual Role as Oncogene or Tumor Suppressor.
Matassa DS, Agliarulo I, Avolio R, Landriscina M, Esposito F. Matassa DS, et al. Genes (Basel). 2018 Apr 5;9(4):195. doi: 10.3390/genes9040195. Genes (Basel). 2018. PMID: 29621137 Free PMC article. Review. - Targeting oxidative phosphorylation as an approach for the treatment of ovarian cancer.
Wu Y, Zhang X, Wang Z, Zheng W, Cao H, Shen W. Wu Y, et al. Front Oncol. 2022 Sep 6;12:971479. doi: 10.3389/fonc.2022.971479. eCollection 2022. Front Oncol. 2022. PMID: 36147929 Free PMC article. Review. - Ovarian cancer cells regulate their mitochondrial content and high mitochondrial content is associated with a poor prognosis.
Weigelt J, Petrosyan M, Oliveira-Ferrer L, Schmalfeldt B, Bartmann C, Dietl J, Stürken C, Schumacher U. Weigelt J, et al. BMC Cancer. 2024 Jan 8;24(1):43. doi: 10.1186/s12885-023-11667-8. BMC Cancer. 2024. PMID: 38191325 Free PMC article. - Metabolic Dysregulations and Epigenetics: A Bidirectional Interplay that Drives Tumor Progression.
Crispo F, Condelli V, Lepore S, Notarangelo T, Sgambato A, Esposito F, Maddalena F, Landriscina M. Crispo F, et al. Cells. 2019 Jul 30;8(8):798. doi: 10.3390/cells8080798. Cells. 2019. PMID: 31366176 Free PMC article. Review.
References
- Tan AS, Baty JW, Dong LF, Bezawork-Geleta A, Endaya B, Goodwin J et al. Mitochondrial genome acquisition restores respiratory function and tumorigenic potential of cancer cells without mitochondrial DNA. Cell Metab 2015; 21: 81–94. - PubMed
MeSH terms
Substances
LinkOut - more resources
Full Text Sources
Other Literature Sources
Medical
Molecular Biology Databases
Research Materials
Miscellaneous


