The polycystin complex mediates Wnt/Ca(2+) signalling - PubMed (original) (raw)
. 2016 Jul;18(7):752-764.
doi: 10.1038/ncb3363. Epub 2016 May 23.
Affiliations
- PMID: 27214281
- PMCID: PMC4925210
- DOI: 10.1038/ncb3363
The polycystin complex mediates Wnt/Ca(2+) signalling
Seokho Kim et al. Nat Cell Biol. 2016 Jul.
Abstract
WNT ligands induce Ca(2+) signalling on target cells. PKD1 (polycystin 1) is considered an orphan, atypical G-protein-coupled receptor complexed with TRPP2 (polycystin 2 or PKD2), a Ca(2+)-permeable ion channel. Inactivating mutations in their genes cause autosomal dominant polycystic kidney disease (ADPKD), one of the most common genetic diseases. Here, we show that WNTs bind to the extracellular domain of PKD1 and induce whole-cell currents and Ca(2+) influx dependent on TRPP2. Pathogenic PKD1 or PKD2 mutations that abrogate complex formation, compromise cell surface expression of PKD1, or reduce TRPP2 channel activity suppress activation by WNTs. Pkd2(-/-) fibroblasts lack WNT-induced Ca(2+) currents and are unable to polarize during directed cell migration. In Xenopus embryos, pkd1, Dishevelled 2 (dvl2) and wnt9a act within the same pathway to preserve normal tubulogenesis. These data define PKD1 as a WNT (co)receptor and implicate defective WNT/Ca(2+) signalling as one of the causes of ADPKD.
Figures
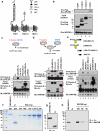
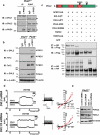
Figure 1. WNT9B binds to the extracellular domain of PKD1
(a) Membrane topology of full length PKD1, PKD1L1, and TRPC1. (b) Interaction of Flag-tagged PKD1 (F-PKD1), but not bacterial alkaline phosphatase (F-BAP), F-PKD1L1, or F-TRPC1 and WNT9B in lysates of transfected HEK293T cells. (c) Interaction of WNT9B and the LRR-WSC domain of PKD1 fused to Fc in conditioned media of co-transfected HEK293T cells. Mouse FZD8-CRD-Fc was used as positive control. (d) Interaction of WNT9B with the LRR-WSC domain of PKD1 fused to Fc in conditioned media in trans using co-cultures of HEK293T cells singly transfected with plasmids carrying Fc fusions or WNT9B. Red or blue arrow heads indicate Fc fusions or WNT9B, respectively. In upper panel, Fc fusions were non-specifically labeled (indicated by red arrow heads) by the secondary bovine α-goat used to detect α-WNT9B. (e) Interaction of WNT9B with a minimal domain in PKD1 containing the C-terminal cysteine rich domain of the LRR and WSC domain (LRR-CT+WSC) in conditioned media of co-transfected HEK293T cells. (f-h) Interaction of WNT9B with the LRR-WSC domain of PKD1 using purified proteins. (f) Coomassie blue staining showing the purification of LRR-WSC-Fc or Fc from the conditioned media of stably transfected HEK293 cells. (g) Western blotting of purified Fc fusions using α-Fc. (h) 390 ng of purified LRR-WSC-Fc or Fc were incubated with 500 ng/ml purified WNT9B. Fc fusions were pulled down with protein G and immunocomplexes were blotted with α-WNT9B. 87 ng of WNT9B bound to 390 ng of LRR-WSC-Fc (lane 1). 120, 60, or 30 ng of purified WNT9B were used as reference points. Experiments were successfully repeated 2 (b,d,f,g,h) or 5 (c,e) times. Unprocessed blots are shown in Supplementary Fig. 8.
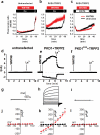
Figure 2. WNT9B activates PKD1/TRPP2
Time course of WNT9B-induced Δ[Ca2+]i (shown as fluorescence ratio 340/380) in untransfected (a, red, n=52 cells pooled from 3 independent experiments) or PKD1/TRPP2 co-transfected CHO-K1 cells (b, red, n=30 cells pooled from 5 independent experiments) in 1.8 mM extracellular Ca2+. Ionomycin (I, 2 μM) was added at time point 35 min. (c) Time course of WNT9B-induced Δ[Ca2+]i in PKD1/TRPP2 co-transfected CHO-K1 cells (red, n=65 cells pooled from 5 independent experiments) in Ca2+ free extracellular solution (10 μM EGTA). Δ[Ca2+]i in PBS-treated cells in all three conditions is shown in black. (d-l) Time course (d-f), step currents (g-i), or I-V curves of WNT9B (500 ng/ml)-induced whole cell currents in untransfected (d,g,j), PKD1/TRPP2 co-transfected (e,h,k) or PKD1S99I/TRPP2-co-transfected CHO-K1 cells (f,i,l) in 50 nM intracellular Ca2+ concentration. La3+ (100 μM) was added at the indicated times. I-V curves were taken before (black) and 5 min after (red) the addition of WNT9B in the bath solution of untransfected (j, n=6 cells pooled from 2 independent experiments), PKD1/TRPP2- (k, n=12 cells pooled from 4 independent experiments), or PKD1S99I/TRPP2-co-transfected CHO-K1 cells (l, n=6 cells pooled from 4 independent experiments). Representative time courses (d-f) and step currents (g-i) from 6 (untransfected), 12 (PKD1+TRPP2), or 6 (PKD1S99I+TRPP2) cells. All statistical tests were performed using paired Student's t-test, **P<0.01. Data are shown as mean ± SEM.
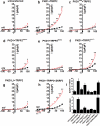
Figure 3. Pathogenic mutations in PKD1 or TRPP2 suppress activation by WNT9B
(a-h) I-V curves taken before (black) and 5 min after the addition of WNT9B (500 ng/ml) in the bath solution (red) of untransfected (a, n=5 cells pooled from 2 independent experiments), PKD1/TRPP2- (b, n=8 cells from 3 independent experiments), or PKD1S99I/TRPP2- (c, n=7 cells from 3 independent experiments), PKD1/TRPP2D511V- (d, n=11 from 4 independent experiments), PKD1/TRPP2R872X- (e, n=7 cells from 3 independent experiments), PKD1/TRPP2Kv1.3- (f, n=12 cells from 5 independent transfections), PKD1L1/TRPP2- (g, n=9 cells from 5 independent experiments), or PKD1/TRPP2/ZNRF3- (h, n=11 cells pooled from 3 independent transfections) co-transfected CHO-K1 cells in zero intracellular Ca2+. (i) Summary data of inward (−100 mV) or outward currents (+100 mV) from all groups. Differences between current densities before and after WNT9B for any given membrane potential in I-V curves were determined using paired Student's t-test, *P<0.05, **P<0.01. Data are shown as mean ± SEM.
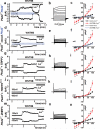
Figure 4. TRPP2 mediates WNT9B-induced whole cell currents in MEFs
(a-c) Time course (a), step currents (b), and I-V curves of WNT9B-induced whole cell currents in 50 nM intracellular Ca2+ (c, n=7 cells pooled from 3 independent experiments), before (Cont-Pkd2+/+) or after WNT9B (500 ng/ml, WNT9B-Pkd2+/+) in wild type Pkd2+/+ MEFs. Time course of WNT9B-induced currents in Pkd2−/− MEFs is shown as open blue circles in (a), whereas I-V curves are shown as open black (Cont-Pkd2−/−) and open blue circles (WNT9B-Pkd2−/−) in (c) (n=6 cells from 3 independent experiments). (d-l) Time course, step currents, and I-V curves of WNT9B-induced whole cell currents in zero intracellular Ca2+ in mock- transfected (just CD8α) (d-f, n=6 cells from 3 independent experiments), wild type TRPP2- transfected (g-i, n=12 cells from 5 experiments), or TRPP2Kv1.3- transfected Pkd2−/− cells (j-l, n=5 cells pooled from 3 independent experiments). Time course and I-V curves of WNT9B-induced currents in zero intracellular Ca2+ in Pkd2−/− cells is shown as open blue circles in (d) and (f, n=6 cells pooled from 3 independent experiments). (m-o) Time course, step currents, and I-V curves of WNT9B-induced whole cell currents in zero intracellular Ca2+ in ZNRF3-transfected Pkd2+/+ MEFs (n=12 cells pooled from 4 independent experiments). Step currents are shown 5 min after the addition of WNT9B (500 ng/ml) in the bath solution. I-V curves were taken before (black) and 5 min after the addition of WNT9B (red). Differences between current densities before and after WNT9B for any given membrane potential in I-V curves were determined using paired Student's t-test, *P<0.05, **P<0.01. Data are shown as mean ± SEM. Representative images of time courses (a,d,g,j,m) and step currents (b,e,h,k,n) were obtained from 7, 6, 12, 5, 12 cells, respectively.
Figure 5. TRPP2 mediates WNT3A-induced whole cell currents in MEFs
Time course, step currents, and I-V curves of WNT3A-induced whole cell currents in zero intracellular Ca2+ in mock- (a-c, n=16 cells pooled from 6 independent experiments), or ZNRF3-transfected Pkd2+/+ (d-f, n=20 cells pooled from 7 independent experiments) or Pkd2−/− MEFs (g-i, n=9 cells from 4 independent experiments) before (black) and after the addition of WNT3A (500 ng/ml) in the bath solution (red). Step currents are shown at 5 min after the addition of WNT9B in the bat solution. Statistical analysis was performed using paired Student's t-test, *P<0.05, **P<0.01. Data are shown as mean ± SEM. Representative images of time courses (a,d,g) and step currents (b,e,h) were obtained from 16, 20, 9 cells, respectively.
Figure 6. Interaction of DVL1 and DVL2 with PKD1 in MEFs and transiently transfecte HEK293T cells
(a) Wild type MEF cell lysates were incubated with mouse IgG1 control antibody or mouse monoclonal α-PKD1 (E4). Immunocomplexes were immunoblotted with rabbit polyclonal α-DVL1 (upper left panel), α-DVL2 (middle left panel), or mouse monoclonal α-PKD1 (7e12, lower left panel). Expression levels of DVL1, DVL2, or PKD1 in lysates incubated with mouse IgG1 control or α-PKD1 (E4) are shown in right panels (input). Experiments were successfully repeated 3 times. (b) Cell lysates from Pkd1−/− or Pkd2−/− MEFs were incubated with mouse IgG1 control antibody or mouse monoclonal α-PKD1 (E4) and DVL2 was detected in the immunocomplexes, as described in (a). Experiments were successfully repeated twice. (c) HEK293T cells were transiently transfected with indicated plasmids and PKD1 or TRPP2 was pulled down with α-HA. Flag-tagged wild type or mutant DVL2 was detected using α-Flag. DIX (
DI
shevelled and a
X
in), PDZ, or DEP (
D
ishevelled,
E
gl-10 and
P
lecstrin) domains are shown red in DVL2 diagram. Position of E499G mutation and PY motif are shown by a black arrow head. Experiments were successfully repeated 3 times. (d) Time course, step currents and I-V curves in zero intracellular Ca2+ of wild type MEFs transiently transfected with a DVL2-specific siRNA (n=18 cells pooled from 5 independent experiments) or a mixture of DVL1 and DVL2 siRNAs (n=13 cells pooled from 4 independent experiments). Statistical tests were performed using paired Student's t-test, **P<0.01. Data are shown as mean ± SEM. (e) Knockdown efficiency of DVL1 and DVL2 siRNAs. Wild type MEFs were transiently transfected with indicated siRNAs and cell lysates were immunoblotted with α-DVL1, α-DVL2, or α-β-actin. Experiment was done once. Unprocessed original scans of blots are shown in Supplementary Fig. 8).
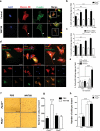
Figure 7. TRPP2 mediates WNT9B-induced cell migration
(a) Pkd2+/+ cells stained with phalloidin (green, to visualize F-actin), Myosin IIB (red), or DAPI (blue) at 0 (Control) or 30 min after the addition of WNT9B (500 ng/ml). Arrow heads indicate accumulation of F-actin and Myosin IIB in the trailing edge of a migrating cell. Scale bar, 50 μm. (b) Percentage of Pkd2+/+ cells with trailing edge per field (total number of fields of cells pooled from 3 independent experiments shown in graph) incubated with WNT9B or PBS at different time points. (c) Percentage of cells with trailing edge per field (total number of fields of cells pooled from 3 independent experiments shown in graph) in Pkd2+/+ MEFs incubated with WNT9B in the presence or absence (DMSO) of 10 μM BAPTA/AM at different time points. (d) Representative images of GFP-, GFP+TRPP2WT- or GFP+TRPP2Kv1.3-transfected Pkd2−/− cells stained for F-actin (yellow) and Myosin IIB (red). Scale bar, 50 μm. (e) Percent of migrating GFP-positive cells in three groups treated for 1 h with PBS or WNT9B (500 ng/ml) from one representative out of three independent transfections (total number of fields of cells from a single experiment, that was independently repeated three times are shown in graph). Statistics source data for all three experiments are available in Suppl. Table 3. (f) Cells migrated through a trans-well filter in the presence of WNT9B (1 μg/ml) or PBS for 6 h. Scale bar, 500 μm. (g) Number of migrating Pkd2+/+ or Pkd2−/− cells through a trans-well filter in the presence of PBS or WNT9B. n= 18 fields per group pooled from 3 independent experiments scoring a total of 2462 (_Pkd2+/+_-PBS), 5665 (_Pkd2+/+_-WNT9B), 3091 (_Pkd2−/−_-PBS), or 2796 (_Pkd2−/−_-WNT9B) cells. (h) Number of migrating cells in the presence of PBS or PDGF-BB (25 ng/ml). Data were pooled from 3 independent experiments in quadruplicates (n= 12 fields per group scoring a total of 3625 (_Pkd2+/+_-PBS), 8927 (_Pkd2+/+_-PDGF-BB), 3904 (_Pkd2−/−_-PBS), or 9048 (_Pkd2−/−_-PDGF-BB) cells. N.S means non-significant, *P<0.05, ***P<0.001 in one-way ANOVA followed by Neuman-Keuls post hoc test. Data are shown as mean ± SEM.
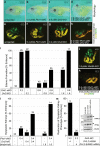
Figure 8. Cooperativity between PKD1 and DVL2 in Xenopus
(a-l) Xenopus embryos were injected with the indicated amounts of Pkd1-sMO1, Dvl2-MO and Wnt9A-MO either alone or in combination. Embryos were analyzed at stage 43 by morphology for edema formation or at stage 40 by immunofluorescence with the proximal tubular marker 3G8 (green) and the distal tubule/nephric duct marker 4A6 (yellow). Representative images of an uninjected control (a,e) and embryos injected with suboptimal amounts of Pkd1-sMO1 (b,f), Dvl2-MO (c,g), a mixture of Pkd1-sMO1 and Dvl2-MO (d,h), as well as with a Wnt9A-sMO alone (j) or in combination with suboptimal amounts of Pkd1-sMO1 (k) are shown. Bar diagrams showing the percentage of embryos exhibiting edema or dysplastic kidneys from 4 or 3 independent experiments are shown in (i) or (l), respectively. (m) Rescue experiment of Dvl2 morphants with a unilateral injection of either 4 ng wild type human DVL2 mRNA or 4 ng mutant DVL2-E499G mRNA. Embryos were analyzed at stage 40 by 3G8/4A6 immunofluorescence comparing the mRNA injected side with the contralateral side. Bar diagram depicts the summary of 3 independent experiments. (Inset) Expression levels of Flag-tagged human DVL2 and DVL2-E499G mutant in stage 25 embryos injected with 1 ng mRNA into a single blastomere at the 4-8 cell stage. Experiment was done twice. Total number of scored embryos is shown on top of each bar.
Comment in
- Polycystic kidney disease: WNTs: ligands of the polycystin complex.
Allison SJ. Allison SJ. Nat Rev Nephrol. 2016 Jul;12(7):377. doi: 10.1038/nrneph.2016.77. Epub 2016 Jun 6. Nat Rev Nephrol. 2016. PMID: 27263396 No abstract available.
Similar articles
- Function and regulation of TRPP2 at the plasma membrane.
Tsiokas L. Tsiokas L. Am J Physiol Renal Physiol. 2009 Jul;297(1):F1-9. doi: 10.1152/ajprenal.90277.2008. Epub 2009 Feb 25. Am J Physiol Renal Physiol. 2009. PMID: 19244406 Free PMC article. Review. - Expression of the polycystin-1 C-terminal cytoplasmic tail increases Cl channel activity in Xenopus oocytes.
Chernova MN, Vandorpe DH, Clark JS, Alper SL. Chernova MN, et al. Kidney Int. 2005 Aug;68(2):632-41. doi: 10.1111/j.1523-1755.2005.00441.x. Kidney Int. 2005. PMID: 16014040 - Polycystin-1 and polycystin-2 are both required to amplify inositol-trisphosphate-induced Ca2+ release.
Mekahli D, Sammels E, Luyten T, Welkenhuyzen K, van den Heuvel LP, Levtchenko EN, Gijsbers R, Bultynck G, Parys JB, De Smedt H, Missiaen L. Mekahli D, et al. Cell Calcium. 2012 Jun;51(6):452-8. doi: 10.1016/j.ceca.2012.03.002. Epub 2012 Mar 27. Cell Calcium. 2012. PMID: 22456092 - TRPP2 dysfunction decreases ATP-evoked calcium, induces cell aggregation and stimulates proliferation in T lymphocytes.
Magistroni R, Mangolini A, Guzzo S, Testa F, Rapanà MR, Mignani R, Russo G, di Virgilio F, Aguiari G. Magistroni R, et al. BMC Nephrol. 2019 Sep 13;20(1):355. doi: 10.1186/s12882-019-1540-6. BMC Nephrol. 2019. PMID: 31514750 Free PMC article. - Polycystins as components of large multiprotein complexes of polycystin interactors.
Hardy E, Tsiokas L. Hardy E, et al. Cell Signal. 2020 Aug;72:109640. doi: 10.1016/j.cellsig.2020.109640. Epub 2020 Apr 17. Cell Signal. 2020. PMID: 32305669 Free PMC article. Review.
Cited by
- An Overview of In Vivo and In Vitro Models for Autosomal Dominant Polycystic Kidney Disease: A Journey from 3D-Cysts to Mini-Pigs.
Koslowski S, Latapy C, Auvray P, Blondel M, Meijer L. Koslowski S, et al. Int J Mol Sci. 2020 Jun 25;21(12):4537. doi: 10.3390/ijms21124537. Int J Mol Sci. 2020. PMID: 32630605 Free PMC article. Review. - The GPCR properties of polycystin-1- A new paradigm.
Maser RL, Calvet JP, Parnell SC. Maser RL, et al. Front Mol Biosci. 2022 Nov 4;9:1035507. doi: 10.3389/fmolb.2022.1035507. eCollection 2022. Front Mol Biosci. 2022. PMID: 36406261 Free PMC article. Review. - Canonical Wnt inhibitors ameliorate cystogenesis in a mouse ortholog of human ADPKD.
Li A, Xu Y, Fan S, Meng J, Shen X, Xiao Q, Li Y, Zhang L, Zhang X, Wu G, Liang C, Wu D. Li A, et al. JCI Insight. 2018 Mar 8;3(5):e95874. doi: 10.1172/jci.insight.95874. JCI Insight. 2018. PMID: 29515026 Free PMC article. - Hydrophobic pore gates regulate ion permeation in polycystic kidney disease 2 and 2L1 channels.
Zheng W, Yang X, Hu R, Cai R, Hofmann L, Wang Z, Hu Q, Liu X, Bulkley D, Yu Y, Tang J, Flockerzi V, Cao Y, Cao E, Chen XZ. Zheng W, et al. Nat Commun. 2018 Jun 13;9(1):2302. doi: 10.1038/s41467-018-04586-x. Nat Commun. 2018. PMID: 29899465 Free PMC article. - mTORC1 signaling and diabetic kidney disease.
Swaroop V, Ozkan E, Herrmann L, Thurman A, Kopasz-Gemmen O, Kunamneni A, Inoki K. Swaroop V, et al. Diabetol Int. 2024 Jun 20;15(4):707-718. doi: 10.1007/s13340-024-00738-1. eCollection 2024 Oct. Diabetol Int. 2024. PMID: 39469564 Review.
References
- Angers S, Moon RT. Proximal events in Wnt signal transduction. Nat Rev Mol Cell Biol. 2009;10:468–477. - PubMed
- Logan CY, Nusse R. The Wnt signaling pathway in development and disease. Annu Rev Cell Dev Biol. 2004;20:781–810. - PubMed
- Kuhl M, Sheldahl LC, Park M, Miller JR, Moon RT. The Wnt/Ca2+ pathway: a new vertebrate Wnt signaling pathway takes shape. Trends Genet. 2000;16:279–283. - PubMed
- Slusarski DC, Corces VG, Moon RT. Interaction of Wnt and a Frizzled homologue triggers G-protein-linked phosphatidylinositol signalling. Nature. 1997;390:410–413. - PubMed
Publication types
MeSH terms
Substances
Grants and funding
- R01 DK059599/DK/NIDDK NIH HHS/United States
- P30 DK090868/DK/NIDDK NIH HHS/United States
- R01 DK095036/DK/NIDDK NIH HHS/United States
- R01 DK080745/DK/NIDDK NIH HHS/United States
- R56 DK059599/DK/NIDDK NIH HHS/United States
LinkOut - more resources
Full Text Sources
Other Literature Sources
Molecular Biology Databases
Research Materials
Miscellaneous
