The RNA-binding protein TTP is a global post-transcriptional regulator of feedback control in inflammation - PubMed (original) (raw)
. 2016 Sep 6;44(15):7418-40.
doi: 10.1093/nar/gkw474. Epub 2016 May 24.
Affiliations
- PMID: 27220464
- PMCID: PMC5009735
- DOI: 10.1093/nar/gkw474
The RNA-binding protein TTP is a global post-transcriptional regulator of feedback control in inflammation
Christopher Tiedje et al. Nucleic Acids Res. 2016.
Abstract
RNA-binding proteins (RBPs) facilitate post-transcriptional control of eukaryotic gene expression at multiple levels. The RBP tristetraprolin (TTP/Zfp36) is a signal-induced phosphorylated anti-inflammatory protein guiding unstable mRNAs of pro-inflammatory proteins for degradation and preventing translation. Using iCLIP, we have identified numerous mRNA targets bound by wild-type TTP and by a non-MK2-phosphorylatable TTP mutant (TTP-AA) in 1 h LPS-stimulated macrophages and correlated their interaction with TTP to changes at the level of mRNA abundance and translation in a transcriptome-wide manner. The close similarity of the transcriptomes of TTP-deficient and TTP-expressing macrophages upon short LPS stimulation suggested an effective inactivation of TTP by MK2, whereas retained RNA-binding capacity of TTP-AA to 3'UTRs caused profound changes in the transcriptome and translatome, altered NF-κB-activation and induced cell death. Increased TTP binding to the 3'UTR of feedback inhibitor mRNAs, such as Ier3, Dusp1 or Tnfaip3, in the absence of MK2-dependent TTP neutralization resulted in a strong reduction of their protein synthesis contributing to the deregulation of the NF-κB-signaling pathway. Taken together, our study uncovers a role of TTP as a suppressor of feedback inhibitors of inflammation and highlights the importance of fine-tuned TTP activity-regulation by MK2 in order to control the pro-inflammatory response.
© The Author(s) 2016. Published by Oxford University Press on behalf of Nucleic Acids Research.
Figures
Figure 1.
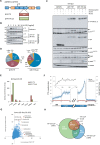
Expression of TTP and TTP-AA in macrophages and TTP-iCLIP. (A) Schematic representation of the all-in-one inducible vector pSERST11 that allows the expression of GFP, GFP–TTP or GFP–TTP-AA upon addition of doxycycline. (B) Comparison of the TTP induction kinetics in RAW264.7 cells with GFP–TTP- and GFP–TTP-AA expressing mouse macrophages after LPS stimulation for the indicated times. GFP–TTP and GFP–TTP-AA expression was induced by pretreating the cells with doxycycline for 6 h prior to LPS addition. The arrow indicates the position of GFP–TTP-AA protein while the lower band in the same bot is unspecific. (C) FACS-sorted GFP-positive cells were treated with either doxycycline alone for 6 h or in combination with LPS for 1 and 4 h, were lysed and analyzed by western blot for the indicated proteins. (D) Transcriptome-wide distribution of crosslinks in RNAs from GFP–TTP and GFP–TTP-AA iCLIP experiments upon 6 h doxycycline induction in combination with 1 h LPS. Results from individual experiments were grouped (GFP–TTP n = 4 and GFP–TTP-AA n = 3). The fraction of unique TTP crosslink sites mapped to the 3′ or 5′ untranslated region (UTR), open reading frame (ORF), intergenic regions, introns or telomeric regions is presented as the percentage of the sum of unique cDNA counts (for peak call analysis (false-discovery rate, <0.05)). (E) Density enrichment (by normalization of the data from (D) to the total length of the genomic features) for the GFP–TTP- and GFP–TTP-AA-bound RNAs to the different transcriptome subsets after the indicated stimulation (GFP–TTP n = 4 and GFP–TTP-AA n = 3). (F) The number of crosslinks in the sense (blue dots) and antisense direction (red dots) for the relative distance (-300 to 300) to the ORF-3′UTR (left) and 3′UTR-intergenic junctions (right), respectively, are plotted and result in a smoothed distribution of crosslinks within this genomic feature (black line). The insert shows a higher resolution of the smoothed distribution in the upstream 3′UTR. (G) Determination of the preferred GFP–TTP and GFP–TTP-AA binding motifs upon 6 h doxycycline/1 h LPS stimulation by k-mer analysis. The k-mer-sequences of eight nucleotides in length with the highest abundance are labeled in red. All groups were derived from four and three individual iCLIP analyses, respectively. (H) Overlap between GFP–TTP and GFP–TTP-AA 3′UTR iCLIP targets and with TTP targets identified by PAR-CLIP (31). All targets with more than one cDNA count were considered. Venn diagrams were generated using the eulerAPE_v3 tool (84). The numbers of different targets in the groups are indicated.
Figure 2.
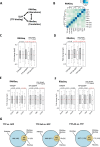
Correlation of iCLIP, mRNA abundance (RNASeq) and translation (RiboSeq) to identify global consequences of TTP- and TTP-AA-binding for the myeloid transcriptome. (A) Scheme for the correlations made between RNA levels or abundance (RNASeq), ribosomal occupation of mRNAs (RibosSeq) and the iCLIP data. RNASeq and RiboSeq measurements were performed in triplicate for each GFP-protein. See Supplementary Table S1 for number of replicates and conditions. (B) Cluster analysis for the RNASeq samples. Three replicates of cells each expressing GFP/EV, GFP–TTP or GFP–TTP-AA following 6 h Dox/1h LPS, are numbered 1, 2 and 3. (C and D) Overall changes in mRNA abundance (RNASeq (c)) and mRNA translation (RiboSeq (d)) between the indicated genotypes comparing the following TTP targets: iCLIP targets (white boxes) and non-bound mRNAs (gray boxes) are shown as a kernel density distribution in boxplots. A Wilcoxon rank sum test with continuity correction was used to determine the _P_-values shown for each comparison. Statistically significant differences in abundance and translation between targets and non-targets are indicated in red. For each genotype n = 3 sequencing libraries were analyzed and the mean of each group is shown. The red lines indicate for y = 0. Highly statistically significant differences are indicated in red. (E and F) For the comparisons between TTP/GFP and TTP-AA/GFP changed targets obtained from (C) and (D) were assigned to the mRNA region (5′UTR, ORF and 3′UTR) leading to detailed (E) RNASeq and (F) RiboSeq blots. A Wilcoxon rank sum test with continuity correction was used to determine the _P_-values shown for every comparison. The red lines indicate for y = 0. Highly statistically significant differences in abundance (E) and translation (F) between targets (white boxes) and non-targets (gray boxes) are indicated in red and could only be detected for targets where TTP binds in the 3′UTR. (G) The overlap of DE genes from RNASeq and RiboSeq experiments is visualized by Venn diagrams for the different comparisons. The number of genes for the RNASeq (changes in mRNA abundance), RiboSeq (changes in translation) and RNASeq/RiboSeq (changes in abundance and translation) are given together with the number of iCLIP targets in each group (in brackets).
Figure 3.
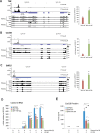
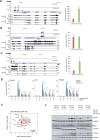
Examples of established and novel TTP targets identified by iCLIP and their validation by RNA-IP and expression analysis. (A–C) Genomic tracks for TNF (A), Cxcl10 (B) and Gdf15 (C) are shown, containing information for iCLIP, RNASeq and RiboSeq for GFP-, GFP–TTP- and GFP–TTP-AA-expressing cells. ATTTA and TATTTAT repeats are indicated as red dots below the iCLIP tracks. Dimensions are indicated by the numbers in brackets for each track. At the right of the tracks, RNA-IPs for GFP–TTP and GFP–TTP-AA are shown in relation to the GFP/EV control IP. The asterisk (*) indicates _P_-values ≤ 0.05 for GFP–TTP-AA IP compared to GFP–TTP IP. (D) Cxcl10 mRNA level in the three different cell lines were determined by qPCR. (E) Cxcl10 protein levels were determined by ELISA for the indicated stimulatory conditions. 1 × 10⁴ cells were seeded in triplicates in a 96-well plate. After attachment of the cells, stimulation was started and Cxcl10 protein in supernatants was measured. The asterisk (*) indicates _P_-values ≤ 0.03; n.d.: not detectable.
Figure 4.
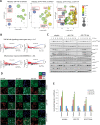
Gene ontology analysis reveals a role of TTP in signal transduction processes including NF-κB -signaling. (A) Differentially expressed genes from RiboSeq data comparing different samples were used to perform gene ontology (GO) analyses using the GOrilla tool (47). To remove redundant terms and to visualize the results the REVIGO tool (85) was used. The y-axis (semantic space), that quantifies similarities of word meanings. The color-coded log10 _P_-values for each GO term are given on the x-axis. Circle sizes correspond to the frequency of similar GO terms summarized in the specific GO term (see legend on the right). Enriched GO terms connected to enriched pathways (Table 3) are highlighted in red rectangles. (B) A custom gene set comprised of 117 TNF-/NF-κB-signaling-related genes and the ‘inflammatory response’ (GO:0006954) were enriched for TTP-AA vs. TTP cell mRNA expression (left plot) and translation (right plot). Log2-fold changes in expression and translation of each regulated gene are plotted with the corresponding adjusted _P_-values (padj) of the changes. Numbers indicate increased or decreased genes. The associated numbers in brackets show the number of iCLIP targets in each corresponding group. (C) Components of the NF-κB-signaling pathway were analyzed in western blot in macrophages upon 6 h of doxycycline-stimulation prior to stimulation with LPS for the indicated times. In addition, the phosphorylation of p38MAPK at T180/T182 and MK2 at T222 (double band pattern indicated by arrows) were monitored as controls for LPS-mediated TLR4-activation. Quantifications of these western blots are given in Supplementary Figure S6. (D) Examples of images used for the microscopic analysis of NF-κB localization (green) in the indicated cell types and upon different times of LPS stimulation. Nuclei (blue) and F-actin (red) were co-stained with DAPI and Phalloidin, respectively. An overlay of all three channels is added to each panel. (E) Quantitative analysis of the images exemplified in (D) to compare the increase of nuclear and decrease of cytosolic NF-κB localization upon LPS stimulation. For each analysis and each genotype, unstimulated cells were used as a reference. Nuclear localization was assessed by comparing with DAPI and cytosolic localization with F-actin co-staining (see experimental procedures for details). The hashtag (#) indicates statistical significance with _P_-values ≤ 0.05 comparing GFP–TTP-AA to GFP/EV and GFP–TTP cells, whereas the asterisk (*) indicates for significance comparing GFP–TTP with GFP/EV cells.
Figure 5.
Deregulation of feedback inhibitors of inflammation through TTP and TTP-AA. (A–C) Genomic tracks for the feedback inhibitors Dusp1 (A), Ier3 (B) and Tnfaip3 (C) containing information for iCLIP, RNASeq and RiboSeq data for GFP-, GFP–TTP- and GFP–TTP-AA-expressing cells are shown in the format as introduced in Figure 3. ATTTA and TATTTAT repeats are indicated below the iCLIP tracks. Dimensions are indicated by the numbers in brackets for each track. The graph to the right of each track shows the RNA-IPs for GFP–TTP and GFP–TTP-AA in relation to the GFP/EV Control IP. Asterisks (*) indicate _P_-values ≤ 0.05 for GFP–TTP-AA IP compared to GFP–TTP IP. (D) Relative mRNA levels of the indicated transcripts were determined by qPCR upon different stimulations. The control conditions of GFP/EV-expressing cells were set to 1. Fold changes were calculated in relation to this condition. (E) Log2-fold changes in translation versus changes in mean expression (log10) for a set of feedback inhibitors of the inflammatory response (14) and selected other mRNAs in GFP–TTP-AA- versus GFP–TTP-expressing cells. The position of individual transcripts is marked. TTP-bound iCLIP target mRNAs are shown as red dots, whereas non-targets are black. (F) Levels of the Dusp1-, Ier3- and Tnfaip3-protein were determined by western blot in the TTP BMDM cell lines upon different stimulations. GAPDH served as a loading control. Quantifications of western blots are given in Supplementary Figure S8.
Figure 6.
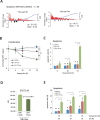
TTP-AA-expression limits proliferation and increases cell death. (A) The 65 genes of the enriched Wiki pathway ‘Apoptosis’ (WP1254_69153) were analyzed for changes in their expression (left panel) and translation (right panel) comparing GFP–TTP-AA to GFP–TTP cells. Log2-fold changes are plotted against the adjusted _P_-values of the changes. The numbers of up- and down-regulated genes are given (number of iCLIP targets in brackets). (B) Cell proliferation of macrophages after induction of GFP, GFP–TTP and GFP–TTP-AA expression by doxycycline treatment. Non-doxycycline treated cells of each genotype were used for normalization of signals. The mean of all three measurements is shown and standard deviations are included. The asterisk (*) indicates _P_-values ≤ 0.05. (C) Percentages of apoptotic cells upon long-term expression of GFP-fusion proteins were determined. The mean and standard deviation of three independent experiments are shown. The asterisk (*) corresponds to P < 0.03. (D) Mean fluorescence intensities (MFI) of GFP fluorescence in apoptotic (7-AAD+) and non-apoptotic (7-AAD-) GFP–TTP-AA-expressing cells. P < 0.1×10⁻⁶ (unpaired _t_-test). (E) Cell death after induction of GFP/GFP–TTP/GFP–TTP-AA expression and LPS stimulation for different times. The mean and standard deviation of three independent experiments s are shown. The asterisk (*) corresponds to P < 0.005.
Figure 7.
Schematic presentation of TTP's action as phosphorylation-triggered key regulator of feedback control of inflammation via NF-κB-regulating proteins, cytokines and chemokines. (A) Upon LPS-mediated TLR4-stimulation (1 h LPS), TTP is phosphorylated and thereby inactivated by MK2. As a consequence and as detected by iCLIP analyses, binding to AREs within 3′UTRs is decreased, compared to non-phosphorylated TTP (no LPS) or at later time points when TTP phosphorylation decreases (4 h LPS). Under physiological conditions, phosphatases (PPs), such as PP2A, are responsible for dephosphorylation of TTP after prolonged LPS challenge, restoring TTP's binding to AREs to mediate post-transcriptional control of associated mRNAs. An enhanced association of phospho-TTP to ncRNAs was also detected without determining its physiological role. (B) Absence of MK2-mediated TTP-phosphorylation at serines S52/S178 in TTP-AA cells results in enhanced binding to AREs in the 3′UTRs of mRNAs coding for stimulators and feedback regulators of inflammation especially after 1h of LPS stimulation. This results in their post-transcriptional regulation at the level of mRNA stability and translation. As a direct output we detected a stronger suppression of stimulatory cytokines and chemokines, such as TNF, Cxcl10 and Gdf15, and of negative feedback inhibitors, such as Ier3, Dusp1 and Tnfaip3, in these cells, compared to wild-type TTP-expressing cells. In addition, several proteins coding for NF-κB-regulators are affected post-transcriptionally. Together this results in deregulated NF-κB-signaling and increased cell death in response to LPS. ARE: AU-rich element; Cap: 5′-7-methylguanosine cap; CDS: coding (DNA) sequence; (A)n: 3′-poly(A) tail.
Similar articles
- Translational regulation of specific mRNAs controls feedback inhibition and survival during macrophage activation.
Schott J, Reitter S, Philipp J, Haneke K, Schäfer H, Stoecklin G. Schott J, et al. PLoS Genet. 2014 Jun 19;10(6):e1004368. doi: 10.1371/journal.pgen.1004368. eCollection 2014 Jun. PLoS Genet. 2014. PMID: 24945926 Free PMC article. - The Role of TTP Phosphorylation in the Regulation of Inflammatory Cytokine Production by MK2/3.
Ronkina N, Shushakova N, Tiedje C, Yakovleva T, Tollenaere MAX, Scott A, Batth TS, Olsen JV, Helmke A, Bekker-Jensen SH, Clark AR, Kotlyarov A, Gaestel M. Ronkina N, et al. J Immunol. 2019 Oct 15;203(8):2291-2300. doi: 10.4049/jimmunol.1801221. Epub 2019 Sep 16. J Immunol. 2019. PMID: 31527197 - Mitogen-activated protein kinase-activated protein kinase 2 regulates tumor necrosis factor mRNA stability and translation mainly by altering tristetraprolin expression, stability, and binding to adenine/uridine-rich element.
Hitti E, Iakovleva T, Brook M, Deppenmeier S, Gruber AD, Radzioch D, Clark AR, Blackshear PJ, Kotlyarov A, Gaestel M. Hitti E, et al. Mol Cell Biol. 2006 Mar;26(6):2399-407. doi: 10.1128/MCB.26.6.2399-2407.2006. Mol Cell Biol. 2006. PMID: 16508014 Free PMC article. - MAPKAP kinases MK2 and MK3 in inflammation: complex regulation of TNF biosynthesis via expression and phosphorylation of tristetraprolin.
Ronkina N, Menon MB, Schwermann J, Tiedje C, Hitti E, Kotlyarov A, Gaestel M. Ronkina N, et al. Biochem Pharmacol. 2010 Dec 15;80(12):1915-20. doi: 10.1016/j.bcp.2010.06.021. Epub 2010 Jun 23. Biochem Pharmacol. 2010. PMID: 20599781 Review. - Control of mRNA decay by phosphorylation of tristetraprolin.
Sandler H, Stoecklin G. Sandler H, et al. Biochem Soc Trans. 2008 Jun;36(Pt 3):491-6. doi: 10.1042/BST0360491. Biochem Soc Trans. 2008. PMID: 18481987 Review.
Cited by
- The RNA-Binding Proteins Zfp36l1 and Zfp36l2 Enforce the Thymic β-Selection Checkpoint by Limiting DNA Damage Response Signaling and Cell Cycle Progression.
Vogel KU, Bell LS, Galloway A, Ahlfors H, Turner M. Vogel KU, et al. J Immunol. 2016 Oct 1;197(7):2673-2685. doi: 10.4049/jimmunol.1600854. Epub 2016 Aug 26. J Immunol. 2016. PMID: 27566829 Free PMC article. - Dynamic and widespread control of poly(A) tail length during macrophage activation.
Kwak Y, Daly CWP, Fogarty EA, Grimson A, Kwak H. Kwak Y, et al. RNA. 2022 Jul;28(7):947-971. doi: 10.1261/rna.078918.121. Epub 2022 May 5. RNA. 2022. PMID: 35512831 Free PMC article. - Comprehensive Proteomics Analysis of Stressed Human Islets Identifies GDF15 as a Target for Type 1 Diabetes Intervention.
Nakayasu ES, Syed F, Tersey SA, Gritsenko MA, Mitchell HD, Chan CY, Dirice E, Turatsinze JV, Cui Y, Kulkarni RN, Eizirik DL, Qian WJ, Webb-Robertson BM, Evans-Molina C, Mirmira RG, Metz TO. Nakayasu ES, et al. Cell Metab. 2020 Feb 4;31(2):363-374.e6. doi: 10.1016/j.cmet.2019.12.005. Epub 2020 Jan 9. Cell Metab. 2020. PMID: 31928885 Free PMC article. - Post-Transcriptional Inflammatory Response to Intracellular Bacterial c-di-AMP.
Mahmoud L, Abdulkarim AS, Kutbi S, Moghrabi W, Altwijri S, Khabar KSA, Hitti EG. Mahmoud L, et al. Front Immunol. 2020 Jan 17;10:3050. doi: 10.3389/fimmu.2019.03050. eCollection 2019. Front Immunol. 2020. PMID: 32010134 Free PMC article. - Tristetraprolin regulates necroptosis during tonic Toll-like receptor 4 (TLR4) signaling in murine macrophages.
Ariana A, Alturki NA, Hajjar S, Stumpo DJ, Tiedje C, Alnemri ES, Gaestel M, Blackshear PJ, Sad S. Ariana A, et al. J Biol Chem. 2020 Apr 3;295(14):4661-4672. doi: 10.1074/jbc.RA119.011633. Epub 2020 Feb 24. J Biol Chem. 2020. PMID: 32094226 Free PMC article.
References
- Turner M., Galloway A., Vigorito E. Noncoding RNA and its associated proteins as regulatory elements of the immune system. Nat. Immunol. 2014;15:484–491. - PubMed
- Carpenter S., Ricci E.P., Mercier B.C., Moore M.J., Fitzgerald K.A. Post-transcriptional regulation of gene expression in innate immunity. Nat. Rev. Immunol. 2014;14:361–376. - PubMed
- Tiedje C., Holtmann H., Gaestel M. The role of mammalian MAPK signaling in regulation of cytokine mRNA stability and translation. J. Interferon Cytokine Res. 2014;34:220–232. - PubMed
MeSH terms
Substances
Grants and funding
- BB/J00152X/1/BB_/Biotechnology and Biological Sciences Research Council/United Kingdom
- BBS/E/B/000C0407/BB_/Biotechnology and Biological Sciences Research Council/United Kingdom
- BBS/E/B/000C0409/Biotechnology and Biological Sciences Research Council/United Kingdom
LinkOut - more resources
Full Text Sources
Other Literature Sources
Molecular Biology Databases
Miscellaneous
