Zebras and Biting Flies: Quantitative Analysis of Reflected Light from Zebra Coats in Their Natural Habitat - PubMed (original) (raw)
Zebras and Biting Flies: Quantitative Analysis of Reflected Light from Zebra Coats in Their Natural Habitat
Kenneth H Britten et al. PLoS One. 2016.
Abstract
Experimental and comparative evidence suggests that the striped coats of zebras deter biting fly attack, but the mechanisms by which flies fail to target black-and-white mammals are still opaque. Two hypotheses have been proposed: stripes might serve either to defeat polarotaxis or to obscure the form of the animal. To test these hypotheses, we systematically photographed free-living plains zebras in Africa. We found that black and white stripes both have moderate polarization signatures with a similar angle, though the degree (magnitude) of polarization in white stripes is lower. When we modeled the visibility of these signals from different distances, we found that polarization differences between stripes are invisible to flies more than 10 m away because they are averaged out by the flies' low visual resolution. At any distance, however, a positively polarotactic insect would have a distinct signal to guide its visual approach to a zebra because we found that polarization of light reflecting from zebras is higher than from surrounding dry grasses. We also found that the stripes themselves are visible to flies at somewhat greater distances (up to 20 m) than the polarization contrast between stripes. Together, these observations support hypotheses in which zebra stripes defeat visually guided orienting behavior in flies by a mechanism independent of polarotaxis.
Conflict of interest statement
Competing Interests: The authors have declared that no competing interests exist.
Figures
Fig 1. Single zebra data set example.
The centre shows a typical zebra image, with eight regions of interest (ROI) denoted by the rectangles outlined in green. These areas were used consistently across individual subjects. For each ROI, the corresponding polarization data are indicated by the surrounding plots. In each, the luminance of the black and white stripes are shown by the closed and open circles, respectively; each is a single measurement from the ROI at that polarization angle. In each series, the -90° and +90° points are replicate, independent observations; they provide an estimate of the repeat reliability of the data. As expected, reliability is greater for the larger ROIs. Superimposed on each data set is the best-fit sinusoidal function (also see Fig 2). The zebra image in the centre corresponds to the individual data points at +30°. The colour scale in the zebra image has been adjusted here for illustration purposes only, because the 14-bit data appear very dark in standard rendering. Note the considerable change in luminance through filter angles in white stripes in most ROIs.
Fig 2. Derivation of extracted quantities from fitted sinusoids.
This shows a single fit to the white stripes from a single ROI (foreleg in Fig 1). The phase angle corresponds to the offset of the fit from odd symmetry around the midpoint filter setting, which in this case was approximately 30 degrees. The d value is calculated from the contrast between the maximum and minimum values of the fit curve. It is important to note that the phase angle parameter is not the same as the angle in which more polarized light is present, but is linearly related to this physical parameter. See methods for details.
Fig 3. Degree of polarization signals in black and white stripes.
The filled circles represent the subset of ROIs used in Fig 5, where there was a significant correlation between fit and data; these are the same cases illustrated in Fig 5.
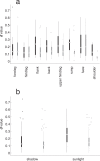
Fig 4. Box/whisker plot showing the distributions of d values in different ROIs for black and white stripes under different illumination conditions.
In each column, the dot surrounded by a circle depicts the mean, the box shows the quartiles, the whiskers the 95% confidence intervals, and the “o” symbols show outliers.
Fig 5. Correlation between fit phases in black and white stripes.
Each data point represents a single ROI in a single zebra, and the phases of each were fit independently. Note the high degree of correlation evident in the data; outliers were present but rare. Because phase could only be accurately estimated in data where the d value was high, this analysis is restricted to the cases where there was a significant correlation between data and fit.
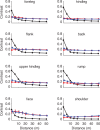
Fig 6. Visibility of polarization and stripe contrast with respect to distance from the zebra, plotting each ROI separately, averaged across individuals.
The Y axis represents contrast units, which are d values for the polarization data (blue denotes black stripes, red denotes white stripes), and Michelson contrasts (black lines) for the luminance data. Both are equivalent, unitless measures of the corresponding optical quantity. Error bars depict S.E.M., and where they are not visible, they are smaller than the plotting symbol.
Similar articles
- Benefits of zebra stripes: Behaviour of tabanid flies around zebras and horses.
Caro T, Argueta Y, Briolat ES, Bruggink J, Kasprowsky M, Lake J, Mitchell MJ, Richardson S, How M. Caro T, et al. PLoS One. 2019 Feb 20;14(2):e0210831. doi: 10.1371/journal.pone.0210831. eCollection 2019. PLoS One. 2019. PMID: 30785882 Free PMC article. - Polarotactic tabanids find striped patterns with brightness and/or polarization modulation least attractive: an advantage of zebra stripes.
Egri A, Blahó M, Kriska G, Farkas R, Gyurkovszky M, Akesson S, Horváth G. Egri A, et al. J Exp Biol. 2012 Mar 1;215(Pt 5):736-45. doi: 10.1242/jeb.065540. J Exp Biol. 2012. PMID: 22323196 - Zebras of all stripes repel biting flies at close range.
Tombak KJ, Gersick AS, Reisinger LV, Larison B, Rubenstein DI. Tombak KJ, et al. Sci Rep. 2022 Nov 3;12(1):18617. doi: 10.1038/s41598-022-22333-7. Sci Rep. 2022. PMID: 36329147 Free PMC article. - Management of zebras and zebra hybrids (zebroids).
Wiedner EB, Lindsay WA, Isaza R. Wiedner EB, et al. Compend Contin Educ Vet. 2012;34(9):E4. Compend Contin Educ Vet. 2012. PMID: 23705207 Review. - Parasites and the behavior of biting flies.
Moore J. Moore J. J Parasitol. 1993 Feb;79(1):1-16. J Parasitol. 1993. PMID: 8437048 Review.
Cited by
- Zebra stripes, tabanid biting flies and the aperture effect.
How MJ, Gonzales D, Irwin A, Caro T. How MJ, et al. Proc Biol Sci. 2020 Aug 26;287(1933):20201521. doi: 10.1098/rspb.2020.1521. Epub 2020 Aug 19. Proc Biol Sci. 2020. PMID: 32811316 Free PMC article. - Why don't horseflies land on zebras?
Caro T, Fogg E, Stephens-Collins T, Santon M, How MJ. Caro T, et al. J Exp Biol. 2023 Feb 15;226(4):jeb244778. doi: 10.1242/jeb.244778. Epub 2023 Feb 17. J Exp Biol. 2023. PMID: 36700395 Free PMC article. - Zebra skin odor repels the savannah tsetse fly, Glossina pallidipes (Diptera: Glossinidae).
Olaide OY, Tchouassi DP, Yusuf AA, Pirk CWW, Masiga DK, Saini RK, Torto B. Olaide OY, et al. PLoS Negl Trop Dis. 2019 Jun 10;13(6):e0007460. doi: 10.1371/journal.pntd.0007460. eCollection 2019 Jun. PLoS Negl Trop Dis. 2019. PMID: 31181060 Free PMC article. - Benefits of zebra stripes: Behaviour of tabanid flies around zebras and horses.
Caro T, Argueta Y, Briolat ES, Bruggink J, Kasprowsky M, Lake J, Mitchell MJ, Richardson S, How M. Caro T, et al. PLoS One. 2019 Feb 20;14(2):e0210831. doi: 10.1371/journal.pone.0210831. eCollection 2019. PLoS One. 2019. PMID: 30785882 Free PMC article. - An Overview of Tsetse Fly Repellents: Identification and Applications.
Orubuloye OY, Mbewe NJ, Tchouassi DP, Yusuf AA, Pirk CWW, Torto B. Orubuloye OY, et al. J Chem Ecol. 2024 Nov;50(11):581-592. doi: 10.1007/s10886-024-01527-5. Epub 2024 Jul 8. J Chem Ecol. 2024. PMID: 38976099 Free PMC article. Review.
References
- Thayer GH (1909) Concealing-coloration in the animal kingdom: an exposition of the laws of disguise through color and pattern: Being a summary of Abbott H. Thayer’s discoveries Macmillan, London.
- Morris D (1990) Animal watching. A field guide to animal behavior Johnathan Cape, London.
- Kingdon J (1984) The zebra’s stripes: an aid to group cohesion In: Macdonald D, editor. The encyclopedia of mammals, London: Allen & Unwin, London. p. 486–7.
- Waage JK (1981) How the zebra got its stripes–biting flies as selective agents in the evolution of zebra colouration. J Ent Soc Sth Afr 44: 351–8.
Publication types
MeSH terms
LinkOut - more resources
Full Text Sources
Other Literature Sources


