Carcinoma-astrocyte gap junctions promote brain metastasis by cGAMP transfer - PubMed (original) (raw)
. 2016 May 26;533(7604):493-498.
doi: 10.1038/nature18268. Epub 2016 May 18.
Adrienne Boire # 1 2, Xin Jin 1, Manuel Valiente 1, Ekrem Emrah Er 1, Alejandro Lopez-Soto 1, Leni Jacob 1, Ruzeen Patwa 1, Hardik Shah 3, Ke Xu 4, Justin R Cross 3, Joan Massagué 1
Affiliations
- PMID: 27225120
- PMCID: PMC5021195
- DOI: 10.1038/nature18268
Carcinoma-astrocyte gap junctions promote brain metastasis by cGAMP transfer
Qing Chen et al. Nature. 2016.
Erratum in
- Corrigendum: Carcinoma-astrocyte gap junctions promote brain metastasis by cGAMP transfer.
Chen Q, Boire A, Jin X, Valiente M, Emrah Er E, Lopez-Soto A, Jacob LS, Patwa R, Shah H, Xu K, Cross JR, Massagué J. Chen Q, et al. Nature. 2017 Apr 6;544(7648):124. doi: 10.1038/nature21730. Epub 2017 Mar 29. Nature. 2017. PMID: 28355178 No abstract available.
Abstract
Brain metastasis represents a substantial source of morbidity and mortality in various cancers, and is characterized by high resistance to chemotherapy. Here we define the role of the most abundant cell type in the brain, the astrocyte, in promoting brain metastasis. We show that human and mouse breast and lung cancer cells express protocadherin 7 (PCDH7), which promotes the assembly of carcinoma-astrocyte gap junctions composed of connexin 43 (Cx43). Once engaged with the astrocyte gap-junctional network, brain metastatic cancer cells use these channels to transfer the second messenger cGAMP to astrocytes, activating the STING pathway and production of inflammatory cytokines such as interferon-α (IFNα) and tumour necrosis factor (TNF). As paracrine signals, these factors activate the STAT1 and NF-κB pathways in brain metastatic cells, thereby supporting tumour growth and chemoresistance. The orally bioavailable modulators of gap junctions meclofenamate and tonabersat break this paracrine loop, and we provide proof-of-principle that these drugs could be used to treat established brain metastasis.
Figures
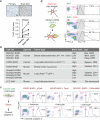
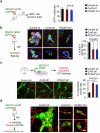
Extended Figure 1. Cancer cell-astrocyte interactions
a, Representative images and quantification of Cx43 immunostaining in matched primary and brain metastatic samples from non-small lung carcinoma patients. Scale bar, 100 μm (n = 8 patients). b, Cancer cells used in this study. c, Astrocyte co-culture protects cancer cells. As illustrated in schema (left), cleaved caspase 3+/GFP+ apoptotic BrM cells were quantified by flow cytometery after sFasL- or chemo-treatments. (3 independent experiments). d, Flow cytometric quantification of dye transfer from astrocytes to MDA231-BrM2 cells over time. (3 independent experiments).
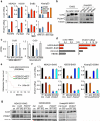
Extended Figure 2. Elevated expression of Cx43 and PCDH7 in brain metastatic cancer cells and astrocytes
a, Cx43 and PCDH7 mRNA in parental (Par) and BrM cells. Values are mean ± S.E.M. (3 independent experiments in triplicate). b, Cx43 and PCDH7 western blotting in ErbB2 parental and brain cells, as well as Kras/p53 cell lines. (n = 3 independent experiments). c, Cx26 and Cx30 mRNA in MDA231 parental (Par) and the metastatic derivatives of brain (BrM2), lung (LM) and bone (BoM). d, Cx43 and PCDH7 mRNA in BrM cells compared to brain cells. (3 independent experiments). e, Kaplan-Meier plot illustrates the probability of cumulative metastasis free survival in 63 cases (GSE8893) of lung adenocarcinoma based on Cx43/PCDH7 expression in the primary tumour. f,g, Knockdown of Cx43 and PCDH7 with short hairpin RNAs (shRNA) as assessed by RT-PCR (f) and western blotting (g). Ctrl, control. Values are mean ± S.E.M. (3 independent experiments in triplicate).
Extended Figure 3. PCDH7 facilitates gap junction communication
a,b, Histograms and quantification of dye transfer from astrocytes to control and Cx43-depleted or PCDH7-depleted Kras/p53-393N1 cells (a), and from astrocytes to control or Cx43-depleted MDA231-BrM2 cells, in comparison to Carbenoxolone (50 uM) treatment (b). c,d, PCDH7 in astrocytes facilitate gap junctions. PCDH7 immunoblotting of control or PCDH7-depleted astrocytes (c). Quantification of dye transfer from MDA231-BrM2 cells to PCDH7-depleted astrocytes (d). e, Quantification of dye transfer from human brain microvascular endothelial cells (HBMEC) to control, Cx43- or PCDH7-depleted MDA231-BrM2 cells. f, Dye transfer from MDA231-BrM2 cells to a mixed population of astrocytes and HBMEC. g, Quantification of dye transfer from control or Cx43-depleted MDA231-BrM2 cells to human microglia. For dye transfer assays, values are mean ± S.E.M. (≥ 2 independent experiments in triplicate).
Extended Figure 4. Cx43 directly interacts with PCDH7, but not with E cadherin or N cadherin
a, Schema illustrating split luciferase assay. Fusion constructs of PCDH7 and Cx43 were created with either the N or C terminal halves of luciferase, NLuc and CLuc, respectively. When these proteins are brought into proximity, luciferase is functionally reconstituted, producing photons of light. b, Cx43 and PCDH7 constructs fused with N-terminal and C-terminal firefly luciferase halves (N-luc) and (C-luc) were expressed in parental cell lines. The table (top) numerically identifies the cell line combinations used in the assays (bottom), and bioluminescence imaging (BLI) of a representative plate. c, Cx43 and PCDH7 western immunoblotting in cancer cells overexpressing fusion proteins. d, Quantification of BLI after co-culture of Cx43-CLuc/PCDH7-NLuc(+) cancer cells and astrocytes for 15 min. (3 independent experiments) e-g, Luciferase split assay to detect Cx43-E cadherin or Cx43-N cadherin interactions. Cell line combinations used in the assays are numerically identified in the table (e), and confirmed by western immunoblotting (f). Bioluminescence imaging (BLI) of a representative assay plate; cell line combinations are indicated numerically (g). (n ≥ 2 independent experiments).
Extended Figure 5. Inhibition of gap junction activity prevents brain metastatic outgrowth
a, Bioluminescent imaging (BLI) quantification of brain metastatic lesions formed by control (Ctrl), Cx43- or PCDH7-depleted H2030-BrM3 cells. (Data are from 2 independent experiments with 9 mice total per group). b, Representative images of GFP+ brain metastatic lesions formed by control, Cx43- or PCDH7-depleted MDA231-BrM2 cells. Brain sections or brain metastatic lesions are delineated by dotted white line or dotted red line, respectively. Scale bar, 1000 μm. c, BLI (images) and quantification (bar graph) of lung metastatic lesions formed by MDA231-BrM2 cells. Values are mean ± S.E.M. (Data are from 2 independent experiments with 5 mice total in each group). d,e, Gap junction-mediated brain metastasis requires channel function of Cx43. Wild type (WT) or T154A mutant (Mut) Cx43 was re-expressed in Cx43 depleted MDA231-BrM2 cells (CX43 sh2). Cx43 expression was detected by western blotting (d) and brain metastasis formed by these cells was quantified by BLI (e). (Data are from 2 independent experiments with 10 mice total per group)
Extended Figure 6. Cx43 and PCDH7 do not mediate early events of extravasation and vascular cooption in brain metastasis
a, Cx43 and PCDH7 do not mediate trans-BBB Migration. Quantification of control (Ctrl), Cx43-or PCDH7-depleted MDA231-BrM2 cells in 7-day brain lesions was carried out as follows: at the indicated timepoint, mice were euthanized, brains were sectioned, 10% of the sections were immunostained stained, and all GFP(+) cells in these sections were counted. Values are mean ± S.E.M. (n=5 brains in each group). b, Cx43 and PCDH7 mediate cancer cell colonization in 14-day brain lesions. Sectioning and staining were carried out as described in (a). Representative images are GFP (green) and Ki67 (red) staining. DAPI, nuclear staining. Scale bar, 20 μm. Bar graph is the proportion of Ki67+ cancer cells. Values are mean ± S.E.M. (n=5 brains in each group). c, Cx43 and PCDH7 mediate cancer cell survival. MDA231 BrM2 cells expressing CX43sh, PCDH7sh or Control sh were deposited onto living brain sections, 5 brain slices were seeded with cancer cells of each type. After 48 h, slices were fixed and stained for GFP (green) and cleaved caspase 3 (Casp3)(red) staining. Representative images are shown, Scale bar, 30 μm. After staining, all GFP(+) cells were counted on each slice. GFP (+) cells with 3+ caspase staining were scored as “apoptotic”. Histogram is the proportion of caspase 3+ apoptotic cancer cells. Values are mean ± S.E.M. (n=5 brain slices in each group). d, Cx43 and PCDH7 do not affect vascular cooption of cancer cells in 14-day brain lesions. Representative images are GFP (green) staining and vascular structure filled with TRITC dextran (red). Scale bar, 20 μm. (2 independent experiments).
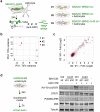
Extended Figure 7. Translating ribosome affinity purification (TRAP) after cancer cell astrocyte co-culture
a, Schematic illustration of TRAP experimental set up to isolate translating mRNA from MDA231-BrM2 cells under 3 conditions (#1, #2, #3). b, Principle component (PC) analysis of TRAP mRNA sequencing. c. Scatter plot of log2 fold-changes regulated by astrocytes and gap junction communications between BrM cells and astrocytes. d, STAT1 and NF-κB p65 phosphorylation in H2030-BrM3 cells after a 2 h incubation with conditioned media (CM) from astrocyte co-cultures. CM were collected after 24 h co-culture of astrocytes with control or Cx43-depleted H2030-BrM3 cells. n=3 independent experiments.
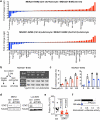
Extended Figure 8. Gap junction-generated signaling activates IFN and NF-κb pathways in cancer cells
a, Cytokine array analysis of conditioned media collected after 24 h co-culture of human astrocytes with control or Cx43-depleted MDA231-BrM2 cells. Log2 fold-changes were plotted. b, Schematic of co-culture conditioned media collection and human astrocyte re-isolation (left) ELISA of IFNα and TNFα in CM from astrocyte co-cultures with the indicated MDA231-BrM2 cells (right) All values are mean ± S.E.M. (≥2 independent experiments with 4 total replicates). c, Relative levels of cleaved caspase 3 in MDA231-BrM2 cells treated with various concentrations of carboplatin (Carbo) in the presence or absence of 10 units/ml (39 units/ng) IFNαA or 10 pg/ml TNFα. All values are mean ± S.E.M. (5 technical replicates over 3 independent experiments). d, STAT1 levels in control and STAT1-knockdown LLC BrM and 393N1 cells e. Quantification of BLI signal from brain metastases formed by syngeneic LLC-BrM control, or STAT1-knockdown cells. (Data are from 2 independent experiments with 12-15 mice total per group). f, NF-κB renilla luciferase reporter assay in MDA231-BrM cells expressing control pBABE or SR-IκBα vector. Vlues are mean ± S.E.M. (3 technical replicates).
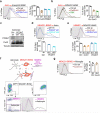
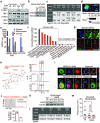
Extended Figure 9. Gap junctions initiate cytosolic DNA response in astrocytes
a, Control or Cx43-deplated H2030-BrM3 cells were co-cultured for 18 h with or without astrocytes, and subjected to immunobloting analysis of phosphorylated TBK1 and IRF3 (n=3 independent experiments). b, Immunoblot of mouse astrocytes depleted on STING with short hairpins or control (non-silencing) sh. c, Mouse IFNa and TNFa were quantitated in the conditioned medium after co-culture (b) by ELISA. (2 independent experiments with 3 replicates each). d, LLC BrM growth in syngeneic C57Bl6 mice hosts wild-type (+/+) or knock-out (−/−) for STING. Diameter of brain metastases (d) Scale bar, 50 μm. Brains from all mice (n = 22) were sectioned, immunostained, and measured. All GFP(+) brain metastases were quantitated (2.8 +/− 0.67 metastases per +/+ mouse; 1.6 +/− 0.55 in STING −/− mice). e, Quantification of dsDNA in the indicated cellular fractions from 2×10⁷ H2030-BrM3, MDA231-BrM2 or Human Astrocyte cells. Values are mean ± S.E.M. (n=3 biological replicates; 2 independent experiments). f, Ratio of cytosolic dsDNA and nuclear dsDNA in indicated cancer cells and non-neoplastic cells. g, Representative image of immunofluorescent staining of dsDNA, GFP, Cox IV (mitochondria marker) in MDA-BrM2 cells. h, cGAMP identification. The peak at 4.47 min contains all 3 SRM transitions specific for cGAMP. RT: retention time, AA: automatically integrated peak area. i, j, EdU labeled MDA231-BrM2 cells were co-cultured with astrocytes for 6 h. Transfer of EdU-labeled DNA from cancer cells to astrocytes was visualized using confocal microscopy (i), or quantified by flow cytometry (j). k, Immunoblot of H2030-BrM3 cells depleted of cGAS with short hairpins or control (non-silencing) sh. l, Human astrocytes (Astro), were cultured for 18 h with or without H2030 BrM cells (BrM) expressing control shRNA (Ctrl sh) or shRNA targeting cGAS; Human IFNa and TNFa were quantitated in the conditioned medium by ELISA (l). (2 independent experiments in triplicate). m, Quantification of BLI signal from brain metastases formed by H2030 BrM3 cells depleted of cGAS with two independent sh. (Data are from 2 independent experiments with 6 mice total per group).
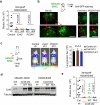
Extended Figure 10. Inhibition of Gap Junction Activity Prevents Brain Metastatic Outgrowth
a-d, Following treatment with Tonabersat (Tona) or meclofenamate (Meclo) (a), brain metastasis (b), primary tumour growth in mammary fat pads (c), or lung metastasis (d) was quantified by BLI. Values are mean ± S.E.M. (2 independent experiments with 10 mice total in each group). e, Human astrocytes were treated with Tonabersat or Meclofenamate at 200 uM and 100 uM, respectively for 12 h prior to transfection with cGAMP (4 μg/ml) with Lipofectamine 2000, or Lipofectamine alone.Conditioned media was collected 18 h later and assayed for human TNFαand IFNα by ELISA. (2 biological replicates). f, Knockdown of Cx43 and PCDH7 in MDA231-BrM2 cells with tet-on inducible short hairpin RNAs (shRNA), as assessed by RT-PCR (f) and western immunoblotting (g), after doxycycline treatment in vitro. 2 independent experiments. h, Brain ex vivo Bioluminescent imaging (BLI) 14 days after inoculation of MDA231-BrM2 cells (n = 10 mice).
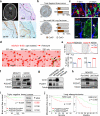
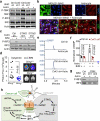
Figure 1. Cx43 and PCDH7 are associated with brain metastasis
a, Upper Left: Contrast-enhanced MRI of representative patient with brain metastasis. Tumor (white) is surrounded by parenchymal reaction (dark grey). Upper Right: Hematoxallin-Eosin staining (H&E) of resected brain metastasis (T) and parenchyma (P). Lower Panels: Immunohistochemistry of adjacent sections for GFAP (Lower Left) and Cx43 (Lower Right). Scale bar, 10 μm. (n = 6 patient samples) b, Cx43 expression is increased in brain metastases compared with primary and normal tissue. Representative images of Cx43 staining in clinical samples from triple-negative breast cancer (TNBC) and non-small cell lung carcinoma (NSCLC). Proportion of CX43-positive samples was quantified in primary (1ry) tumours (TNBC n = 98, NSCLC n = 138), brain metastases (Mets) (TNBC n= 117; NSCLC n = 91) and normal lung tissues (n = 75) Scale bar, 100 μm. c, Upper: GFP+ H2030-BrM3 cells (green) are surrounded by GFAP+ activated astrocytes (red) in the brain parenchyma at early (day 7) and later (day 21) time points following intracardiac inoculation in mice. Blue, collagen IV (ColIV) staining in vessels. Scale bar, 10 μm. Lower: Cx43 staining (arrowhead) at the interface of GFP+ H2030-BrM3 (green) and GFAP+ astrocytes (blue). Scale bar, 10 μm. d-e, Gap junction communication between astrocytes and BrM cells. d, Time-lapse images of dye transfer from MDA231-BrM2 cells to astrocytes. See also Supplementary Information Video S1. Scale bars, 100 μm. e, Quantification of dye transfer from astrocytes to cancer cells. Histograms show red fluorescent signal in parental (Par) and BrM cells. Values are mean ± S.E.M. (Data are from n=3 biological replicates over 3 independent experiments). f-i, Cx43 and PCDH7 western immunoblotting in the indicated parental and brain metastatic derivatives (f, n=3 independent experiments), in brain metastatic cells compared to brain cell types (g, n=2 independent experiments), and in MDA231 derivatives metastatic to brain, lung (LM) or bone (BoM) (h, n=2 independent experiments). Full blots are shown in Supplementary Data. i-j, Kaplan-Meier plots of brain metastasis-free survival in 189 cases of triple-negative breast cancer (i) and 129 cases (MSKCC set2) and 58 cases (GSE3141) of lung adenocarcinoma (j), based on Cx43/PCDH7 expression in the primary tumour.
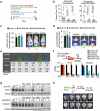
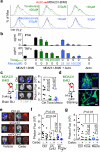
Figure 2. Cx43/PCDH7 carcinoma-astrocyte gap junctions mediate brain metastasis
a, Histograms (top) and quantification (bottom) of dye transfer from astrocytes to control and Cx43-depleted or PCDH7-depleted brain metastatic cells. Values are mean ± S.E.M. (Data are from n=3 biological replicates over 3 independent experiments). b-d, BLI (c) and quantification (b, d) of brain metastatic lesions formed by control, Cx43-depleted, or PCDH7-depleted brain metastatic cells in the MDA231 xenograft model or 393N1 syngeneic models of brain metastasis. Data are from n=3 independent experiments, n=8-10 mice per group. All source data from mouse experiments are in Supplementary Information. e,f, Wild type (WT) or T154A mutant (Mut) Cx43 was re-expressed in Cx43-depleted MDA231-BrM2 cells (Cx43 sh2). The cells were subjected to astrocyte dye transfer analysis by flow cytometry (e, 3 independent experiments), or to brain metastasis assays and BLI quantification (f, n=2 independent experiments, 9 mice per group). g, Schematic summary of Cx43- and PCDH7-mediated interactions between cancer cells and astrocytes in brain metastasis.
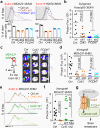
Figure 3. Gap junctions activate STAT1 and NF-κB pathways in cancer cells
a, Signaling pathway analysis of TRAP-Seq data from MDA231-BrM2 cells after co-culture with astrocytes. Control (Ctrl) or Cx43-depleted MDA231-BrM2 cells expressing an L10a-GFP ribosomal protein fusion were co-cultured with astrocytes for 24 h prior to polysome immunoprecipitation and mRNA sequencing. Heatmap depicts blue (down-regulated) and red (up-regulated) pathways. n=2 biological replicates. b,c, STAT1 and NF-κB p65 phosphorylation in MDA231-BrM2 cells after a 2 h incubation with conditioned media (CM) from astrocyte co-culture. CM were collected after 24 h co-culture of astrocytes with control or Cx43-depleted MDA231-BrM2 cells (b), or from Cx43-depleted MDA231-BrM2 cells that were transduced with wild type Cx43 (WT) or Cx43(T154A) mutant (Mut) (c), n≥3 independent experiments both (b) and (c). d, Relative mRNA levels of IFNA and TNFA in human astrocytes re-isolated after co-culture with MDA231-BrM2 cancer cells. All values are mean ± S.E.M. (Data are n=3 biological replicates in 2 independent experiments). e-f, Quantification of BLI signal from brain metastases formed by control or STAT1-knockdown Kras/p53-393N1 cells (e), and SR-IκBα MDA231-BrM2 cells (f) (Data are from n=2 independent experiments, with 12 mice total per group).
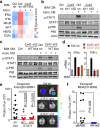
Figure 4. Gap junctions induce cytosolic dsDNA response in astrocytes
a, MDA231-BrM2 cells expressing control shRNA (Ctrl sh) or shRNA targeting Cx43, were cultured for 18 h with or without astrocytes, and subjected to immunobloting analysis of phosphorylated TBK1 and IRF3 (n=3 independent experiments). b, Representative images of dual immunofluorescent staining of IRF3 and GFP. DAPI, nuclear staining. In co-cultures: white arrows, nuclear accumulation of IRF3 in astrocytes; green arrows, even distribution of IRF3 in GFP+ MDA231-BrM2 cells. Scale bar, 20 μm. (n=2 independent experiments). c, Mouse astrocytes (Astro) expressing control shRNA (Ctrl sh) or shRNA targeting STING, were cultured for 18 h with or without LLC BrM cells (BrM), and subjected to immunobloting analysis of phosphorylated IRF3 (c); d, LLC BrM growth in syngeneic C57Bl6 mice hosts wild-type (+/+) or knock-out (−/−) for STING. Quantification of BLI signal from brain metastases formed in +/+ and −/− host mice (e). (n=11 mice in each group; 2 independent experiments). e, MDA231-BrM2 alone, astrocytes alone, or 18 h co-cultures, were harvested for sample preparation and cGAMP analysis by LC-MS/MS. Representative chromatograms (e) and quantitation (f) are presented (n= 5 biological replicates in 3 independent experiments). Refer also to Supplementary Material. g, Human astrocytes (Astro), were cultured for 18 h with or without H2030 BrM cells (BrM) expressing control shRNA (Ctrl sh) or shRNA targeting cGAS, and subjected to immunobloting analysis of phosphorylated IRF3, (2 independent experiments). h, Schematic summary of gap junction mediated anti-dsDNA response, production of IFNα and TNFα in astrocytes, and consequent activation of STAT1 and NF-κB pathways in cancer cells to support brain metastasis.
Figure 5. Inhibition of gap junction activity controls brain metastatic outgrowth
a, Dye transfer from astrocytes to MDA231-BrM2 cells in the presence of the indicated concentrations of Tonabersat (Tona) or meclofenamate (Meclo). (n ≥ 3 independent experiments). b, ELISA of IFNα and TNFα in conditioned media from co-cultured MDA231-BrM2 cell and astrocytes in the presence of Tonabersat (Tona) or meclofenamate (Meclo) ranging from 0.5 – 4 × 10⁻⁴ M Tona or 0.25 – 2 × 10⁻⁴ M Meclo. All graphs shown are mean ± S.E.M. (Data shown from 2 independent experiments with 4 replicates each). c, Tonabersat or meclofenamate was administered daily starting one day after cancer cell inoculation in mice. Brain metastatic lesions were quantified based on BLI. (n=2 independent experiments; 8 mice total per group). d, GFP staining of 14-day brain metastatic lesions. Representative images show large, progressive lesions. DAPI, nuclear staining. Scale Bar, 40μm. (n=10 mice). e,f,g, 14 days after inoculation with MDA231-BrM2 cells transduced with inducible control, CX43 or PCDH7 shRNAs, mice were treated with doxycycline and carboplatin. Representative images of matched ex vivo brain BLI and red fluorescence imaging (e). Brain metastatic lesions were quantified based on BLI (f). (2 independent experiments with n= 10 total mice per group). g, 14 days after inoculation with MDA231-BrM2 cells, mice were treated with Tonabersat, meclofenamate, and carboplatin. Following the indicated regimens, brain metastatic lesions were quantified based on BLI (i). (2 independent experiments with n=9 mice total per group).
Comment in
- Closing the gap: astrocytes and brain metastasis.
Ferraro GB, Kodack DP, Askoxylakis V, Jain RK. Ferraro GB, et al. Cell Res. 2016 Sep;26(9):973-4. doi: 10.1038/cr.2016.96. Epub 2016 Aug 12. Cell Res. 2016. PMID: 27514701 Free PMC article. - Conduits Between Cancer Cells and Astrocytes.
Hoshide R, Jandial R. Hoshide R, et al. Neurosurgery. 2016 Oct;79(4):N16-7. doi: 10.1227/01.neu.0000499708.43467.72. Neurosurgery. 2016. PMID: 27635970 No abstract available.
Similar articles
- Megalencephalic Leukoencephalopathy with Subcortical Cysts Disease-Linked MLC1 Protein Favors Gap-Junction Intercellular Communication by Regulating Connexin 43 Trafficking in Astrocytes.
Lanciotti A, Brignone MS, Belfiore M, Columba-Cabezas S, Mallozzi C, Vincentini O, Molinari P, Petrucci TC, Visentin S, Ambrosini E. Lanciotti A, et al. Cells. 2020 Jun 8;9(6):1425. doi: 10.3390/cells9061425. Cells. 2020. PMID: 32521795 Free PMC article. - AS602801 sensitizes glioma cells to temozolomide and vincristine by blocking gap junction communication between glioma cells and astrocytes.
Zhang S, Gong Y, Wang H, Li Z, Huang Y, Fu X, Xiang P, Fan T. Zhang S, et al. J Cell Mol Med. 2021 Apr;25(8):4062-4072. doi: 10.1111/jcmm.16375. Epub 2021 Feb 20. J Cell Mol Med. 2021. PMID: 33609076 Free PMC article. - Effects on Metabolism in Astrocytes Caused by cGAMP, Which Imitates the Initial Stage of Brain Metastasis.
Okawa T, Hara K, Goto M, Kikuchi M, Kogane M, Hatakeyama H, Tanaka H, Shirane D, Akita H, Hisaka A, Sato H. Okawa T, et al. Int J Mol Sci. 2021 Aug 21;22(16):9028. doi: 10.3390/ijms22169028. Int J Mol Sci. 2021. PMID: 34445736 Free PMC article. - Conflicting Roles of Connexin43 in Tumor Invasion and Growth in the Central Nervous System.
Uzu M, Sin WC, Shimizu A, Sato H. Uzu M, et al. Int J Mol Sci. 2018 Apr 11;19(4):1159. doi: 10.3390/ijms19041159. Int J Mol Sci. 2018. PMID: 29641478 Free PMC article. Review. - Connexin 43 (Cx43) in cancer: Implications for therapeutic approaches via gap junctions.
Bonacquisti EE, Nguyen J. Bonacquisti EE, et al. Cancer Lett. 2019 Feb 1;442:439-444. doi: 10.1016/j.canlet.2018.10.043. Epub 2018 Nov 22. Cancer Lett. 2019. PMID: 30472182 Review.
Cited by
- Old dogs, new trick: classic cancer therapies activate cGAS.
Yum S, Li M, Chen ZJ. Yum S, et al. Cell Res. 2020 Aug;30(8):639-648. doi: 10.1038/s41422-020-0346-1. Epub 2020 Jun 15. Cell Res. 2020. PMID: 32541866 Free PMC article. Review. - 2024 Lasker Award Recipient Zhijian Chen elucidates how DNA stimulates immunity.
Heimberger AB. Heimberger AB. J Clin Invest. 2024 Sep 19;134(19):e186104. doi: 10.1172/JCI186104. J Clin Invest. 2024. PMID: 39295301 Free PMC article. No abstract available. - The role of cGAS in epithelial dysregulation in inflammatory bowel disease and gastrointestinal malignancies.
Ramos A, Bizri N, Novak E, Mollen K, Khan S. Ramos A, et al. Front Pharmacol. 2024 Jul 10;15:1409683. doi: 10.3389/fphar.2024.1409683. eCollection 2024. Front Pharmacol. 2024. PMID: 39050748 Free PMC article. Review. - TBK1-Zyxin signaling controls tumor-associated macrophage recruitment to mitigate antitumor immunity.
Zhou R, Wang M, Li X, Liu Y, Yao Y, Wang A, Chen C, Zhang Q, Wu Q, Zhang Q, Neculai D, Xia B, Shao JZ, Feng XH, Liang T, Zou J, Wang X, Xu P. Zhou R, et al. EMBO J. 2024 Nov;43(21):4984-5017. doi: 10.1038/s44318-024-00244-9. Epub 2024 Sep 20. EMBO J. 2024. PMID: 39304793 Free PMC article. - The spatial transcriptomic landscape of non-small cell lung cancer brain metastasis.
Zhang Q, Abdo R, Iosef C, Kaneko T, Cecchini M, Han VK, Li SS. Zhang Q, et al. Nat Commun. 2022 Oct 10;13(1):5983. doi: 10.1038/s41467-022-33365-y. Nat Commun. 2022. PMID: 36216799 Free PMC article.
References
- Gavrilovic IT, Posner JB. Brain metastases: epidemiology and pathophysiology. J Neurooncol. 2005;75:5–14. - PubMed
- Kienast Y, et al. Real-time imaging reveals the single steps of brain metastasis formation. Nat Med. 2010;16:116–122. - PubMed
Publication types
MeSH terms
Substances
Grants and funding
- U54-163167/PHS HHS/International
- P30 CA008748/CA/NCI NIH HHS/United States
- U54 CA163167/CA/NCI NIH HHS/United States
- P01 CA094060/CA/NCI NIH HHS/United States
- P01-CA129243/CA/NCI NIH HHS/United States
- P01 CA129243/CA/NCI NIH HHS/United States
- K22 CA181470/CA/NCI NIH HHS/United States
LinkOut - more resources
Full Text Sources
Other Literature Sources
Medical
Research Materials
Miscellaneous
