Protein Kinase Mitogen-activated Protein Kinase Kinase Kinase Kinase 4 (MAP4K4) Promotes Obesity-induced Hyperinsulinemia - PubMed (original) (raw)
. 2016 Jul 29;291(31):16221-30.
doi: 10.1074/jbc.M116.718932. Epub 2016 May 20.
Laura V Danai 1, Marina T DiStefano 1, Mark Kelly 2, Lorena Garcia Menendez 1, Agata Jurczyk 1, Rohit B Sharma 3, Dae Young Jung 1, Jong Hun Kim 1, Jason K Kim 4, Rita Bortell 1, Laura C Alonso 3, Michael P Czech 5
Affiliations
- PMID: 27226575
- PMCID: PMC4965570
- DOI: 10.1074/jbc.M116.718932
Protein Kinase Mitogen-activated Protein Kinase Kinase Kinase Kinase 4 (MAP4K4) Promotes Obesity-induced Hyperinsulinemia
Rachel J Roth Flach et al. J Biol Chem. 2016.
Abstract
Previous studies revealed a paradox whereby mitogen-activated protein kinase kinase kinase kinase 4 (Map4k4) acted as a negative regulator of insulin sensitivity in chronically obese mice, yet systemic deletion of Map4k4 did not improve glucose tolerance. Here, we report markedly reduced glucose-responsive plasma insulin and C-peptide levels in whole body Map4k4-depleted mice (M4K4 iKO) as well as an impaired first phase of insulin secretion from islets derived from M4K4 iKO mice ex vivo After long-term high fat diet (HFD), M4K4 iKO mice pancreata also displayed reduced β cell mass, fewer proliferating β cells and reduced islet-specific gene mRNA expression compared with controls, although insulin content was normal. Interestingly, the reduced plasma insulin in M4K4 iKO mice exposed to chronic (16 weeks) HFD was not observed in response to acute HFD challenge or short term treatment with the insulin receptor antagonist S961. Furthermore, the improved insulin sensitivity in obese M4K4 iKO mice was abrogated by high exogenous insulin over the course of a euglycemic clamp study, indicating that hypoinsulinemia promotes insulin sensitivity in chronically obese M4K4 iKO mice. These results demonstrate that protein kinase Map4k4 drives obesity-induced hyperinsulinemia and insulin resistance in part by promoting insulin secretion from β cells in mice.
Keywords: diabetes; insulin; mitogen-activated protein kinase (MAPK); pancreas; pancreatic islet.
© 2016 by The American Society for Biochemistry and Molecular Biology, Inc.
Figures
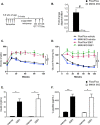
FIGURE 1.
Similar glycemic control in hyperinsulinemic Flox/Flox and M4K4 iKO mice. Map4k4 Flox/Flox or Flox/Flox ubc-ERT2 cre animals were injected with tamoxifen for 5 days at 6–8 weeks of age. After 2 weeks, the mice were placed on chow or a HFD for 16 additional weeks. A, injection scheme. B–D, hyperinsulinemic euglycemic clamps were performed after a HFD for 16 weeks. B, clamp glucose. C, glucose infusion rate. D, hepatic glucose output. E, glucose turnover. (Data are mean ± S.E., n = 4, 6.)
FIGURE 2.
Reduced insulin levels in HFD-fed M4K4 iKO compared with Flox/Flox mice. Control Flox/Flox and M4K4 iKO mice were fed chow or HFD for 4 or 16 weeks post injections. A–E, Flox/Flox and M4K4 iKO mice were fasted overnight, and insulin or C-peptide levels were assessed basally and/or 30′ after 1 g/kg glucose injection. A, chow-fed insulin levels. B, 4 weeks HFD-fed insulin levels. C, 16 weeks HFD-fed insulin levels. D, 16 weeks HFD-fed C-peptide levels. E, plasma glucagon levels in overnight fasted chow- and 16 weeks HFD-fed animals. F, islets were isolated from Flox/Flox control mice, and qRT-PCR was performed for Map4k4 and normalized to 36b4. (n = 6–10, *, p < 0.05; **, p < 0.005; #, p < 0.0001). Data are mean ± S.E.
FIGURE 3.
Acute insulin resistance increases plasma insulin levels in Flox/Flox and M4K4 iKO mice. 3–4 weeks after tamoxifen treatment, chow-fed Flox/Flox and M4K4 iKO mice were treated with 10 nmol of S961 or vehicle for 1 week by minipump. A, experimental timeline. B, islets were isolated on D8, and quantitative RT-PCR was performed for Map4k4 and normalized to 36b4 (#, p < 0.0005; n = 5). C, mice were subjected to an i.p. GTT on day 6. D, mice were subjected to an i.p. ITT on day 7. E, plasma insulin levels were measured after a 4 h fast on day 8. F, plasma C-peptide levels were measured after a 4-h fast on day 8 (*, p < 0.05; **, p < 0.005; n = 5–6 vehicle, 11–12 S961). Data are mean ± S.E.
FIGURE 4.
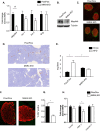
Morphologically normal but reduced pancreatic islet mass in HFD-fed M4K4 iKO mice. A, C–H, Flox/Flox and M4K4 iKO mice were fed HFD for 16 weeks following tamoxifen treatment. A, islets were isolated from HFD-fed mice, and quantitative RT-PCR was performed for the indicated genes and normalized to 36b4 (#, p < 0.0005; n = 10). B, reduced Map4k4 protein expression in whole pancreata derived from chow-fed Flox/Flox and M4K4 iKO mice. Data are representative of Flox/Flox and iKO mice. C, pancreata from HFD-fed mice were stained with insulin (red) and glucagon (green). Representative Flox/Flox and M4K4 iKO islets are shown at 20× magnification. D and E, pancreata were stained for insulin (brown) and hematoxylin (blue). D, representative images from HFD-fed mice. E, quantitation of islet mass as a percentage of total pancreas mass multiplied by pancreas weight. (ANOVA *, p < 0.05; n = 5–12). F and G, pancreata were stained with insulin (red) and Ki67 (green). F, representative islets. G, quantitation of the percentage of Ki67+/insulin+ cells (*, p < 0.05; n = 4–5). H, islets were isolated, and qRT-PCR was performed for the indicated genes and normalized to 36b4 (*, p < 0.05; n = 10). Data are mean ± S.E.
FIGURE 5.
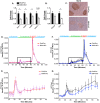
Reduced isletspecific gene expression and insulin secretion in M4K4 iKO islets. Flox/Flox and M4K4 iKO mice were fed HFD for 16 weeks following tamoxifen treatment. A and B, islets were isolated, and quantitative RT-PCR was performed for the indicated genes and normalized to 36b4 (*, p < 0.05; n = 10). C, pancreata were isolated and immunostained for Maf-A. Data are representative of 4 per genotype. D–G, islets were isolated, and glucose-induced insulin secretion was performed. Insulin levels are shown from isolated islets in response to 20 m
m
glucose and KCl as a percentage of total insulin released upon KCl treatment. D and E, chow fed animals, E, higher magnification of square box from D. F and G, HFD-fed animals. G, higher magnification of square box from F (*, p < 0.05; n = 4). Data are mean ± S.E.
Similar articles
- Role of Mitogen-Activated Protein Kinase Kinase Kinase Kinase 4 Signaling in Liver and Metabolic Diseases.
Ampadu F, Awasthi V, Joshi AD. Ampadu F, et al. J Pharmacol Exp Ther. 2024 Jul 18;390(2):233-239. doi: 10.1124/jpet.124.002065. J Pharmacol Exp Ther. 2024. PMID: 38844365 Review. - Inducible Deletion of Protein Kinase Map4k4 in Obese Mice Improves Insulin Sensitivity in Liver and Adipose Tissues.
Danai LV, Flach RJ, Virbasius JV, Menendez LG, Jung DY, Kim JH, Kim JK, Czech MP. Danai LV, et al. Mol Cell Biol. 2015 Jul;35(13):2356-65. doi: 10.1128/MCB.00150-15. Mol Cell Biol. 2015. PMID: 25918248 Free PMC article. - A2A adenosine receptors control pancreatic dysfunction in high-fat-diet-induced obesity.
Csóka B, Törő G, Vindeirinho J, Varga ZV, Koscsó B, Németh ZH, Kókai E, Antonioli L, Suleiman M, Marchetti P, Cseri K, Deák Á, Virág L, Pacher P, Bai P, Haskó G. Csóka B, et al. FASEB J. 2017 Nov;31(11):4985-4997. doi: 10.1096/fj.201700398R. Epub 2017 Aug 1. FASEB J. 2017. PMID: 28765173 Free PMC article. - Insulin hypersecretion in islets from diet-induced hyperinsulinemic obese female mice is associated with several functional adaptations in individual β-cells.
Gonzalez A, Merino B, Marroquí L, Ñeco P, Alonso-Magdalena P, Caballero-Garrido E, Vieira E, Soriano S, Gomis R, Nadal A, Quesada I. Gonzalez A, et al. Endocrinology. 2013 Oct;154(10):3515-24. doi: 10.1210/en.2013-1424. Epub 2013 Jul 18. Endocrinology. 2013. PMID: 23867214 - MAP4K4 and cancer: ready for the main stage?
González-Montero J, Rojas CI, Burotto M. González-Montero J, et al. Front Oncol. 2023 May 8;13:1162835. doi: 10.3389/fonc.2023.1162835. eCollection 2023. Front Oncol. 2023. PMID: 37223681 Free PMC article. Review.
Cited by
- Role of Mitogen-Activated Protein Kinase Kinase Kinase Kinase 4 Signaling in Liver and Metabolic Diseases.
Ampadu F, Awasthi V, Joshi AD. Ampadu F, et al. J Pharmacol Exp Ther. 2024 Jul 18;390(2):233-239. doi: 10.1124/jpet.124.002065. J Pharmacol Exp Ther. 2024. PMID: 38844365 Review. - Species-specific roles for the MAFA and MAFB transcription factors in regulating islet β cell identity.
Cha J, Tong X, Walker EM, Dahan T, Cochrane VA, Ashe S, Russell R, Osipovich AB, Mawla AM, Guo M, Liu JH, Loyd ZA, Huising MO, Magnuson MA, Hebrok M, Dor Y, Stein R. Cha J, et al. JCI Insight. 2023 Aug 22;8(16):e166386. doi: 10.1172/jci.insight.166386. JCI Insight. 2023. PMID: 37606041 Free PMC article. - Molecular Genetics of Abnormal Redox Homeostasis in Type 2 Diabetes Mellitus.
Azarova I, Polonikov A, Klyosova E. Azarova I, et al. Int J Mol Sci. 2023 Mar 1;24(5):4738. doi: 10.3390/ijms24054738. Int J Mol Sci. 2023. PMID: 36902173 Free PMC article. Review. - Central Nervous System Control of Glucose Homeostasis: A Therapeutic Target for Type 2 Diabetes?
Mirzadeh Z, Faber CL, Schwartz MW. Mirzadeh Z, et al. Annu Rev Pharmacol Toxicol. 2022 Jan 6;62:55-84. doi: 10.1146/annurev-pharmtox-052220-010446. Annu Rev Pharmacol Toxicol. 2022. PMID: 34990204 Free PMC article. Review. - The Limited Role of Glucagon for Ketogenesis During Fasting or in Response to SGLT2 Inhibition.
Capozzi ME, Coch RW, Koech J, Astapova II, Wait JB, Encisco SE, Douros JD, El K, Finan B, Sloop KW, Herman MA, D'Alessio DA, Campbell JE. Capozzi ME, et al. Diabetes. 2020 May;69(5):882-892. doi: 10.2337/db19-1216. Epub 2020 Jan 31. Diabetes. 2020. PMID: 32005706 Free PMC article.
References
- Cryer P. E. (1981) Glucose counterregulation in man. Diabetes 30, 261–264 - PubMed
- Weir G. C., and Bonner-Weir S. (2004) Five stages of evolving beta-cell dysfunction during progression to diabetes. Diabetes 53, S16–21 - PubMed
MeSH terms
Substances
Grants and funding
- R01 DK095140/DK/NIDDK NIH HHS/United States
- U24 DK093000/DK/NIDDK NIH HHS/United States
- R37 DK030898/DK/NIDDK NIH HHS/United States
- U2C DK093000/DK/NIDDK NIH HHS/United States
- R01 DK030898/DK/NIDDK NIH HHS/United States
- R01 DK080756/DK/NIDDK NIH HHS/United States
LinkOut - more resources
Full Text Sources
Other Literature Sources
Medical
Molecular Biology Databases
Miscellaneous


