Interactions among Lung Cancer Cells, Fibroblasts, and Macrophages in 3D Co-Cultures and the Impact on MMP-1 and VEGF Expression - PubMed (original) (raw)
Interactions among Lung Cancer Cells, Fibroblasts, and Macrophages in 3D Co-Cultures and the Impact on MMP-1 and VEGF Expression
Xiao-Qing Liu et al. PLoS One. 2016.
Abstract
In vitro cell-based models of lung cancer are frequently employed to study invasion and the mechanisms behind metastasis. However, these models often study only one cell type with two-dimensional (2D) monolayer cell cultures, which do not accurately reflect the complexity of inflammation in vivo. Here, a three-dimensional (3D) cell co-culture collagen gel model was employed, containing human lung adenocarcinoma cells (HCC), human lung fibroblast cells (MRC-5), and macrophages. Cell culture media and cell images were collected, and matrix metalloproteinase-1 (MMP-1) and vascular endothelial growth factor (VEGF) production was monitored under different cell culture conditions. We found that simulating hypoxia and/or serum starvation conditions induced elevated secretion of VEGF in the 3D co-culture model in vitro, but not MMP-1; the morphology of HCC in the 2D versus the 3D co-culture system was extremely different. MMP-1 and VEGF were secreted at higher levels in mixed cell groups rather than mono-culture groups. Therefore, incorporating lung cancer cells, fibroblasts, and macrophages may better reflect physiological metastasis mechanisms compared to mono-culture systems. Tumour stromal cells, macrophages, and fibroblast cells may promote invasion and metastasis, which also provides a new direction for the design of therapies targeted at destroying the stroma of tumor tissues.
Conflict of interest statement
Competing Interests: The authors have declared that no competing interests exist.
Figures
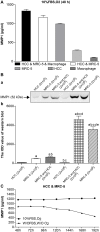
Fig 1. The expression of MMP1.
(A) Expression of MMP-1 in 3D mono- and co-culture lung cancer models at 48 h detected by ELISA. The expression of MMP1 in HCC & MRC-5 & macrophage co-culture group was higher than that in HCC & MRC-5 co-culture group, or MRC-5/HCC/macrophage mono-culture groups. There was almost no expression of MMP1 in the HCC/macrophage mono-culture group. (B) Expression of MMP-1 in 3D mono- and co-culture lung cancer model at 48 h detected by Western blotting. In Fig 1B, a, the molecular weight of MMP-1 is 52 kD. From the left to right, the lanes are: HCC mono-culture group (2 x 10⁵ cells); MRC-5 mono-culture group (2 x 10⁵ cells); MRC-5 and HCC co-culture group (2 x10⁵ cells); HCC mono-culture group (1 x 10⁶ cells); MRC-5 and HCC co-culture group (1 x 10⁶ cells); MRC-5 mono-culture group (1 x 10⁶ cells). Expression of MMP-1 in co-culture groups was higher than in mono-culture groups (both 2 x 10⁵ cells and 1 x 10⁶ cells). Expression of MMP-1 in the 1 x 10⁶ cell group was higher than the 2 x 10⁵ cell group, regardless of mono-culture or co-culture group designations. In Fig 1B, b, the mean IOD values of the Western blot are shown. (C) Expression of MMP-1 under different co-culture conditions. Expression of MMP1 under 10% FBS and O2 (10% FBS cell culture medium with O2) was higher than that under w/o FBS and w/o O2 (without FBS and without O2) at 7 different time points. Furthermore, the expression trend of MMP1 under the condition of w/o FBS and w/o O2 continued to decline from 120 h.
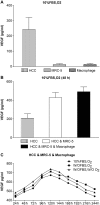
Fig 2. The expression of VEGF.
(A) Expression of VEGF in HCC, MRC-5, and macrophage mono-cultures groups. Expression of VEGF in the HCC mono-culture group was significantly higher than expression in the MRC-5/macrophage mono-culture group under 10% FBS and O2 culture conditions. (B) Expression of VEGF in HCC, MRC-5, and macrophage co-culture groups compared with the HCC mono-culture group. Expression of VEGF in the HCC & MRC-5 & Macrophage co-culture group was higher than in the HCC & MRC-5 co-culture group and the HCC mono-culture group cultured with 10% FBS and O2 for 48 h. (C) Expression of VEGF in HCC, MRC-5, and macrophage co-culture groups under different co-culture conditions. The expression of VEGF in cells cultured w/o FBS (starved of FBS but with O2), w/o FBS and w/o O2 (without FBS and without O2) was higher than that in 10% FBS or O2 (10% FBS cell culture medium with O2), while the expression of VEGF in the three different conditions first increased and then decreased.
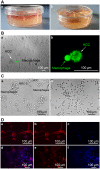
Fig 3
(A) 3D collagen co-culture model. Fig 3A,a: 1.0 ml cell culture medium permeated into the collagen gel from the top, and the cultivated cells were suspended in the 3D collagen gel space within. Fig 3A,b: 0.5ml collagen gel was firmed in every culture dish compartment independently. (B) Cell morphologies in 2D and 3D co-culture models at 48 h. Fig 3B,a: Image of HCC cells and macrophages in 2D co-culture model. Arrowhead denotes an HCC cell, which is flat and non-spherical. Arrowhead denotes macrophages surrounding an HCC cell at 40X magnification. Fig 3B,b: Image of HCC cells and macrophages in our 3D co-culture model. Arrowhead denotes an HCC cell, which is subglobose and prickly. Arrowhead denotes a macrophage. This image shows that these cells are in contact with one another, as viewed using CFDA SE Tracker on a confocal microscope. (C) Images of HCC, MRC-5, and macrophage co-cultures at 48 and 168 h at 40X magnification. Fig 3C,a: Macrophages contact and attack HCC cells after 48 h of co-culture. Arrowheads denote HCC, macrophage, and MRC-5 cells. Fig 3C,b: Co-culture after 7 days. As seen in this image after 7 days of culture, the cells began to detach and float in the medium, having lost their vitality and normal cell morphology. Most HCC and macrophage cells were dead. (D) Fluorescence microscope images of MRC-5, macrophage, and HCC in 3D model. Fig 3D (upper): Fluorescence microscope images of MRC-5, macrophage, and HCC cultures (Fig 3D,a). Cells were stained with DAPI (Fig 3D, c) and phallotoxins (Fig 3D, b). Fig 3D (lower): Fluorescence microscope images of Macrophages (Fig 3D,d). Cells were stained by DAPI (Fig 3D, f) and phallotoxins (Fig 3D, e).
Similar articles
- Regulation of matrix metalloproteinase secretion by green tea catechins in a three-dimensional co-culture model of macrophages and gingival fibroblasts.
Morin MP, Grenier D. Morin MP, et al. Arch Oral Biol. 2017 Mar;75:89-99. doi: 10.1016/j.archoralbio.2016.10.035. Epub 2016 Nov 2. Arch Oral Biol. 2017. PMID: 27825679 - Correlation between matrix metalloproteinase-9 and vascular endothelial growth factor expression in lung adenocarcinoma.
Wen YL, Li L. Wen YL, et al. Genet Mol Res. 2015 Dec 29;14(4):19342-8. doi: 10.4238/2015.December.29.44. Genet Mol Res. 2015. PMID: 26782587 - Changes in the gene expression of co-cultured human fibroblast cells and osteosarcoma cells: the role of microenvironment.
Salvatore V, Focaroli S, Teti G, Mazzotti A, Falconi M. Salvatore V, et al. Oncotarget. 2015 Oct 6;6(30):28988-98. doi: 10.18632/oncotarget.4902. Oncotarget. 2015. PMID: 26418748 Free PMC article. - Understanding fibroblast-immune cell interactions via co-culture models and their role in asthma pathogenesis.
Thiam F, Yazeedi SA, Feng K, Phogat S, Demirsoy E, Brussow J, Abokor FA, Osei ET. Thiam F, et al. Front Immunol. 2023 Feb 23;14:1128023. doi: 10.3389/fimmu.2023.1128023. eCollection 2023. Front Immunol. 2023. PMID: 36911735 Free PMC article. Review. - 3D Coculture between Cancer Cells and Macrophages: From Conception to Experimentation.
Quoniou R, Moreau E, Cachin F, Miot-Noirault E, Chautard E, Peyrode C. Quoniou R, et al. ACS Biomater Sci Eng. 2024 Jan 8;10(1):313-325. doi: 10.1021/acsbiomaterials.3c01437. Epub 2023 Dec 18. ACS Biomater Sci Eng. 2024. PMID: 38110331 Review.
Cited by
- Multicellular tumor spheroid model to study the multifaceted role of tumor-associated macrophages in PDAC.
Bidan N, Dunsmore G, Ugrinic M, Bied M, Moreira M, Deloménie C, Ginhoux F, Blériot C, de la Fuente M, Mura S. Bidan N, et al. Drug Deliv Transl Res. 2024 Aug;14(8):2085-2099. doi: 10.1007/s13346-023-01479-5. Epub 2023 Dec 7. Drug Deliv Transl Res. 2024. PMID: 38062286 - Co-Culture Device for in vitro High Throughput Analysis of Cancer-Associated Fibroblast and Cancer Cell Interactions.
Germain A, Kim YT. Germain A, et al. Oncology. 2024;102(6):515-524. doi: 10.1159/000533773. Epub 2023 Nov 25. Oncology. 2024. PMID: 38008083 Free PMC article. - Downregulation of VEGFR2 signaling by cedrol abrogates VEGF‑driven angiogenesis and proliferation of glioblastoma cells through AKT/P70S6K and MAPK/ERK1/2 pathways.
Chang KF, Liu CY, Huang YC, Hsiao CY, Tsai NM. Chang KF, et al. Oncol Lett. 2023 Jun 22;26(2):342. doi: 10.3892/ol.2023.13928. eCollection 2023 Aug. Oncol Lett. 2023. PMID: 37427338 Free PMC article. - Stromal Co-Cultivation for Modeling Breast Cancer Dormancy in the Bone Marrow.
Wieder R. Wieder R. Cancers (Basel). 2022 Jul 9;14(14):3344. doi: 10.3390/cancers14143344. Cancers (Basel). 2022. PMID: 35884405 Free PMC article. Review. - Tumor Cells Modulate Macrophage Phenotype in a Novel In Vitro Co-Culture Model of the NSCLC Tumor Microenvironment.
Park JV, Chandra R, Cai L, Ganguly D, Li H, Toombs JE, Girard L, Brekken RA, Minna JD. Park JV, et al. J Thorac Oncol. 2022 Oct;17(10):1178-1191. doi: 10.1016/j.jtho.2022.06.011. Epub 2022 Jul 5. J Thorac Oncol. 2022. PMID: 35798240 Free PMC article.
References
- Parkin DM, Bray F, Ferlay J, Pisani P. Global cancer statistics, 2002. CA: a cancer journal for clinicians. 2005;55(2):74–108. . - PubMed
- International Agency for Research on Cancer W. lung cancer incidence and mortality worldwide in 2008. Globocan 2008 Cancer Fact Sheet. 2008.
- Langer CJ, Besse B, Gualberto A, Brambilla E, Soria JC. The evolving role of histology in the management of advanced non-small-cell lung cancer. Journal of clinical oncology: official journal of the American Society of Clinical Oncology. 2010;28(36):5311–20. 10.1200/JCO.2010.28.8126 . - DOI - PubMed
MeSH terms
Substances
Grants and funding
The authors have no support or funding to report.
LinkOut - more resources
Full Text Sources
Other Literature Sources
Medical


