Diverse roles of assembly factors revealed by structures of late nuclear pre-60S ribosomes - PubMed (original) (raw)
. 2016 Jun 2;534(7605):133-7.
doi: 10.1038/nature17942. Epub 2016 May 25.
Beril Tutuncuoglu 2, Kaige Yan 1, Hailey Brown 2, Yixiao Zhang 1, Dan Tan 3 4, Michael Gamalinda 2, Yi Yuan 1, Zhifei Li 1, Jelena Jakovljevic 2, Chengying Ma 1, Jianlin Lei 1, Meng-Qiu Dong 3 4, John L Woolford Jr 2, Ning Gao 1
Affiliations
- PMID: 27251291
- PMCID: PMC5237361
- DOI: 10.1038/nature17942
Diverse roles of assembly factors revealed by structures of late nuclear pre-60S ribosomes
Shan Wu et al. Nature. 2016.
Abstract
Ribosome biogenesis is a highly complex process in eukaryotes, involving temporally and spatially regulated ribosomal protein (r-protein) binding and ribosomal RNA remodelling events in the nucleolus, nucleoplasm and cytoplasm. Hundreds of assembly factors, organized into sequential functional groups, facilitate and guide the maturation process into productive assembly branches in and across different cellular compartments. However, the precise mechanisms by which these assembly factors function are largely unknown. Here we use cryo-electron microscopy to characterize the structures of yeast nucleoplasmic pre-60S particles affinity-purified using the epitope-tagged assembly factor Nog2. Our data pinpoint the locations and determine the structures of over 20 assembly factors, which are enriched in two areas: an arc region extending from the central protuberance to the polypeptide tunnel exit, and the domain including the internal transcribed spacer 2 (ITS2) that separates 5.8S and 25S ribosomal RNAs. In particular, two regulatory GTPases, Nog2 and Nog1, act as hub proteins to interact with multiple, distant assembly factors and functional ribosomal RNA elements, manifesting their critical roles in structural remodelling checkpoints and nuclear export. Moreover, our snapshots of compositionally and structurally different pre-60S intermediates provide essential mechanistic details for three major remodelling events before nuclear export: rotation of the 5S ribonucleoprotein, construction of the active centre and ITS2 removal. The rich structural information in our structures provides a framework to dissect molecular roles of diverse assembly factors in eukaryotic ribosome assembly.
Conflict of interest statement
The authors declare no competing financial interests.
Figures
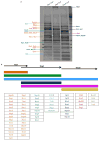
Extended Data Figure 1. Compositional analysis of Nsa1, Nog2 and Nmd3 particles
a, Mostly non-overlapping assembly factors Nsa1, Nog2 and Nmd3 were used to purify sequential ribosome assembly intermediates. Proteins identified by mass spectrometry analysis were marked on the gel. Orange coloured proteins are only present in Nsa1-TAP particles, green coloured proteins are present both in Nsa1-TAP and in Nog2-TAP particles, light blue coloured proteins are present in all three purified particles to varying levels, dark blue coloured proteins are present only in Nog2-particles, pink coloured proteins are present both in Nog2- and Nmd3-particles in varying levels and yellow coloured proteins are present only in Nmd3-particles. TAP-tagged proteins are indicated by white asterisks. For gel source data, see Supplementary Fig. 1. b, The lifetimes of mostly non-overlapping ribosome assembly intermediates containing assembly factors Nsa1, Nog2 and Nmd3 are indicated. Assembly factors identified in each of Nsa1-TAP, Nog2-TAP and Nmd3-TAP associated samples were colour coded. The colour scheme is identical to that used in **a. ***Even though this protein was identified in all three intermediates, its levels decreased more than sevenfold from Nsa1-TAP particles to Nog2-TAP particles.
Extended Data Figure 2. Cryo-EM data processing of Nog2-particles
a, Representative 2D class averages of Nog2-particles. b, A flow-chart for 3D classification of Nog2-particles (data batch 8–10, see Methods for details).
Extended Data Figure 3. Resolution estimation and model validation
a, Representative micrograph of Nog2-particles. b, Local resolution map of the final density map of state 1. c, FSC curve for the final density map (state 1). The nominal resolution is 3.08 Å estimated using the gold-standard (FSC = 0.143) criterion. d, Atomic model cross-validation. Three FSC curves were calculated between the refined model (against Half1 map) and the final map (black), between the refined model with Half1 map (FSCwork, red), and between the refined model with Half2 map (FSCtest, blue) (see Methods for details).
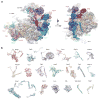
Extended Data Figure 4. Local densities of representative regions for different assembly factors
a–l, Cryo-EM densities of representative regions of assembly factors, superimposed with respective atomic models.
Extended Data Figure 5. Interaction network of Nog2 in the pre-60S particle
a–g, Pairwise illustration of binding partners of Nog2 in the pre-60S particle. Residues of Nog2 involved in atomic contacts are coloured red with residue numbers labelled. H and L denote helix and loop, respectively. h, Interactions between rRNA components (H43, H68, H74, H75, H86, H92, H93) and Nog2. For clarification, H69 and H71 are not shown. The N terminus of Nog2 is located in a helical junction composed of H68, H74, H75 and H93.
Extended Data Figure 6. The NTD of Nog1 interacts with Nsa2 and Nog2
a, Nsa2, Nog2 and Nog1 collectively stabilize H89 in a distinct conformation. Nog1 interacts with Nog2 and Nsa2 through its GTPase domain and NTD, respectively. b, The CTE of Nog1 interlocks with Rlp24 by wrapping around a long helix at the C-terminal end of Rlp24 (see also Fig. 3). c, d, Comparison of the CTE of Nog1 and the CTE of Rei1 in the polypeptide tunnel. Atomic models of state 1 (c) and 60S-Arx1–Alb1–Rei1 (d) (PDB accession number 5APN) are aligned using the 60S subunit. For clarification, only Arx1, Nog1 and Rei1 are shown. e, Superimposition of c and d. Four major places of steric clash between Rei1 and Nog1 are marked by asterisks.
Extended Data Figure 7. Mutual interactions between factors and r-proteins in the ITS2 subcomplex
a, An overall view of the ITS2 subcomplex. b–d, L8 interacts with three factors: Nop15 (b), Cic1 (c) and Nop7 (d). e, L27 interacts with Nop53. f–h, L25 interacts with Rlp7 (f), Nop15 (g) and Nop53 (h). Residues involved in atomic interaction sites are labelled with sequence numbers. H, L, S denote helix, loop and strand of respective structures.
Extended Data Figure 8. Restructuring of rRNA helices in the central protuberance region by Nsa2, Rpf2, Rsa4, Rrs1 and Nog2
a, Conformation of rRNA helices from the central protuberance (H80, H82-H88, 5S rRNA) in the pre-60S particle (state 1). b, Same as a, but for the mature 60S subunit. The mature 60S subunit was aligned to state 1 structure globally. c–g, Pairwise interactions between the central protuberance helices and factors are shown in separate panels.
Extended Data Figure 9. Structures of different assembly states of the pre-60S ribosomal particles
a, Cryo-EM density maps of three premature states (1–3) and the mature state are displayed in transparent surface representation, superimposed with models of the 5S RNA, H38 and associated central-protuberance-binding factors. b, Zoom-in views of the central protuberance regions in a. For clarification, only atomic models are shown. Comparison of these four states indicates that the 5S RNP rotates to a near-mature state (state 2) after Rpf2–Rrs1 leave, and further release of Rsa4 in state 3 results in a ‘mature-like’ conformation for the 5S RNP. H38 from these four states is in a series of continuous changes coupled with the 5S RNP conformational maturation. c, d, Spatial relationship of the 5S RNP, H38, Rsa4 and Cgr1 in state 1 (c) and state 2 (d). Note that repositioning of H38 from state 1 to state 2 is coupled with a dramatic conformational change on the C-terminal end of Cgr1. e–h, Additional assembly factors identified in the density map of state 2. One piece of additional density between H38 and L1 contains a characteristic HEAT repeat, which contacts the L1 stalk in an inward position (e). The atomic model of Sda1 (PDB accession number 5FL8) fits well with the segmented density (f). For clarification, densities immediately above Sda1 are not shown in e and f. A large piece of additional density in the map of state 2, composed of the Rix1 subcomplex and Rea1 (g, h). The density assignment was facilitated by the cryo-EM structure of Rix1–Rea1 particles. Superimposition of the atomic model of Rea1 (PDB accession number 5FL8) with the segmented density map of Rea1 (h).
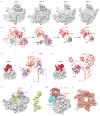
Figure 1. Cryo-EM structure (state 1) of the pre-60S particle purified from epitope-tagged Nog2
a, The 3.08-Å cryo-EM map of state 1 is displayed in surface representation, with density of each assembly factor separately coloured. The 25S rRNA and r-proteins are coloured grey and beige, respectively. Both the intersubunit (left) and side (right) views are shown. b, Atomic models of 19 well-resolved assembly factors (coloured as in a) superimposed with their segmented cryo-EM densities (transparent grey).
Figure 2. Structure of Nog2 and its remodelling role in central helices H69–H71
a, Atomic structure of Nog2 (2–472 amino acids) with domains separately coloured, highlighting the N-terminal extension of Nog2. The orientation of Nog2 in the pre-60S particle is shown in the left thumbnail. b, Local resolution map of Nog2. Segmented Nog2 density map is coloured according to the scale bar below. c, Zoom-in view of the H69–H71 region in the map of state 1, superimposed with atomic models of Nog2, H69 and H71. d, Same as c, but for the density map of the mature 60S subunit. e, Comparison of H69–H71 in the two density maps.
Figure 3. Structure and binding partners of Nog1
a, The NTD of Nog1 inserts directly into the two strands of H89. GD, GTPase domain. b, Superimposition of the NTD of Nog1 with H89 in its mature conformation, displaying a steric clash in the terminal tip of the NTD of Nog1. c, Structural comparison of H89 in the pre-60S and mature conformations. d, The CTE of Nog1 interacts with multiple assembly factors (Tif6, Rlp24, Arx1) and r-proteins (L3, L31, L22, L19, L35) in an arc region of the pre-60S particle. The overview is shown in the left thumbnail. The position and direction of polypeptide tunnel exit is denoted by a black diamond. e, The last C-terminal portion of Nog1 goes into the polypeptide tunnel and interacts with L4, L17, and L39 (see also Extended Data Fig. 6).
Figure 4. Structure of ITS2 and associated factors
a, Secondary structure of the partial ITS2 rRNA sequences resolved in the map of state 1. b, Atomic model of the partial ITS2 rRNA. c, Same as b, with density map superimposed. d, Three consecutively rotated views of ITS2 and associated factors. The orientation of the ITS2 subcomplex in the density map of state 1 is shown in the leftmost thumbnail.
Similar articles
- Atomic modeling of the ITS2 ribosome assembly subcomplex from cryo-EM together with mass spectrometry-identified protein-protein crosslinks.
Wu S, Tan D, Woolford JL Jr, Dong MQ, Gao N. Wu S, et al. Protein Sci. 2017 Jan;26(1):103-112. doi: 10.1002/pro.3045. Epub 2016 Oct 13. Protein Sci. 2017. PMID: 27643814 Free PMC article. - 60S ribosome biogenesis requires rotation of the 5S ribonucleoprotein particle.
Leidig C, Thoms M, Holdermann I, Bradatsch B, Berninghausen O, Bange G, Sinning I, Hurt E, Beckmann R. Leidig C, et al. Nat Commun. 2014 Mar 24;5:3491. doi: 10.1038/ncomms4491. Nat Commun. 2014. PMID: 24662372 - Structural insights into assembly of the ribosomal nascent polypeptide exit tunnel.
Wilson DM, Li Y, LaPeruta A, Gamalinda M, Gao N, Woolford JL Jr. Wilson DM, et al. Nat Commun. 2020 Oct 9;11(1):5111. doi: 10.1038/s41467-020-18878-8. Nat Commun. 2020. PMID: 33037216 Free PMC article. - Insights into remodeling events during eukaryotic large ribosomal subunit assembly provided by high resolution cryo-EM structures.
Biedka S, Wu S, LaPeruta AJ, Gao N, Woolford JL Jr. Biedka S, et al. RNA Biol. 2017 Oct 3;14(10):1306-1313. doi: 10.1080/15476286.2017.1297914. Epub 2017 Mar 7. RNA Biol. 2017. PMID: 28267408 Free PMC article. Review. - Principles of 60S ribosomal subunit assembly emerging from recent studies in yeast.
Konikkat S, Woolford JL Jr. Konikkat S, et al. Biochem J. 2017 Jan 15;474(2):195-214. doi: 10.1042/BCJ20160516. Biochem J. 2017. PMID: 28062837 Free PMC article. Review.
Cited by
- The nucleolus as a polarized coaxial cable in which the rDNA axis is surrounded by dynamic subunit-specific phases.
Tartakoff AM, Chen L, Raghavachari S, Gitiforooz D, Dhinakaran A, Ni CL, Pasadyn C, Mahabeleshwar GH, Pasadyn V, Woolford JL Jr. Tartakoff AM, et al. Curr Biol. 2021 Jun 21;31(12):2507-2519.e4. doi: 10.1016/j.cub.2021.03.041. Epub 2021 Apr 15. Curr Biol. 2021. PMID: 33862007 Free PMC article. - Coevolution of ribosomal RNA expansion segment 7L and assembly factor Noc2p specializes the ribosome biogenesis pathway between Saccharomyces cerevisiae and Candida albicans.
Wang X, Yue Z, Xu F, Wang S, Hu X, Dai J, Zhao G. Wang X, et al. Nucleic Acids Res. 2021 May 7;49(8):4655-4667. doi: 10.1093/nar/gkab218. Nucleic Acids Res. 2021. PMID: 33823547 Free PMC article. - The World of Stable Ribonucleoproteins and Its Mapping With Grad-Seq and Related Approaches.
Gerovac M, Vogel J, Smirnov A. Gerovac M, et al. Front Mol Biosci. 2021 Apr 7;8:661448. doi: 10.3389/fmolb.2021.661448. eCollection 2021. Front Mol Biosci. 2021. PMID: 33898526 Free PMC article. Review. - Structural and mechanistic insights into ribosomal ITS2 RNA processing by nuclease-kinase machinery.
Chen J, Chen H, Li S, Lin X, Hu R, Zhang K, Liu L. Chen J, et al. Elife. 2024 Jan 5;12:RP86847. doi: 10.7554/eLife.86847. Elife. 2024. PMID: 38180340 Free PMC article. - The Npa1p complex chaperones the assembly of the earliest eukaryotic large ribosomal subunit precursor.
Joret C, Capeyrou R, Belhabich-Baumas K, Plisson-Chastang C, Ghandour R, Humbert O, Fribourg S, Leulliot N, Lebaron S, Henras AK, Henry Y. Joret C, et al. PLoS Genet. 2018 Aug 31;14(8):e1007597. doi: 10.1371/journal.pgen.1007597. eCollection 2018 Aug. PLoS Genet. 2018. PMID: 30169518 Free PMC article.
References
Publication types
MeSH terms
Substances
LinkOut - more resources
Full Text Sources
Other Literature Sources
Molecular Biology Databases


