Genomic Copy Number Dictates a Gene-Independent Cell Response to CRISPR/Cas9 Targeting - PubMed (original) (raw)
doi: 10.1158/2159-8290.CD-16-0154. Epub 2016 Jun 3.
Robin M Meyers 2, Barbara A Weir 3, Francisca Vazquez 3, Cheng-Zhong Zhang 3, Uri Ben-David 2, April Cook 3, Gavin Ha 3, William F Harrington 2, Mihir B Doshi 3, Maria Kost-Alimova 2, Stanley Gill 3, Han Xu 2, Levi D Ali 2, Guozhi Jiang 2, Sasha Pantel 2, Yenarae Lee 2, Amy Goodale 2, Andrew D Cherniack 2, Coyin Oh 2, Gregory Kryukov 3, Glenn S Cowley 2, Levi A Garraway 4, Kimberly Stegmaier 5, Charles W Roberts 6, Todd R Golub 7, Matthew Meyerson 8, David E Root 2, Aviad Tsherniak 9, William C Hahn 10
Affiliations
- PMID: 27260156
- PMCID: PMC4972686
- DOI: 10.1158/2159-8290.CD-16-0154
Genomic Copy Number Dictates a Gene-Independent Cell Response to CRISPR/Cas9 Targeting
Andrew J Aguirre et al. Cancer Discov. 2016 Aug.
Abstract
The CRISPR/Cas9 system enables genome editing and somatic cell genetic screens in mammalian cells. We performed genome-scale loss-of-function screens in 33 cancer cell lines to identify genes essential for proliferation/survival and found a strong correlation between increased gene copy number and decreased cell viability after genome editing. Within regions of copy-number gain, CRISPR/Cas9 targeting of both expressed and unexpressed genes, as well as intergenic loci, led to significantly decreased cell proliferation through induction of a G2 cell-cycle arrest. By examining single-guide RNAs that map to multiple genomic sites, we found that this cell response to CRISPR/Cas9 editing correlated strongly with the number of target loci. These observations indicate that genome targeting by CRISPR/Cas9 elicits a gene-independent antiproliferative cell response. This effect has important practical implications for the interpretation of CRISPR/Cas9 screening data and confounds the use of this technology for the identification of essential genes in amplified regions.
Significance: We found that the number of CRISPR/Cas9-induced DNA breaks dictates a gene-independent antiproliferative response in cells. These observations have practical implications for using CRISPR/Cas9 to interrogate cancer gene function and illustrate that cancer cells are highly sensitive to site-specific DNA damage, which may provide a path to novel therapeutic strategies. Cancer Discov; 6(8); 914-29. ©2016 AACR.See related commentary by Sheel and Xue, p. 824See related article by Munoz et al., p. 900This article is highlighted in the In This Issue feature, p. 803.
2016 American Association for Cancer Research.
Conflict of interest statement
Conflict of Interest Disclosure: Levi A. Garraway and William C. Hahn are consultants for Novartis. Matthew Meyerson receives research support from Bayer.
Figures
Figure 1
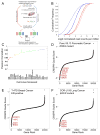
Genome scale loss-of-function CRISPR-Cas9 screening in cancer cell lines. (A) Schematic of the pooled screening process. (B) Cumulative frequency of log2 normalized read counts per million to 1000 non-targeting sgRNA controls (red) and sgRNAs targeting 213 positive control genes (KEGG ribosome, proteasome and spliceosome subsets, Table S2) (blue) in both the initial DNA reference pool (dotted) and 28 d after transduction in the PANC-1 cell line (solid). (C) A boxplot of Pearson correlation between replicates (y-axis) plotted for each cell line (x-axis) shows the range of replicate-replicate correlations after quality control (Methods). (D, E, F) Rank ordered depiction of second-best CRISPR guide scores for each gene in the Panc 08.13 (D), T47D (E) and CORL105 (F) cell lines. Hallmark cancer-relevant oncogene and non-oncogene dependencies are depicted in red for each cell line.
Figure 2
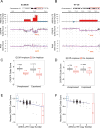
Genome scale CRISPR-Cas9 screening identifies a strong correlation between copy number and sensitivity to CRISPR-Cas9 genome editing. Two cell lines are shown: SU86.86 (A, C, E) and HT29 (B, D, F). (A) Chromosome 19q amplicon in SU86.86 and (B) chromosome 8q amplicon in HT29: Three tracks are plotted along genomic coordinates within the region defined the red box on the chromosome schematic. Top: ABSOLUTE genomic copy number from Cancer Cell Line Encyclopedia (CCLE) SNP arrays with red indicating copy number gain above average ploidy and blue indicating copy number loss below average ploidy; Middle: CRISPR-Cas9 guide scores plotted according to the 2nd most dependent sgRNA for each gene with purple trend line indicating the mean CRISPR guide score for each copy number segment defined from the above track; Bottom: RNAi gene dependency scores. AKT2 and MYC, known driver oncogenes at these loci, respectively, are highlighted in orange. For RNAi data, shRNAs targeting AKT2 used in Project Achilles were not effective in suppressing AKT2. (C, D) Boxplots of CRISPR guide scores for both expressed and not expressed genes located on (red) or off (black) of the chromosome 19q amplicon in SU86.86 (C) and the chromosome 8q amplicon in HT29 (D). For the SU86.86, the amplicon represented in panel C red box plots ranges from 39.3–41.4 Mb on the corresponding plot in panel A. The number of represented genes is noted above each box plot. (E, F) For each copy-number-defined genomic segment, median CRISPR-Cas9 guide score is plotted against copy number. Each circle represents a single genomic segment of defined copy number for the indicated cell line. The size of the circle corresponds to the number of sgRNAs targeting that segment. Non-targeting negative control sgRNAs are shown with a blue boxplot and known cell essential genes (defined as positive controls) are shown as a red boxplot embedded within the plot.
Figure 3
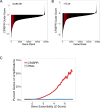
Amplified genes represent the strongest perceived dependencies in pooled CRISPR-Cas9 screening data. (A, B) Rank ordered plots showing the second-best CRISPR-Cas9 guide score for each gene in the indicated cell lines. sgRNAs targeting genes within the amplicons represented in Figure 1 are highlighted in red for SU86.86 19q amplicon (A) and HT29 8q amplicon (B). These amplicon-targeting sgRNAs are significantly enriched as apparent dependencies relative to the other sgRNAs targeting genes outside these amplicons (one-sided Kolmogorov–Smirnov test: p = 1.04E-41, A; p = 5.57E-33, B). (C) The cumulative fraction of amplified genes at or below a given dependency score is shown for both CRISPR-Cas9 and RNAi pooled screening datasets. Amplified genes are defined as those genes with a copy number ratio > 2. Gene dependency scores are shown as global Z-scores for both CRISPR-Cas9 and RNAi screening datasets, with Z-scores representing standard deviations from the mean of all genes evaluated in all cell lines screened (CRISPR-Cas9, n = 33 cell lines; RNAi, n = 503 cell lines).
Figure 4
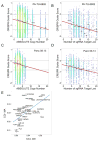
CRISPR-Cas9 sensitivity correlates with number of predicted cuts for both guides targeting single loci and multiple loci. Data from two representative cell lines are shown (PA-TU-8902, A–B; Panc 08.13, C–D) (A, C) CRISPR-Cas9 sensitivity for sgRNAs targeting only a single locus is plotted against copy number of that locus. The black hash marks represent the median CRISPR guide score for all guides targeting a locus at that copy number. The linear trendline is shown. (B, D) CRISPR-Cas9 guide scores for sgRNAs targeting multiple loci, are plotted against the predicted number of cuts for each sgRNA. Only sgRNAs targeting non-amplified regions are included, thus allowing segregation of the impact of multiple CRISPR-Cas9-induced DNA cuts due to either copy number or number of target loci. The influence of the number of predicted DNA cuts on CRISPR-Cas9 guide scores was modeled for each cell line as the slope of the trend line in A–D and termed the CRISPR-Cut Index (CCI). The CCI was determined for both copy number-driven (CCI-CN) (A, C) and multiple alignment-driven effects (CCI-MA) (B, D). (E) Scatter plot of CCI-MA versus CCI-CN showing strong correlation of the effect on CRISPR-Cas9 guide scores for either multiple alignment driven or copy number-driven DNA cuts across the cell lines.
Figure 5
sgRNAs targeting multiple chromosomes show greater sensitivity to CRISPR-Cas9-induced cutting. Data from two representative cell lines are shown (PA-TU-8902, A, C; Panc 08.13, B, D) (A, B) Boxplots of CRISPR-Cas9 sensitivity to the predicted number of CRISPR-Cas9-induced DNA cuts. CRISPR-Cas9 guide scores are shown on the Y-axis and the predicted number of DNA cuts is shown on the X-axis. sgRNAs are divided into three groups. In red are sgRNAs that target a single locus, and therefore total number of predicted cuts is based on copy number. In yellow are sgRNAs that target multiple loci within a single chromosome (intra-chromosomal). In blue are sgRNAs that target multiple loci across multiple chromosomes (inter-chromosomal). The analysis demonstrates a more potent detrimental influence on cell viability for multiple CRISPR-Cas9-induced DNA cuts across multiple chromosomes (inter-chromosomal) as compared to those restricted to a single chromosome (intra-chromosomal). Multiple linear regression accounting for difference in total number of cuts for inter-chromosomal vs. intra-chromosomal: panel A, β = −0.27, p = 2.64e-22; panel C, β = −0.16, p = 4.97e-22. (C, D) Waterfall plots showing CRISPR guide scores for all sgRNAs in the pooled screens performed on the indicated cell lines. sgRNAs from the multiple alignment analysis targeting multiple chromosomes with >10 predicted target sites are shown in red and are significantly enriched with negative CRISPR-Cas9 guide scores relative to all other sgRNAs in the library (one-sided Kolmogorov–Smirnov test: p = 2.13E-159, C; p = 9.17E-88, D) These data highlight the potent detrimental effect that these sgRNAs have on cell proliferation and viability within the screen.
Figure 6
CRISPR-Cas9 targeting of amplified regions or multiple genomic loci induces DNA damage and a G2 cell cycle arrest. (A) Schematic of the PANC-1 19q13 amplicon demonstrating ABSOLUTE DNA copy number (top panel) and CRISPR guide scores (middle panel) mapped by genomic position. Schematic and color scheme are similar to that detailed in Fig. 2. (B) In vitro validation experiment measuring arrayed proliferation and viability response of PANC-1 cells at 6 d post-infection with sgRNAs targeting regions inside (red) and outside (blue) of the demonstrated amplicon. sgRNAs targeting intergenic regions are labeled by chromosomal locus and columns are given a checkered pattern. Multi-targeted sgRNA’s (MT-1 and MT-2) are indicated by black bars. sgRNAs targeting an alternative unamplified locus (12q, orange) and known essential genes (green) are also shown. Non-targeting negative control sgRNAs are shown in yellow. Dots placed below the copy number panel correspond to the validation sgRNAs targeting the indicated genes or intergenic regions on the locus, and are matched by color and left-to-right genomic position. Cell-Titer-Glo was performed at 6-days post-infection. Error bars indicate SD of biologic replicates (n=3). p < 0.0001 for two-tailed T-test comparing sgRNAs inside (red) vs outside (blue and orange) the amplicon. (C) Plot of the percentage of PANC-1 cells in each phase of the cell cycle at 48 hours post-infection with the indicated sgRNAs targeting inside (red) or outside (blue) the amplicon. Data for a multi-targeted sgRNA (MT-2) and a control sgRNA targeting an alternative locus (12q-5), as well as for control genes are also shown. Fraction of cells in each phase of the cell cycle is indicated by a unique pattern within the column corresponding to each cell cycle phase. Colors scheme is as indicated above, with coloration of the G2 and S phases for emphasis. Error bars represent the standard deviation for the mean of three replicates. (D) Plot of the number of γ-H2AX foci present in PANC-1 cells at 48 hours post-infection with the indicated sgRNAs. Color scheme is as indicated above, with checkered pattern corresponding to sgRNAs targeting intergenic regions.
Figure 7
Cell essential genes and copy number. Cumulative distribution function (CDF) of the correlation coefficient between ABSOLUTE CN and CRISPR-Cas9 sensitivity for the indicated gene sets across all 33 cell lines screened with pooled CRISPR-Cas9. Known cell essential KEGG gene sets are displayed separately (proteasome, red; ribosome, blue; spliceosome, green, Table S2) from all other genes in the screen (black). Cell essential genes show a positive shift in CRISPR-CN correlation relative to the overall distribution (two-sided K-S statistic: spliceosome, p = 2.22e-16; proteasome, p = 2.067e-06; ribosome, p = 5.402e-11).
Comment in
- Genomic Amplifications Cause False Positives in CRISPR Screens.
Sheel A, Xue W. Sheel A, et al. Cancer Discov. 2016 Aug;6(8):824-6. doi: 10.1158/2159-8290.CD-16-0665. Cancer Discov. 2016. PMID: 27485003 Free PMC article.
Similar articles
- CRISPR Screens Provide a Comprehensive Assessment of Cancer Vulnerabilities but Generate False-Positive Hits for Highly Amplified Genomic Regions.
Munoz DM, Cassiani PJ, Li L, Billy E, Korn JM, Jones MD, Golji J, Ruddy DA, Yu K, McAllister G, DeWeck A, Abramowski D, Wan J, Shirley MD, Neshat SY, Rakiec D, de Beaumont R, Weber O, Kauffmann A, McDonald ER 3rd, Keen N, Hofmann F, Sellers WR, Schmelzle T, Stegmeier F, Schlabach MR. Munoz DM, et al. Cancer Discov. 2016 Aug;6(8):900-13. doi: 10.1158/2159-8290.CD-16-0178. Epub 2016 Jun 3. Cancer Discov. 2016. PMID: 27260157 - Unsupervised correction of gene-independent cell responses to CRISPR-Cas9 targeting.
Iorio F, Behan FM, Gonçalves E, Bhosle SG, Chen E, Shepherd R, Beaver C, Ansari R, Pooley R, Wilkinson P, Harper S, Butler AP, Stronach EA, Saez-Rodriguez J, Yusa K, Garnett MJ. Iorio F, et al. BMC Genomics. 2018 Aug 13;19(1):604. doi: 10.1186/s12864-018-4989-y. BMC Genomics. 2018. PMID: 30103702 Free PMC article. - Design of a generic CRISPR-Cas9 approach using the same sgRNA to perform gene editing at distinct loci.
Najah S, Saulnier C, Pernodet JL, Bury-Moné S. Najah S, et al. BMC Biotechnol. 2019 Mar 20;19(1):18. doi: 10.1186/s12896-019-0509-7. BMC Biotechnol. 2019. PMID: 30894153 Free PMC article. - CRISPR-Cas9 in genome editing: Its function and medical applications.
Khadempar S, Familghadakchi S, Motlagh RA, Farahani N, Dashtiahangar M, Rezaei H, Gheibi Hayat SM. Khadempar S, et al. J Cell Physiol. 2019 May;234(5):5751-5761. doi: 10.1002/jcp.27476. Epub 2018 Oct 26. J Cell Physiol. 2019. PMID: 30362544 Review. - CRISPR/Cas9 in Genome Editing and Beyond.
Wang H, La Russa M, Qi LS. Wang H, et al. Annu Rev Biochem. 2016 Jun 2;85:227-64. doi: 10.1146/annurev-biochem-060815-014607. Epub 2016 Apr 25. Annu Rev Biochem. 2016. PMID: 27145843 Review.
Cited by
- Cotargeting of XPO1 Enhances the Antileukemic Activity of Midostaurin and Gilteritinib in Acute Myeloid Leukemia.
Brinton LT, Sher S, Williams K, Canfield D, Orwick S, Wasmuth R, Cempre C, Skinner J, Lehman A, Blachly JS, Byrd JC, Lapalombella R. Brinton LT, et al. Cancers (Basel). 2020 Jun 14;12(6):1574. doi: 10.3390/cancers12061574. Cancers (Basel). 2020. PMID: 32545904 Free PMC article. - Multi-modal meta-analysis of cancer cell line omics profiles identifies ECHDC1 as a novel breast tumor suppressor.
Jaiswal A, Gautam P, Pietilä EA, Timonen S, Nordström N, Akimov Y, Sipari N, Tanoli Z, Fleischer T, Lehti K, Wennerberg K, Aittokallio T. Jaiswal A, et al. Mol Syst Biol. 2021 Mar;17(3):e9526. doi: 10.15252/msb.20209526. Mol Syst Biol. 2021. PMID: 33750001 Free PMC article. - Untangling the Context-Specificity of Essential Genes by Means of Machine Learning: A Constructive Experience.
Giordano M, Falbo E, Maddalena L, Piccirillo M, Granata I. Giordano M, et al. Biomolecules. 2023 Dec 22;14(1):18. doi: 10.3390/biom14010018. Biomolecules. 2023. PMID: 38254618 Free PMC article. - Prediction of off-target specificity and cell-specific fitness of CRISPR-Cas System using attention boosted deep learning and network-based gene feature.
Liu Q, He D, Xie L. Liu Q, et al. PLoS Comput Biol. 2019 Oct 28;15(10):e1007480. doi: 10.1371/journal.pcbi.1007480. eCollection 2019 Oct. PLoS Comput Biol. 2019. PMID: 31658261 Free PMC article. - STRIPAK directs PP2A activity toward MAP4K4 to promote oncogenic transformation of human cells.
Kim JW, Berrios C, Kim M, Schade AE, Adelmant G, Yeerna H, Damato E, Iniguez AB, Florens L, Washburn MP, Stegmaier K, Gray NS, Tamayo P, Gjoerup O, Marto JA, DeCaprio J, Hahn WC. Kim JW, et al. Elife. 2020 Jan 8;9:e53003. doi: 10.7554/eLife.53003. Elife. 2020. PMID: 31913126 Free PMC article.
References
- Urnov FD, Rebar EJ, Holmes MC, Zhang HS, Gregory PD. Genome editing with engineered zinc finger nucleases. Nature reviews Genetics. 2010;11:636–46. - PubMed
Publication types
MeSH terms
Substances
Grants and funding
- U01 CA199253/CA/NCI NIH HHS/United States
- R01 CA130988/CA/NCI NIH HHS/United States
- P01 CA154303/CA/NCI NIH HHS/United States
- U01 CA176058/CA/NCI NIH HHS/United States
- UL1 TR001102/TR/NCATS NIH HHS/United States
LinkOut - more resources
Full Text Sources
Other Literature Sources


