Human memory T cells with a naive phenotype accumulate with aging and respond to persistent viruses - PubMed (original) (raw)
doi: 10.1038/ni.3483. Epub 2016 Jun 6.
John S Davies 1 2, Carmine Martinez 1 2, Marion C Lanteri 3, Michael P Busch 3, Michael S Diamond 4 5 6, Kenneth Knox 1 7, Erin C Bush 8, Peter A Sims 8 9 10, Shripad Sinari 11, Dean Billheimer 11, Elias K Haddad 12, Kristy O Murray 13 14 15, Anne M Wertheimer 1 2, Janko Nikolich-Žugich 1 2 7
Affiliations
- PMID: 27270402
- PMCID: PMC4955715
- DOI: 10.1038/ni.3483
Human memory T cells with a naive phenotype accumulate with aging and respond to persistent viruses
Vesna Pulko et al. Nat Immunol. 2016 Aug.
Abstract
The number of naive T cells decreases and susceptibility to new microbial infections increases with age. Here we describe a previously unknown subset of phenotypically naive human CD8(+) T cells that rapidly secreted multiple cytokines in response to persistent viral antigens but differed transcriptionally from memory and effector T cells. The frequency of these CD8(+) T cells, called 'memory T cells with a naive phenotype' (TMNP cells), increased with age and after severe acute infection and inversely correlated with the residual capacity of the immune system to respond to new infections with age. CD8(+) TMNP cells represent a potential new target for the immunotherapy of persistent infections and should be accounted for and subtracted from the naive pool if truly naive T cells are needed to respond to antigens.
Conflict of interest statement
COMPETING FINANCIAL INTERESTS
Authors declare no competing financial interests.
Figures
Figure 1. Age-related increase in phenotypically naive T cells capable of rapid cytokine production
(a) Intracellular IFN-γ staining of human PMA/iono- activated PBMCs from representative healthy adult, 32 y old, and old, 76 y old, donors. Overlaid dot plots show % of naive CD45RA+CCR7+ (yellow gate) and subsequently CD45RA+CCR7+CD95loCD28int (red gate) CD8 T cells producing IFN-γ+ (in blue) overlaid over total CD8+ T cells (in green). b. Percentage of CD8+ naïve phenotype CD45+CCR7+CD95loCD28int cells producing IFN-γ across age. Data are from one of two experiments. t-test was used to show significance in the increase between the group of 21–40 years old (n=27); 40 – 65 years old (n=44) and 66–97 year old donors (>65 years old; n=21; *p<0.05; **p<0.001). c. Bar graph showing cytokine production by phenotypically naive CD45RA+ CCR7+CD95loCD28int CD8+ T cells from freshly isolated blood (age 32–76;n=7).
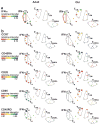
Figure 2. SPADE analysis of CD8+ T cells demonstrates clustering of TMNP cells with TN group
Two representative subjects (adult, age 27, left; and old, age 68, right) are shown. a. IFN-γ producing cells form a unique naive CD8+ T cell subset. Node size depicts the relative count and the color represents IFN-γ staining intensity. Four canonical populations are outlined in black, CD45RA+CCR7+CD95loCD28int- defined naive population in red, and IFN-γ+ naive population in bright green. b. Naive phenotype of IFN-γ producing TMNP CD8+T cells. Colors represent staining intensity of phenotypic markers indicated in the legend. Data are representative of a single experiment (n=9, 6 males, 3 females, age 27–78).
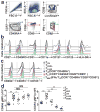
Figure 3. TMNP cells form a unique T cell subset with naive phenotype that expresses higher levels of CD49d and CXCR3
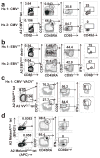
a. Flow cytometry analysis of human PMA/iono-activated PBMCs from a representative donor (age 54). Dot plots show gating strategy used to identify TMNP CD8+ T cells based on the expression of CD45RA+ CCR7+CD95loCD28int and IFN-γ production (four canonical populations are outlined on CCR7 vs CD45RA plot). b,c. Overlaid histogram plots show expression level [mean geometric mean fluorescence intensity (gMFI) ± standard error of the mean (SEM)] of an indicated surface antigen in different CD8+ T cell subsets from a representative donor from a. d. Repeated measures one-way ANOVA was used to quantify differences in CD49d and CXCR3 expression between TN and TMNP CD8 T cells (*p<0.01,**P<0.001; data are representative of two experiments, n=13 and 12, age 27–85).
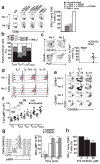
Figure 4. TMNP cells show signs of prior activation
a. CD8+TMNP cell % after 3h stimulation with indicated agonistic Ab (left) and as a fraction of PMA+iono response (±SD, n=10, 26–68y, repeated once). b. Intracellular cytokine expression by CD8+T cell subsets (n=36, 24–82y). c. Left, 5% contour plots show representative degranulation (CD107a+) and Perforin(Perf) production by IFN-γ+CD45RA+CCR7+CD95loCD28intTMNPCD8+ T cells (black) overlaid over total CD8+ T cells (gray) (n=2, male, 52,63y of n=8, 31–77y, repeated twice). Right, cumulative frequencies of CD107a+ and Perf+CD8+TMNP cells as percentage of IFNγ+GzmB+TMNP (n=8, 31–77y; repeated twice). d. Day 7 proliferation of sorted CD8+ T cell subsets in response to 50 ng/mL of IL-7 and IL-15 (subjects as in C; n=4/8 had all memory subsets as controls). e. Phenotype changes 3d after cytokine culture in 2 of 3 analyzed subjects (male, 52&64y). f. Mean gMFI±SEM of T-bet expression in different CD8+ T cell subsets before or 2h after PMA+iono activation (significance by repeated measures one- way ANOVA between populations, ns= not significant, *p<0.05,**p<0.01, ***p<0.0001, n=9, 6 males, 3 females, age 27–78). g. Time course of pErk expression (right, gMFI shown) in TMNP (CCR7+CD45RA+CD95loCD28intCD49dhi) vs TN (CCR7+CD45RA+CD95loCD28intCD49dlo) CD8+ T cells following 3h PMA+iono stimulation in a representative 68y old female. Left, mean pErk gMFI ±SD (repeated measures one-way ANOVA, n=3, 2 females, 1 male, of n=7, 67–83y,*p<0.05; repeated once). h. Dose-dependent decrease in IFN-γ production by PMA+iono stimulated CD8+ T cells after pre-incubation with Erk inhibitor (n=14, 5f, 9m, 52–83y, repeated once). (Repeated measures one-way ANOVA; *p<0.05, ***p<0.0001).
Figure 5. Telomere lengths and RNA transcriptome profile of TMNP cells
a. Representative FACS plot analysis showing telomere length of different CD8+ subsets (TN (CCR7+CD45RA+CD95loCD28int CD49dlo), TMNP (CCR7+CD45RA+CD95loCD28int CD49dhi), TCM, TE+EM, TEMRA). Numbers indicate gMFI of Cy5 PNA telomere probe staining. Bar graph comparing telomere length of CD8+ subsets with the length of naive subset within each individual (n=9, 6 females, 3 males, ages 34–83). b. Plot of the samples projected onto the first two principal components with variables of all Consensus Coding Sequence (CCDS) listed genes that were measured. The color distinguished the cell type (indicated in the figure legend) and shape distinguishes the subject from which the sample was derived. c. Heat map of differentially expressed genes (adjP<0.01, FDR<0.05. The expression values for each gene are standardized to a z-score and then binned to a color.
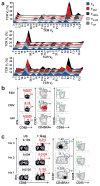
Figure 6. TMNP cells have skewed TCR Vβ repertoire and can be detected among T cells responding to stimulation with EBV, CMV, and HIV peptides
a. 3D line graphs showing TCR Vβ distribution in different CD8+ T cells subsets (TN (CD45RA+ CCR7+CD95loCD28intCD49dlo), TMNP (CD45RA+CCR7+CD95loCD28int CD49dhi), TCM, TE+EM and TEMRA) from 3 representative donors (of n=11, 6 males, 5 females, ages 27–78) shown as percentages of each of the 24 tested TCR Vβ (marked on the x axis) are shown. b,c. Flow cytometry analysis of PBMCs at 3 h after stimulation with (b) EBV BLZF1peptide pool, CMV pp65 peptide pool or IAV matrix protein peptide pool and (c) HIV (Gag) peptide pool. Dot plots show gating strategy to evaluate the naive phenotype of the responding (IFN-γ producing) CD8+ T cells. Numbers represent percentages of the population within each gate after subsequent gating (IFN-γ+ CD8+T cells followed by CCR7+CD45RA+ gate and subsequently by CD95lo CD28int gate). Total CD8+ T cells are shown in gray. (b) Data are representative of one healthy donor with an n=8 (3 females, 5 males, ages 34–68) for each peptide stimulation; (c) Data show the response of three HIV+ ART donors with no detectable HIV in plasma.
Figure 7. TMNP cells are found among CMV and EBV -specific T cell pools and are not specific for influenza, smallpox, or self-antigens
a,b. Flow cytometry analysis of IFN-γ production by naive (CD45RA+CCR7+CD95loCD28int) CMV (a) and EBV (b) specific CD8+ T at 3 h after stimulation with PMA+iono. Four representative donors (one CMV seropositive (male, age 72) and one seronegative (female, age 65) and two EBV seropositive (males, ages 67 and 75) (high and low titer) of n=26, ages 28–83 (a) or n=7, ages 24–75) (b) are shown. Dot plots show gating strategy and the numbers represent percentages of the population within each gate after subsequent gating c, d. Flow cytometry analysis of IFN-γ production by naive (CCR7+CD45RA+CD95loCD28int) vaccinia virus-specific CD8+ T cells from two representative donors (one CMV seropositive (female, age 64) and one seronegative (female, age 36) (of n=4, ages 36–74)) and naive Melan-A-specific CD8+ T cells from two representative donors, females, ages 58 and 76 (of n=6, ages 29–82) after brief stimulation with PMA+iono (same gating strategy was used as in a, b). Data are representatives of one (a,b,c) and two (d) experiments.
Figure 8. Individuals with symptomatic WNV infection show increased levels of TMNP cells
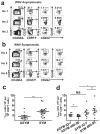
a,b. Intracellular IFN-γ and GzmB staining of human PMA+iono- activated PBMCs from six representative WNV+ donors (three WNV asymptomatic (a) and three WNV symptomatic (b)). Dot plots show gating strategy to quantify TMNP (IFNγ+CD45RA+ CCR7+CD95loCD28int) CD8+ T cells (shown as percentages of the population within each gate after subsequent gating and quantified as number (mean ±SEM) of TMNP cells per million CD8+ T cells (c) (Mann-Whitney test, **p<0.01, n=26). Data are representative of one experiment). d. Quantification of TMNP CD8+ T cells (number (mean ±SEM) of TMNP (IFNγ+CCR7+CD45RA+CD95loCD28int) cells per million CD8+ T cells) from individuals with asymptomatic and symptomatic WNV infections early (day 2–7) and late (day 60–90) after index donation (Repeated measures ANOVA was used to compare symptomatic group to asymptomatic group at two time points. Prior to applying repeated measures, equal variance assumption was tested by Levene’s test. The heterogeneous Compound Symmetry covariance structure was used to not only account for the within subject correlation but also adjust for the variance heterogeneity. p=NS, *p<0.05, **p<0.01,(asymptomatic n=11, 39–92y old; symptomatic n=16, 43–84y). Data are representative of one experiment.
Similar articles
- Postthymic development of CD28-CD8+ T cell subset: age-associated expansion and shift from memory to naive phenotype.
Nociari MM, Telford W, Russo C. Nociari MM, et al. J Immunol. 1999 Mar 15;162(6):3327-35. J Immunol. 1999. PMID: 10092786 - Marked increase with age of type 1 cytokines within memory and effector/cytotoxic CD8+ T cells in humans: a contribution to understand the relationship between inflammation and immunosenescence.
Zanni F, Vescovini R, Biasini C, Fagnoni F, Zanlari L, Telera A, Di Pede P, Passeri G, Pedrazzoni M, Passeri M, Franceschi C, Sansoni P. Zanni F, et al. Exp Gerontol. 2003 Sep;38(9):981-7. doi: 10.1016/s0531-5565(03)00160-8. Exp Gerontol. 2003. PMID: 12954485 - The polyfunctionality of human memory CD8+ T cells elicited by acute and chronic virus infections is not influenced by age.
Lelic A, Verschoor CP, Ventresca M, Parsons R, Evelegh C, Bowdish D, Betts MR, Loeb MB, Bramson JL. Lelic A, et al. PLoS Pathog. 2012;8(12):e1003076. doi: 10.1371/journal.ppat.1003076. Epub 2012 Dec 13. PLoS Pathog. 2012. PMID: 23271970 Free PMC article. Clinical Trial. - Characterization of naïve, memory and effector CD8+ T cells: effect of age.
Gupta S, Bi R, Su K, Yel L, Chiplunkar S, Gollapudi S. Gupta S, et al. Exp Gerontol. 2004 Apr;39(4):545-50. doi: 10.1016/j.exger.2003.08.013. Exp Gerontol. 2004. PMID: 15050289 Review. - Generation and maintenance of human memory cells during viral infection.
Halwani R, Doroudchi M, Yassine-Diab B, Janbazian L, Shi Y, Said EA, Haddad EK, Sékaly RP. Halwani R, et al. Springer Semin Immunopathol. 2006 Nov;28(3):197-208. doi: 10.1007/s00281-006-0027-2. Epub 2006 Sep 12. Springer Semin Immunopathol. 2006. PMID: 16967292 Review.
Cited by
- Preservation of naive-phenotype CD4+ T cells after vaccination contributes to durable immunity.
Pan YG, Bartolo L, Xu R, Patel BV, Zarnitsyna VI, Su LF. Pan YG, et al. JCI Insight. 2024 Jun 11;9(14):e180667. doi: 10.1172/jci.insight.180667. JCI Insight. 2024. PMID: 38861490 Free PMC article. - Differentiation marker-negative CD4+ T cells persist after yellow fever virus vaccination and contribute to durable memory.
Pan YG, Bartolo L, Xu R, Patel B, Zarnitsyna V, Su L. Pan YG, et al. bioRxiv [Preprint]. 2024 Mar 14:2024.03.11.584523. doi: 10.1101/2024.03.11.584523. bioRxiv. 2024. PMID: 38559113 Free PMC article. Updated. Preprint. - Anti-cytomegalovirus antibody levels stratify human immune profiles across the lifespan.
Watanabe M, Davidson L, Smith P, Castellucio PF, Jergovic M, Uhrlaub JL, Smithey MJ, Fantry LE, Dechambre B, Wilson RC, Knox KC, Ren J, Stowe RP, Weinstock G, Twigg H 3rd, Nikolich JŽ. Watanabe M, et al. Geroscience. 2024 Oct;46(5):4225-4242. doi: 10.1007/s11357-024-01124-0. Epub 2024 Mar 21. Geroscience. 2024. PMID: 38512581 Free PMC article. - Type 1 interferons and Foxo1 down-regulation play a key role in age-related T-cell exhaustion in mice.
Durand A, Bonilla N, Level T, Ginestet Z, Lombès A, Guichard V, Germain M, Jacques S, Letourneur F, Do Cruzeiro M, Marchiol C, Renault G, Le Gall M, Charvet C, Le Bon A, Martin B, Auffray C, Lucas B. Durand A, et al. Nat Commun. 2024 Feb 26;15(1):1718. doi: 10.1038/s41467-024-45984-8. Nat Commun. 2024. PMID: 38409097 Free PMC article. - PREX1 improves homeostatic proliferation to maintain a naive CD4+ T cell compartment in older age.
Zhang H, Okuyama H, Jain A, Jadhav RR, Wu B, Sturmlechner I, Morales J, Ohtsuki S, Weyand CM, Goronzy JJ. Zhang H, et al. JCI Insight. 2024 Feb 8;9(5):e172848. doi: 10.1172/jci.insight.172848. JCI Insight. 2024. PMID: 38329813 Free PMC article.
References
- Jenkins MK, Chu HH, McLachlan JB, Moon JJ. On the composition of the preimmune repertoire of T cells specific for Peptide-major histocompatibility complex ligands. Annu Rev Immunol. 2010;28:275–294. - PubMed
- Linton PJ, Dorshkind K. Age-related changes in lymphocyte development and function. Nat Immunol. 2004;5(2):133–139. - PubMed
Publication types
MeSH terms
Grants and funding
- P30 CA023074/CA/NCI NIH HHS/United States
- P30 ES006694/ES/NIEHS NIH HHS/United States
- P30 AG008017/AG/NIA NIH HHS/United States
- R01 AG048021/AG/NIA NIH HHS/United States
- RC2 HL101632/HL/NHLBI NIH HHS/United States
LinkOut - more resources
Full Text Sources
Other Literature Sources
Medical
Research Materials

