Functional characterization of somatic mutations in cancer using network-based inference of protein activity - PubMed (original) (raw)
Functional characterization of somatic mutations in cancer using network-based inference of protein activity
Mariano J Alvarez et al. Nat Genet. 2016 Aug.
Abstract
Identifying the multiple dysregulated oncoproteins that contribute to tumorigenesis in a given patient is crucial for developing personalized treatment plans. However, accurate inference of aberrant protein activity in biological samples is still challenging as genetic alterations are only partially predictive and direct measurements of protein activity are generally not feasible. To address this problem we introduce and experimentally validate a new algorithm, virtual inference of protein activity by enriched regulon analysis (VIPER), for accurate assessment of protein activity from gene expression data. We used VIPER to evaluate the functional relevance of genetic alterations in regulatory proteins across all samples in The Cancer Genome Atlas (TCGA). In addition to accurately infer aberrant protein activity induced by established mutations, we also identified a fraction of tumors with aberrant activity of druggable oncoproteins despite a lack of mutations, and vice versa. In vitro assays confirmed that VIPER-inferred protein activity outperformed mutational analysis in predicting sensitivity to targeted inhibitors.
Conflict of interest statement
MJA is chief scientific officer of DarwinHealth Inc. AC is a founder of DarwinHealth Inc.
Figures
Figure 1. Schematic overview of the VIPER algorithm
(a) Molecular layers profiled by different technologies. Transcriptomics measures steady-state mRNA levels; Proteomics quantifies protein levels, including some defined post-translational isoforms; VIPER infers protein activity based on the protein’s regulon, reflecting the abundance of the active protein isoform, including post-translational modifications, proper subcellular localization and interaction with co-factors. (b) Representation of VIPER workflow. A regulatory model is generated from ARACNe-inferred context-specific interactome and Mode of Regulation computed from the correlation between regulator and target genes. Single-sample gene expression signatures are computed from genome-wide expression data, and transformed into regulatory protein activity profiles by the aREA algorithm. (c) Three possible scenarios for the aREA analysis, including increased, decreased or no change in protein activity. The gene expression signature and its absolute value (|GES|) are indicated by color scale bars, induced and repressed target genes according to the regulatory model are indicated by blue and red vertical lines. (d) Pleiotropy Correction is performed by evaluating whether the enrichment of a given regulon (R4) is driven by genes co-regulated by a second regulator (R4∩R1). (e) Benchmark results for VIPER analysis based on multiple-samples gene expression signatures (msVIPER) and single-sample gene expression signatures (VIPER). Boxplots show the accuracy (relative rank for the silenced protein), and the specificity (fraction of proteins inferred as differentially active at p < 0.05) for the 6 benchmark experiments (see Table 2). Different colors indicate different implementations of the aREA algorithm, including 2-tail (2T) and 3-tail (3T), Interaction Confidence (IC) and Pleiotropy Correction (PC).
Figure 2. Effect of network and signature quality on VIPER results
(a–c) Effect of network quality on VIPER accuracy (rank position of the silenced gene), including using a non tissue-matched interactome (a), network degradation by partially randomizing the regulons (b), or reducing the regulon size (c). (a) Barplot showing VIPER accuracy when computing protein activity with a B-cell interactome (blue) or glioma interactome (red). (b–c) Plots summarizing the accuracy across the six benchmark experiments by the median (black line), IQR (blue area), and the lowest and highest data points still inside 1.5 times the IQR away from the quartiles (light-blue area), resembling a box-and-whiskers plots (continuous boxplot). (d–f) Effect of gene expression signature quality on VIPER accuracy. (d) Signature degradation by addition of different levels of Gaussian noise (x-axis). VIPER accuracy (left y-axis) is shown by the continuous boxplot. The probability density plots show the distribution of gene expression variance for the six benchmark datasets (right y-axis). (e) Reduction of the signature coverage by randomly removing genes. VIPER accuracy is summarized by the continuous boxplot. (f) Robust response of VIPER-inferred protein activity signatures to low depth RNAseq data. Shown is the average correlation between 30 million (30M) mapped reads-based gene expression (yellow circles) or VIPER-inferred protein activity (cyan triangles) signatures, and the corresponding signatures computed from lower-depth RNAseq (indicated in the x-axis). The signatures were obtained from 100 breast carcinoma samples profiled by TCGA.
Figure 3. Reproducibility of VIPER results
(a) Violin plot showing the distribution of correlation coefficients computed between all possible pairs of gene expression signatures (yellow) or VIPER protein activity signatures (cyan) for samples of the same B cell phenotype, including normal (GC, germinal center reaction; M, memmory and N, peripheral blood B cell) and pathologic (B-CLL, B cell chronic lymphocytic leukemia; BL, Burkitt lymphoma; HCL, hairy cell leukemia; PEL, primary effusion lymphoma; MCL, mantle cell lymphoma; FL, follicular lymphoma) phenotypes. The number of samples per phenotype is indicated on top of the figure. (b) Probability density for the relative rank position of the most upregulated gene (mRNA, yellow), relatively abundant protein (RPPA, green) or activated protein (VIPER, cyan), identified in each profiled basal breast carcinoma sample, across all the remaining profiled samples. The horizontal line and number beneath indicates the distribution mode. (c) Probability density for the relative rank position of the top 10 most upregulated genes (yellow) or VIPER-inferred activated proteins (cyan), identified from FF samples on the corresponding FFPE samples.
Figure 4. Detecting changes in protein activity induced by non-silent somatic mutations
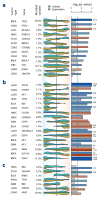
Shown is the tumor type, gene harboring non-silent somatic mutations and proportion of mutated samples. The violin plot indicates the distribution density for the mutated samples on all samples rank sorted by mRNA expression (yellow) and VIPER-inferred protein activity (cyan). The background color gradient indicates both expression and VIPER-inferred protein activity signatures with down-regulated genes and inactivated proteins to the left (blue), and over-expressed genes and activated proteins to the right (red). The significance level for the association was computed by the aREA algorithm and is shown by the barplot as −log10(p-value). Blue bars indicate enrichment of the mutated samples among low expression or protein activity, while red bars indicate enrichment among high levels of expression or protein activity. The figure displays mutations associated with protein activity only (a), associated with protein activity and mRNA expression (b), and associated with mRNA expression only (c). The complete list of evaluated proteins is shown in Supplementary Fig. 11.
Figure 5. Mutant Phenotype Score and its association with drug sensitivity
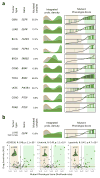
(a) Histograms showing the probability density for the non-mutated (salmon) and mutated (green) samples based on Mutant Phenotype Score (MPS) for 6 actionable mutations (complete list in Supplementary Fig. 12). Right plots show the MPS (y-axis) for all samples rank-sorted by MPS (x-axis) and indicate the mutated samples by green vertical lines. The MPS-defined WT and mutant phenotypes (likelihood-ratio > 3) are highlighted by the light-salmon and light-green boxes. (b) MPS analysis for EGFR on lung carcinoma cell lines. The scatter-plots show the drug sensitivity, quantified by the area under the titration curves (AUC), for EGFR targeting drugs as a function of MPS (expressed as likelihood-ratio). The cell lines resembling an EGFR mutated phenotype are included in the light-green box (likelihood-ratio > 3), while the ones resembling an EGFR WT phenotype are contained in the salmon box. Cell lines harboring non-silent mutations are indicated by dark-green dots. The solid and doted horizontal lines indicate the mean and 2.33 standard deviations over the mean of the chemoresistant cell lines, respectively. The association between drug sensitivity and MPS is shown on top of each plot by the Pearson’s correlation coefficient (R) and associated p-value. The violin plots (inserts) show the probability density for drug sensitivity (AUC) of the cell lines showing an EGFR WT (green) or mutant (brown) phenotype according to MPS. The horizontal line indicates the mean of each of the distributions, which were contrasted by Student t-test (p-value indicated in each insert).
Figure 6. Effect of specific NSSM variants on VIPER-inferred protein activity
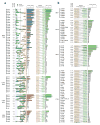
(a) Association of non-silent somatic mutation variants with VIPER-inferred protein activity and mRNA expression. Violin plots indicate the probability density for the mutated samples on all samples rank-sorted by coding gene mRNA levels (yellow) or VIPER-inferred protein activity (cyan). The background color gradient indicates both expression and VIPER-inferred protein activity signatures from decreased (blue) to increased (orange). The statistical level for the association, as estimated by aREA, is shown by the barplot, which color indicates association with increased (red) or decreased (blue) expression or protein activity. The rightmost barplot shows the significance level for the association of mutation variants and the MPS-defined mutant phenotype (likelihood ratio > 3, light-green box). The MPS-defined WT phenotype (likelihood ratio > 3) is indicated by the light-salmon box. Missense mutations are indicated as p.XnY where X stands for 1-letter amoninoacid in position n that was mutated to Y. Nonsense mutations are indicated by ‘*’ while frame shift mutations are indicated as p._Xn_fs. The vertical lines crossing the bars indicate the p-value threshold of 0.05. (b) Effect of non-silent variants integrated across different tumor types. MPS was integrated for all 12 tumor types (3,343 samples) and is shown as the x-axis in the left side of the plot, while the enrichment of each variant among the samples with at least 3-fold likelihood of mutation vs. the WT samples (likelihood-ratio > 3), is indicated as −log10(p) by the barplots.
Similar articles
- Protein-structure-guided discovery of functional mutations across 19 cancer types.
Niu B, Scott AD, Sengupta S, Bailey MH, Batra P, Ning J, Wyczalkowski MA, Liang WW, Zhang Q, McLellan MD, Sun SQ, Tripathi P, Lou C, Ye K, Mashl RJ, Wallis J, Wendl MC, Chen F, Ding L. Niu B, et al. Nat Genet. 2016 Aug;48(8):827-37. doi: 10.1038/ng.3586. Epub 2016 Jun 13. Nat Genet. 2016. PMID: 27294619 Free PMC article. - Frequent mutations in acetylation and ubiquitination sites suggest novel driver mechanisms of cancer.
Narayan S, Bader GD, Reimand J. Narayan S, et al. Genome Med. 2016 May 12;8(1):55. doi: 10.1186/s13073-016-0311-2. Genome Med. 2016. PMID: 27175787 Free PMC article. - INFERENCE OF PERSONALIZED DRUG TARGETS VIA NETWORK PROPAGATION.
Shnaps O, Perry E, Silverbush D, Sharan R. Shnaps O, et al. Pac Symp Biocomput. 2016;21:156-67. Pac Symp Biocomput. 2016. PMID: 26776182 - The mutational landscape of phosphorylation signaling in cancer.
Reimand J, Wagih O, Bader GD. Reimand J, et al. Sci Rep. 2013 Oct 2;3:2651. doi: 10.1038/srep02651. Sci Rep. 2013. PMID: 24089029 Free PMC article. - Cancer networks and beyond: interpreting mutations using the human interactome and protein structure.
Gulati S, Cheng TM, Bates PA. Gulati S, et al. Semin Cancer Biol. 2013 Aug;23(4):219-26. doi: 10.1016/j.semcancer.2013.05.002. Epub 2013 May 13. Semin Cancer Biol. 2013. PMID: 23680723 Review.
Cited by
- Integrated molecular and pharmacological characterization of patient-derived xenografts from bladder and ureteral cancers identifies new potential therapies.
Lang H, Béraud C, Cabel L, Fontugne J, Lassalle M, Krucker C, Dufour F, Groeneveld CS, Dixon V, Meng X, Kamoun A, Chapeaublanc E, De Reynies A, Gamé X, Rischmann P, Bieche I, Masliah-Planchon J, Beaurepere R, Allory Y, Lindner V, Misseri Y, Radvanyi F, Lluel P, Bernard-Pierrot I, Massfelder T. Lang H, et al. Front Oncol. 2022 Aug 11;12:930731. doi: 10.3389/fonc.2022.930731. eCollection 2022. Front Oncol. 2022. PMID: 36033544 Free PMC article. - NOGEA: A Network-oriented Gene Entropy Approach for Dissecting Disease Comorbidity and Drug Repositioning.
Guo Z, Fu Y, Huang C, Zheng C, Wu Z, Chen X, Gao S, Ma Y, Shahen M, Li Y, Tu P, Zhu J, Wang Z, Xiao W, Wang Y. Guo Z, et al. Genomics Proteomics Bioinformatics. 2021 Aug;19(4):549-564. doi: 10.1016/j.gpb.2020.06.023. Epub 2021 Mar 17. Genomics Proteomics Bioinformatics. 2021. PMID: 33744433 Free PMC article. - Plasticity of intragraft alloreactive T cell clones in human gut correlates with transplant outcomes.
Fu J, Wang Z, Martinez M, Obradovic A, Jiao W, Frangaj K, Jones R, Guo XV, Zhang Y, Kuo WI, Ko HM, Iuga A, Bay Muntnich C, Prada Rey A, Rogers K, Zuber J, Ma W, Miron M, Farber DL, Weiner J, Kato T, Shen Y, Sykes M. Fu J, et al. J Exp Med. 2024 Jan 1;221(1):e20230930. doi: 10.1084/jem.20230930. Epub 2023 Dec 13. J Exp Med. 2024. PMID: 38091025 Free PMC article. - Copy Number Loss of 17q22 Is Associated with Enzalutamide Resistance and Poor Prognosis in Metastatic Castration-Resistant Prostate Cancer.
Guan X, Sun D, Lu E, Urrutia JA, Reiter RE, Rettig M, Evans CP, Lara P Jr, Gleave M, Beer TM, Thomas GV, Huang J, Aggarwal RR, Quigley DA, Foye A, Chen WS, Youngren J, Weinstein AS, Stuart JM, Feng FY, Small EJ, Xia Z, Alumkal JJ. Guan X, et al. Clin Cancer Res. 2020 Sep 1;26(17):4616-4624. doi: 10.1158/1078-0432.CCR-19-2303. Epub 2020 Jul 29. Clin Cancer Res. 2020. PMID: 32727885 Free PMC article. - The transcriptomic response of cells to a drug combination is more than the sum of the responses to the monotherapies.
Diaz JE, Ahsen ME, Schaffter T, Chen X, Realubit RB, Karan C, Califano A, Losic B, Stolovitzky G. Diaz JE, et al. Elife. 2020 Sep 18;9:e52707. doi: 10.7554/eLife.52707. Elife. 2020. PMID: 32945258 Free PMC article.
References
- Hanahan D, Weinberg RA. Hallmarks of cancer: the next generation. Cell. 2011;144:646–74. - PubMed
- Weinstein IB. Cancer. Addiction to oncogenes--the Achilles heal of cancer. Science. 2002;297:63–4. - PubMed
Publication types
MeSH terms
Substances
Grants and funding
- U01 CA168426/CA/NCI NIH HHS/United States
- S10 OD012351/OD/NIH HHS/United States
- R01 CA085573/CA/NCI NIH HHS/United States
- U54 CA121852/CA/NCI NIH HHS/United States
- U01 CA164184/CA/NCI NIH HHS/United States
- S10 OD021764/OD/NIH HHS/United States
- P30 CA013330/CA/NCI NIH HHS/United States
- R35 CA197745/CA/NCI NIH HHS/United States
LinkOut - more resources
Full Text Sources
Other Literature Sources
Molecular Biology Databases


