Oma1 Links Mitochondrial Protein Quality Control and TOR Signaling To Modulate Physiological Plasticity and Cellular Stress Responses - PubMed (original) (raw)
Oma1 Links Mitochondrial Protein Quality Control and TOR Signaling To Modulate Physiological Plasticity and Cellular Stress Responses
Iryna Bohovych et al. Mol Cell Biol. 2016.
Abstract
A network of conserved proteases known as the intramitochondrial quality control (IMQC) system is central to mitochondrial protein homeostasis and cellular health. IMQC proteases also appear to participate in establishment of signaling cues for mitochondrion-to-nucleus communication. However, little is known about this process. Here, we show that in Saccharomyces cerevisiae, inactivation of the membrane-bound IMQC protease Oma1 interferes with oxidative-stress responses through enhanced production of reactive oxygen species (ROS) during logarithmic growth and reduced stress signaling via the TORC1-Rim15-Msn2/Msn4 axis. Pharmacological or genetic prevention of ROS accumulation in Oma1-deficient cells restores this defective TOR signaling. Additionally, inactivation of the Oma1 ortholog in the human fungal pathogen Candida albicans also alters TOR signaling and, unexpectedly, leads to increased resistance to neutrophil killing and virulence in the invertebrate animal model Galleria mellonella Our findings reveal a novel and evolutionarily conserved link between IMQC and TOR-mediated signaling that regulates physiological plasticity and pancellular oxidative-stress responses.
Copyright © 2016, American Society for Microbiology. All Rights Reserved.
Figures
FIG 1
Tolerance of the _oma1_Δ mutant for selected chemical compounds. (A) Growth of WT and _oma1_Δ cells on plates with or without 10 mM vanillin, 30 ng/ml rapamycin, 15 mM caffeine, and 0.1 μg/ml caspofungin. Synchronized cells were grown to mid-logarithmic stage (8 h of growth; _A_600 = 0.8), serially diluted, and spotted onto the respective plates. Photographs were taken after 2 (No treatment) or 4 (plus compound) days at 28°C. (B) Growth of WT and _oma1_Δ strains on plates containing increasing concentrations of oligomycin. The cells were handled as in panel A and spotted onto plates containing 10 μg/ml or 250 μg/ml oligomycin. Photographs were taken after 2 days of incubation at 28°C. (C) Relative expression of PDR5 and PDR15 in the indicated strains. The error bars indicate standard deviations (SD) (n = 4 biological replicates); n.s., nonsignificant by Student's t test. AU, arbitrary units.
FIG 2
Oma1-deficient cells are resistant to rapamycin and exhibit attenuated TOR activity. (A) Growth of the indicated strains on YPD plates with (+Rapa) or without (−Rapa) 30 ng/ml rapamycin. Synchronized cells were grown to mid-log stage (8 h of growth; _A_600 = 0.8). Photographs were taken after 2 (−Rapa), 4 (+Rapa), or 6 (+Rapa, Prolonged incubation) days at 28°C. (B) WT, _oma1_Δ, and _tor1_Δ strains expressing genomically tagged Npr1-HA were cultured in the presence or absence of rapamycin. Log-phase cells were harvested, lysed, and analyzed by immunoblotting with antibodies against HA epitope and Kar2 (loading control). Npr1HA and P-Npr1HA, dephosphorylated and hyperphosphorylated forms of the protein, respectively. The asterisk indicates an HA tag-cross-reacting band. (C) Quantitation of the P-Npr1-HA form in WT, _oma1_Δ, and _tor1_Δ cells. The error bars indicate standard errors of the mean (SEM) (n = 3 biological replicates). (D) Relative expression of TOR1 and TOR2 in the indicated strains. The error bars indicate SD (n = 4 biological replicates). P values were determined as for Fig. 1 (n.s., nonsignificant; *, P < 0.05 by Student's t test). Ø, no detectable signal.
FIG 3
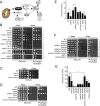
The TORC1-Rim15-Msn2/Msn4 signaling axis is downstream of OMA1. (A) Model demonstrating key components of mitochondrion-related signaling in yeast. (B to D) Growth of the indicated strains on YPD plates with or without rapamycin (30 ng/ml). Cells were analyzed as for Fig. 1. (E) Oxidative-stress survival of the indicated strains. Log-phase cultures (8 h; _A_600 = 0.5) were acutely treated with 1 mM H2O2 for 1 h. Samples were diluted to 300 cells and plated for survival on YPD plates. The number of CFU was determined after 2 days at 28°C. The bars show means and SD (n = 5). *, P < 0.05; **, P < 0.01 by Student's t test and one-way ANOVA. (F) Growth of indicated strains on YPD and YPD-plus-Rapa plates. (G) H2O2 stress survival of the indicated strains.
FIG 4
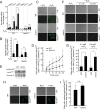
Oxidative- but not osmotic-stress response mediated via the Msn2/Msn4 signaling node is altered in _oma1_Δ cells. (A) Transcript changes in synchronized WT and _oma1_Δ cells in response to acute treatment with 0.5 mM H2O2. Relative transcript levels of OMA1, cytosolic catalase (CTT1), and manganese superoxide dismutase (SOD2) were assessed by quantitative PCR (qPCR) (n = 5 independent experiments). (B) Catalase activity in whole-cell extracts derived from the indicated cells (n = 3 biological replicates). The bars show mean values and SD. (C and D) Nuclear accumulation of Msn2-GFP in 1 mM H2O2-exposed WT and _oma1_Δ cells. (C) Representative images showing Msn2-GFP localization at 15 min posttreatment. (D) Quantitation of time-dependent nuclear accumulation of Msn2-GFP. The error bars indicate SD (n = 3, with 800 cells per biological replicate). (E) Steady-state levels of Msn2-GFP in WT and _oma1_Δ cell lysates. Proteins were visualized with antibodies against the GFP moiety. (F and G) Nuclear accumulation of Msn2-GFP in 0.1 or 0.5 mM H2O2-exposed WT and _oma1_Δ cells. (F) Representative images showing Msn2-GFP localization at 15 min posttreatment. (G) Quantitation of nucleus-localized Msn2-GFP. The error bars indicate SD (n = 3, with 800 cells per biological replicate). (H and I) Nuclear accumulation of Msn2-GFP in response to 1 M NaCl was analyzed as for panels C, F, and G. n.s., nonsignificant; *, P < 0.05; **, P < 0.01; ***, P < 0.001 by Student's t test.
FIG 5
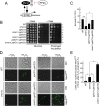
Mitochondrial function, ROS production, and antioxidant defense in the _oma1_Δ strain. (A) Schematic showing the relationship between the PP2A phosphatase and the transcriptional factor Msn2. (B) Growth of the indicated strains on YPD plates with or without rapamycin (30 ng/ml). (C) Oxidative-stress survival of the indicated strains determined as described for Fig. 3E. (D and E) Nuclear accumulation of Msn2-GFP in the indicated strains at 15 min after treatment with 1 mM H2O2. (D) Representative confocal microscopy images. (E) Quantitation of nucleus-localized Msn2-GFP. Cells were handled and analyzed as described for Fig. 3D. *, P < 0.05; **, P < 0.01; ***, P < 0.001 by Student's t test.
FIG 6
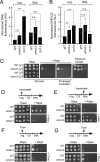
Transiently elevated ROS contribute to rapamycin resistance of the _oma1_Δ mutant. (A and B) ROS production determined by FACS analysis of synchronized DHE-stained (A) or DHR123-stained (B) WT and _oma1_Δ cells at log (Log.) (_A_600 = 0.5 6 h postinoculation) and stationary (Stat.) (_A_600 = 3.0 12 h postinoculation) stages. The data show mean values and SD (n = 3 to 5 biological repeats). (C) Growth of the indicated strains with (ρ+) or without (ρ0) mtDNA. (D to G) Growth of antioxidant-pretreated WT and _oma1_Δ strains. Synchronized exponential-phase cells (8 h of growth; _A_600 = 0.8) cultured with or without 5 μM sodium ascorbate (D) or 20 mM the ROS scavenger Tiron (F) were analyzed as described above. (E and G) Ascorbate pretreatment (E) and Tiron pretreatment (G) showing growth of the same strains analyzed in stationary phase (24 h of growth; _A_600 = 8.0). n.s., nonsignificant; **, P < 0.01; ***, P < 0.001 by Student's t test.
FIG 7
Loss of Oma1 impinges on TOR signaling and promotes virulence in C. albicans. (A) PCR confirming homozygous deletion of orf19.3827/OMA1 in C. albicans strain SC5314. (B) Sensitivity of the SC5314 and oma1_Δ/_Δ strains to various stressors. Mid-log-stage cells were grown on YPD plates containing 5 mM H2O2, 0.1 μg/ml caspofungin (Caspo), or 0.4 μg/ml rapamycin (Rapa). The plates were placed in the 30°C static incubator, and photographs were taken 24 h after spotting. (C) Survival of C. albicans strains in human neutrophils. The indicated strains (1 × 10⁶ cells) were isolated, washed, and cocultured with 1 × 10⁷ RPMI medium-plus-FBS-treated polymorphonuclear granulocytes from 3 unrelated healthy donors. Following 2-h coincubation at 37°C, pathogen cells were reisolated and plated for survival. The viable colonies were assessed after 48 h at 30°C. (D and E) Survival of G. mellonella larvae infected with the indicated strains. The larvae were injected with cells or buffer and monitored for 5 days at 37°C. n = 25 subjects per replicate for each group plus 10 noninjected animals (nonmanipulated control). Three biological replicates of each experiment were conducted, and two independent isolates of the oma1_Δ/_Δ strain were tested. (D) Kaplan-Meier survival plot of animals infected with the indicated strains (the results show the data pooled for a single comparison; n = 75 for each strain). P values were determined using log rank statistics. (E) Complementary data showing the percentage of G. mellonella killing ± SEM; P values were determined as for Fig. 1. *, P < 0.05; **, P < 0.01 by Student's t test.
FIG 8
Speculative model of how Oma1 loss affects the TORC1 pathway-dependent oxidative-stress response. Depletion of Oma1 is associated with enhanced production of mitochondrial ROS during exponential growth. Elevated ROS levels exert a modulatory effect on TORC1 signaling, which results in reduced communication via the TORC1-Rim15 axis and reduces activity of the PP2A phosphatase. These alterations lead to improper nuclear transport and/or retention of the Msn2/Msn4 transcriptional complex, thereby reducing the expression of Msn2/Msn4-controlled genes in response to acute oxidative stress. We acknowledge that reduced TORC1 signaling may exert additional effects (not shown in the cartoon) that can also contribute to the reduced oxidative-stress tolerance and rapamycin resistance of _oma1_Δ cells. Black, normal/active signaling; red, inhibited signaling; dashed gray, affected signaling or inhibition.
Similar articles
- Synergistic effects of TOR and proteasome pathways on the yeast transcriptome and cell growth.
Zhang N, Quan Z, Rash B, Oliver SG. Zhang N, et al. Open Biol. 2013 May 22;3(5):120137. doi: 10.1098/rsob.120137. Open Biol. 2013. PMID: 23697803 Free PMC article. - Metalloprotease OMA1 Fine-tunes Mitochondrial Bioenergetic Function and Respiratory Supercomplex Stability.
Bohovych I, Fernandez MR, Rahn JJ, Stackley KD, Bestman JE, Anandhan A, Franco R, Claypool SM, Lewis RE, Chan SS, Khalimonchuk O. Bohovych I, et al. Sci Rep. 2015 Sep 14;5:13989. doi: 10.1038/srep13989. Sci Rep. 2015. PMID: 26365306 Free PMC article. - TOR complex 2-Ypk1 signaling regulates actin polarization via reactive oxygen species.
Niles BJ, Powers T. Niles BJ, et al. Mol Biol Cell. 2014 Dec 1;25(24):3962-72. doi: 10.1091/mbc.E14-06-1122. Epub 2014 Sep 24. Mol Biol Cell. 2014. PMID: 25253719 Free PMC article. - Mitochondrial Retrograde Signaling: Triggers, Pathways, and Outcomes.
da Cunha FM, Torelli NQ, Kowaltowski AJ. da Cunha FM, et al. Oxid Med Cell Longev. 2015;2015:482582. doi: 10.1155/2015/482582. Epub 2015 Oct 25. Oxid Med Cell Longev. 2015. PMID: 26583058 Free PMC article. Review. - TOR signaling in growth and metabolism.
Wullschleger S, Loewith R, Hall MN. Wullschleger S, et al. Cell. 2006 Feb 10;124(3):471-84. doi: 10.1016/j.cell.2006.01.016. Cell. 2006. PMID: 16469695 Review.
Cited by
- Yeast thioredoxin reductase Trr1p controls TORC1-regulated processes.
Picazo C, Matallana E, Aranda A. Picazo C, et al. Sci Rep. 2018 Nov 7;8(1):16500. doi: 10.1038/s41598-018-34908-4. Sci Rep. 2018. PMID: 30405153 Free PMC article. - AtOMA1 Affects the OXPHOS System and Plant Growth in Contrast to Other Newly Identified ATP-Independent Proteases in Arabidopsis Mitochondria.
Migdal I, Skibior-Blaszczyk R, Heidorn-Czarna M, Kolodziejczak M, Garbiec A, Janska H. Migdal I, et al. Front Plant Sci. 2017 Sep 7;8:1543. doi: 10.3389/fpls.2017.01543. eCollection 2017. Front Plant Sci. 2017. PMID: 28936218 Free PMC article. - Mitochondria-cytosol-nucleus crosstalk: learning from Saccharomyces cerevisiae.
Guaragnella N, Coyne LP, Chen XJ, Giannattasio S. Guaragnella N, et al. FEMS Yeast Res. 2018 Dec 1;18(8):foy088. doi: 10.1093/femsyr/foy088. FEMS Yeast Res. 2018. PMID: 30165482 Free PMC article. Review. - Standardization of G. mellonella Larvae to Provide Reliable and Reproducible Results in the Study of Fungal Pathogens.
Champion OL, Titball RW, Bates S. Champion OL, et al. J Fungi (Basel). 2018 Sep 6;4(3):108. doi: 10.3390/jof4030108. J Fungi (Basel). 2018. PMID: 30200639 Free PMC article. Review. - Sending Out an SOS: Mitochondria as a Signaling Hub.
Bohovych I, Khalimonchuk O. Bohovych I, et al. Front Cell Dev Biol. 2016 Oct 13;4:109. doi: 10.3389/fcell.2016.00109. eCollection 2016. Front Cell Dev Biol. 2016. PMID: 27790613 Free PMC article. Review.
References
MeSH terms
Substances
Grants and funding
- R01 GM105781/GM/NIGMS NIH HHS/United States
- R01 DK079209/DK/NIDDK NIH HHS/United States
- R01 GM108975/GM/NIGMS NIH HHS/United States
- MR/N006364/1/MRC_/Medical Research Council/United Kingdom
- BB/K017365/1/BB_/Biotechnology and Biological Sciences Research Council/United Kingdom
- 249793/ERC_/European Research Council/International
- P30 GM103509/GM/NIGMS NIH HHS/United States
- P30 GM103335/GM/NIGMS NIH HHS/United States
- R01 GM071775/GM/NIGMS NIH HHS/United States
- MR/M026663/1/MRC_/Medical Research Council/United Kingdom
LinkOut - more resources
Full Text Sources
Other Literature Sources
Molecular Biology Databases


