Dietary Intake Among US Adults, 1999-2012 - PubMed (original) (raw)
Dietary Intake Among US Adults, 1999-2012
Colin D Rehm et al. JAMA. 2016.
Abstract
Importance: Most studies of US dietary trends have evaluated major macronutrients or only a few dietary factors. Understanding trends in summary measures of diet quality for multiple individual foods and nutrients, and the corresponding disparities among population subgroups, is crucial to identify challenges and opportunities to improve dietary intake for all US adults.
Objective: To characterize trends in overall diet quality and multiple dietary components related to major diseases among US adults, including by age, sex, race/ethnicity, education, and income.
Design, setting, and participants: Repeated cross-sectional investigation using 24-hour dietary recalls in nationally representative samples including 33,932 noninstitutionalized US adults aged 20 years or older from 7 National Health and Nutrition Examination Survey (NHANES) cycles (1999-2012). The sample size per cycle ranged from 4237 to 5762.
Exposures: Calendar year and population sociodemographic subgroups.
Main outcomes and measures: Survey-weighted, energy-adjusted mean consumption and proportion meeting targets of the American Heart Association (AHA) 2020 continuous diet scores, AHA score components (primary: total fruits and vegetables, whole grains, fish and shellfish, sugar-sweetened beverages, and sodium; secondary: nuts, seeds, and legumes, processed meat, and saturated fat), and other individual food groups and nutrients.
Results: Several overall dietary improvements were identified (P < .01 for trend for each). The AHA primary diet score (maximum of 50 points) improved from 19.0 to 21.2 (an improvement of 11.6%). The AHA secondary diet score (maximum of 80 points) improved from 35.1 to 38.5 (an improvement of 9.7%). Changes were attributable to increased consumption between 1999-2000 and 2011-2012 of whole grains (0.43 servings/d; 95% CI, 0.34-0.53 servings/d) and nuts or seeds (0.25 servings/d; 95% CI, 0.18-0.34 servings/d) (fish and shellfish intake also increased slightly) and to decreased consumption of sugar-sweetened beverages (0.49 servings/d; 95% CI, 0.28-0.70 servings/d). No significant trend was observed for other score components, including total fruits and vegetables, processed meat, saturated fat, or sodium. The estimated percentage of US adults with poor diets (defined as <40% adherence to the primary AHA diet score components) declined from 55.9% to 45.6%, whereas the percentage with intermediate diets (defined as 40% to 79.9% adherence to the primary AHA diet score components) increased from 43.5% to 52.9%. Other dietary trends included increased consumption of whole fruit (0.15 servings/d; 95% CI, 0.05-0.26 servings/d) and decreased consumption of 100% fruit juice (0.11 servings/d; 95% CI, 0.04-0.18 servings/d). Disparities in diet quality were observed by race/ethnicity, education, and income level; for example, the estimated percentage of non-Hispanic white adults with a poor diet significantly declined (53.9% to 42.8%), whereas similar improvements were not observed for non-Hispanic black or Mexican American adults. There was little evidence of reductions in these disparities and some evidence of worsening by income level.
Conclusions and relevance: In nationally representative US surveys conducted between 1999 and 2012, several improvements in self-reported dietary habits were identified, with additional findings suggesting persistent or worsening disparities based on race/ethnicity, education level, and income level. These findings may inform discussions on emerging successes, areas for greater attention, and corresponding opportunities to improve the diets of individuals living in the United States.
Conflict of interest statement
Other authors report no conflicts of interest.
Figures
Figure 1.
Trends in mean consumption of fruits (Panel A), vegetables (Panel B), grains (Panel C), and nuts/seeds, legumes and eggs (Panel D) among US adults, based on NHANES data from 1999 to 2012. All values energy-adjusted to 2000 kcal/d using the residual method. Serving sizes: fruits, vegetables, legumes: 1 cup; grains, nuts/seeds, eggs: 1-oz equivalents.
Figure 2.
Trends in mean consumption of meats and seafood (Panel A), dairy (Panel B), added sugars, sugar-sweetened beverages, and low/non-calorie sweetened beverages (Panel C), and dietary fats (Panel D) among US adults, based on NHANES data from 1999 to 2012. Values in Panels A-C are energy-adjusted to 2000 kcal/d using the residual method. Serving sizes: meats, seafood: 3.5-oz equivalents; dairy: 1 cup; sugar-sweetened or low-calorie beverages: 8 fluid oz. PUFA=polyunsaturated fatty acid, MUFA=monounsaturated fatty acid, SFA=saturated fatty acid.
Figure 3.
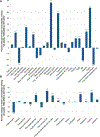
Percent change in intake of food groups (Panel A) and nutrients of interest (Panel B). Analyses are based on energy-adjusted values to 2000 kcal/d using the residual method. * p-trend<0.05; ** p-trend<0.01; *** p-trend<0.001
Figure 4.
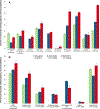
Trends in the proportion of US adults meeting dietary recommendations, based on NHANES data from 1999 to 2012. Recommendation levels are provided and are based on the 2015 Dietary Guidelines for Americans (for total vegetables, vegetables excluding starchy vegetables, total fruit, whole-grains, refined grains, nuts/seeds, seafood, calcium, added sugars, sodium and saturated fat; the American Heart Association 2020 Strategic Impact Goals (sugar-sweetened beverages; the Global Burden of Diseases study optimal intake levels (unprocessed red meat, processed meat); and pragmatic or alternative cutpoints (whole fruit, fruit juice, whole-grains [1+ serving]). Analyses are based on energy-adjusted values to 2000 kcal/d using the residual method. Serving sizes: fruits, vegetables: 1 cup; grains, nuts/seeds: 1-oz equivalents; meats, seafood: 3.5-oz equivalents. * p-trend<0.05; ** p-trend<0.01; *** p-trend<0.001; # 1999–2002 estimates could not be reliably imputed by the NCI method (see Supplemental Materials for details).
Figure 5.
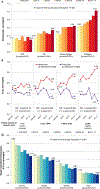
Trends in mean consumption of nuts/seeds by education (Panel A), fruit by family income (Panel B) and sugar-sweetened beverages by age (Panel C) among US adults, based on NHANES data from 1999 to 2012. All values are energy-adjusted to 2000 kcal/d using the residual method. Serving sizes: nuts/seeds: 1-oz equivalent; fruit: 1 cup; sugar-sweetened beverages: 8 fluid oz.
Comment in
- Changing Dietary Habits and Improving the Healthiness of Diets in the United States.
Denke MA. Denke MA. JAMA. 2016 Jun 21;315(23):2527-9. doi: 10.1001/jama.2016.7636. JAMA. 2016. PMID: 27327799 No abstract available.
Similar articles
- Trends in Diet Quality Among Youth in the United States, 1999-2016.
Liu J, Rehm CD, Onopa J, Mozaffarian D. Liu J, et al. JAMA. 2020 Mar 24;323(12):1161-1174. doi: 10.1001/jama.2020.0878. JAMA. 2020. PMID: 32207798 Free PMC article. - Trends and Disparities in Diet Quality Among US Adults by Supplemental Nutrition Assistance Program Participation Status.
Fang Zhang F, Liu J, Rehm CD, Wilde P, Mande JR, Mozaffarian D. Fang Zhang F, et al. JAMA Netw Open. 2018 Jun;1(2):e180237. doi: 10.1001/jamanetworkopen.2018.0237. JAMA Netw Open. 2018. PMID: 30498812 Free PMC article. - Trends in Diet Quality Among U.S. Adults From 1999 to 2020 by Race, Ethnicity, and Socioeconomic Disadvantage.
Liu J, Mozaffarian D. Liu J, et al. Ann Intern Med. 2024 Jul;177(7):841-850. doi: 10.7326/M24-0190. Epub 2024 Jun 18. Ann Intern Med. 2024. PMID: 38885507 - Dietary Patterns and All-Cause Mortality: A Systematic Review [Internet].
Boushey C, Ard J, Bazzano L, Heymsfield S, Mayer-Davis E, Sabaté J, Snetselaar L, Van Horn L, Schneeman B, English LK, Bates M, Callahan E, Venkatramanan S, Butera G, Terry N, Obbagy J. Boushey C, et al. Alexandria (VA): USDA Nutrition Evidence Systematic Review; 2020 Jul. Alexandria (VA): USDA Nutrition Evidence Systematic Review; 2020 Jul. PMID: 35258870 Free Books & Documents. Review. - Dietary Patterns and Risk of Cardiovascular Disease: A Systematic Review [Internet].
2020 Dietary Guidelines Advisory Committee, Dietary Patterns Subcommittee. 2020 Dietary Guidelines Advisory Committee, Dietary Patterns Subcommittee. Alexandria (VA): USDA Nutrition Evidence Systematic Review; 2020 Jul 15. Alexandria (VA): USDA Nutrition Evidence Systematic Review; 2020 Jul 15. PMID: 35294140 Free Books & Documents. Review.
Cited by
- Socioeconomic Inequalities in Food Consumption: A Cross-Sectional Study in Portuguese Adults.
Velhinho AR, Perelman J. Velhinho AR, et al. Port J Public Health. 2021 May 5;39(1):11-20. doi: 10.1159/000515937. eCollection 2021 Jul. Port J Public Health. 2021. PMID: 39469036 Free PMC article. - Inequalities in diet quality by socio-demographic characteristics, smoking, and weight status in a large UK-based cohort using a new UK diet quality questionnaire-UKDQQ.
Roberts K, Stephenson J, Holdsworth M, Relton C, Williams EA, Cade JE. Roberts K, et al. J Nutr Sci. 2024 Oct 10;13:e59. doi: 10.1017/jns.2024.60. eCollection 2024. J Nutr Sci. 2024. PMID: 39464404 Free PMC article. - Diet quality in young adulthood and sleep at midlife: a prospective analysis in the Bogalusa Heart Study.
Potts KS, Gustat J, Wallace ME, Ley SH, Qi L, Bazzano LA. Potts KS, et al. Nutr J. 2024 Oct 22;23(1):128. doi: 10.1186/s12937-024-01033-0. Nutr J. 2024. PMID: 39438945 Free PMC article. - The global burden of cardiovascular disease attributable to diet low in fiber among people aged 60 years and older, 1990-2019: an age-period-cohort analysis of the global burden of disease study.
Lv JJ, Zhang LJ, Yixi Z, Zhang YC, Li XY, Yang CH, Wang ML. Lv JJ, et al. BMC Public Health. 2024 Sep 27;24(1):2639. doi: 10.1186/s12889-024-19897-6. BMC Public Health. 2024. PMID: 39333980 Free PMC article. - Socio-demographic differences in the dietary inflammatory index from National Health and Nutrition Examination Survey 2005-2018: a comparison of multiple imputation versus complete case analysis.
Meadows RJ, Paskett ED, Bower JK, Kaye GL, Lemeshow S, Harris RE. Meadows RJ, et al. Public Health Nutr. 2024 Sep 27;27(1):e184. doi: 10.1017/S1368980024001800. Public Health Nutr. 2024. PMID: 39327915 Free PMC article.
References
Publication types
MeSH terms
LinkOut - more resources
Full Text Sources
Other Literature Sources


